NEBULAR PHASE OBSERVATIONS OF THE TYPE Ib SUPERNOVA 2008D/X-RAY TRANSIENT 080109: SIDE-VIEWED BIPOLAR EXPLOSION 11affiliation: Based on data collected at Subaru Telescope, which is operated by the National Astronomical Observatory of Japan.
Abstract
We present optical spectroscopic and photometric observations of supernova (SN) 2008D, associated with the luminous X-ray transient 080109, at days after the explosion (nebular phases). We also give flux measurements of emission lines from the H ii region at the site of the SN, and estimates of the local metallicity. The brightness of the SN at nebular phases is consistent with the prediction of the explosion models with an ejected 56Ni mass of 0.07 , which explains the light curve at early phases. The [O i] line in the nebular spectrum shows a double-peaked profile while the [Ca ii] line does not. The double-peaked [O i] profile strongly indicates that SN 2008D is an aspherical explosion. The profile can be explained by a torus-like distribution of oxygen viewed from near the plane of the torus. We suggest that SN 2008D is a side-viewed, bipolar explosion with a viewing angle of from the polar direction.
Subject headings:
supernovae: general — supernovae: individual (SN 2008D) — nuclear reactions, nucleosynthesis, abundances — line: profiles1. Introduction
On 2008 January 9, a luminous X-ray transient was serendipitously discovered in NGC 2770 during the follow-up observation of SN 2007uy in the same galaxy with the Swift satellite (Berger & Soderberg, 2008). An optical counterpart was also discovered at the position of the transient (Deng & Zhu, 2008; Valenti et al., 2008b), and it was named supernova (SN) 2008D (Li & Filippenko, 2008).
The total energy emitted at X-ray wavelengths is ergs, smaller than that of long gamma-ray bursts (GRBs) by a factor of (Soderberg et al., 2008). The origin of the X-ray emission is being debated. Soderberg et al. (2008), Chevalier & Fransson (2008), and Katz et al. (2009) interpreted the X-ray transient as a SN shock breakout. On the other hand, Xu et al. (2008), Li (2008) and Mazzali et al. (2008) suggested that the transient is the least energetic end of GRBs or X-ray flashes.
SN 2008D is classified as Type Ib because of the presence of He lines (Soderberg et al., 2008; Mazzali et al., 2008; Malesani et al., 2009; Modjaz et al., 2008c) while SNe associated with GRBs are all Type Ic (without He lines). The progenitor star of SN 2008D has a He layer prior to the explosion, and the He core mass is estimated to be 6-8 (Tanaka et al., 2009).
In this paper, we present optical spectroscopic and photometric observations of SN 2008D at 300 days after the explosion (nebular phases) with the Subaru telescope equipped with FOCAS (Kashikawa et al., 2002) and the Very Large Telescope (VLT) equipped with FORS1 (Appenzeller et al., 1998). We find that the spectrum of SN 2008D shows a double-peaked [O i] emission profile, suggesting that SN 2008D is a bipolar explosion viewed from near the equatorial direction.
2. Observations and Data Reduction
2.1. Spectroscopy
A spectroscopic observation of SN 2008D was performed on 2009 January 6 ( days) with the Subaru telescope. Hereafter denotes the epoch in observer’s frame measured from the explosion date, MJD=54474.56 (Malesani et al., 2009; Modjaz et al., 2008c).
Blue (4800-8000 Å) and red (6000-9000 Å) spectra were taken separately. We used a slit of width and two 300 lines mm-1 grisms. The slit was placed with the position angle of (north-south). Typical seeing during the observation was FWHM measured with star profiles in band. No filter was used for the blue spectrum, while the O58 filter was used for the red spectrum to eliminate second order light. The exposure time is 9000 and 3300 sec for the blue and red spectra, respectively. The wavelength resolution is .
The observed data were bias-subtracted and flat-corrected, and then two-dimensional spectra were extracted. Wavelength calibration was performed with a Th-Ar lamp.
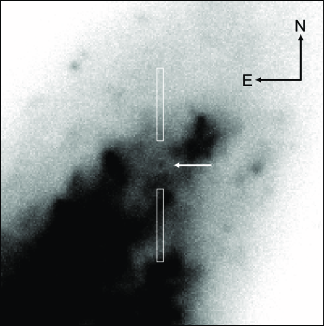
Since the SN is located inside a brightness trough which surrounds the SN position with a diameter of arcsec (see Figure 1), simultaneous subtraction of the background galaxy and sky lines using the neighboring region leads to negative SN flux. Thus, we first extracted a one-dimensional galaxy spectrum using the region at 3-12 arcsec north and south from the SN position (marked with boxes in Figure 1). Then, the galaxy spectrum was subtracted using the spatial profile at 6920-6990 Å, in which the SN does not show any emission line.
To maximize S/N of the SN spectra especially at emission lines, we extracted the galaxy spectrum using a wide region. Since the global color of the galaxy spectrum depends on the position somewhat, this leads to a slight over-subtraction in the extracted SN spectrum in the blue (see Figure 4). However, the profile of the SN emission lines are not affected by the choice of integrated region for the galaxy spectrum.
The background-subtracted spectra were summed into one-dimensional spectra, and then, the flux was calibrated using the spectrophotometric standard star Feige 34 (Oke, 1990). The blue and red spectra were combined, weighted by the exposure time. Finally, the spectrum is scaled with the -band magnitude (Section 2.3).
| Emission line | fluxaain units of . Extinction is not corrected for. |
|---|---|
| H 4861 | 9.42 0.68 |
| O iii 5007 | 1.97 0.61 |
| N ii 6548 | 2.32 0.66 |
| H 6563 | 33.1 0.9 |
| N ii 6584 | 7.00 1.27 |
| S ii 6717 | 4.69 0.52 |
| S ii 6731 | 3.18 0.55 |
| Date | MJD | Epoch aaDays after the explosion (MJD=54474.56) in the observer’s frame. | bbValue in parenthesis is total brightness without correction of the H ii region. | Telescope | ||||
|---|---|---|---|---|---|---|---|---|
| 2008 November 22 | 54792.5 | 317.9 | – | 22.4cc5 upper limit. | (22.7 0.3) | 22.4 0.5 | Subaru | |
| 2009 January 6 | 54837.5 | 362.9 | 22.8cc5 upper limit. | 22.2cc5 upper limit. | (23.2 0.4) | 22.1cc5 upper limit. | Subaru | |
| 2009 February 19 | 54881.2 | 406.6 | – | 23.6cc5 upper limit. | (23.9 0.4) | 22.9cc5 upper limit. | – | VLT |
2.2. Narrow emission lines from the H ii region
There are very strong narrow emission lines from the H ii region at the position of the SN. Because of the faintness of the SN at nebular phases, the flux of the narrow emission lines can be easily measured. Table 1 shows measured flux of the emission lines. Extinction is not corrected for.
From the line ratios, we can estimate gas metallicity at the site of SN 2008D. Thöne et al. (2009) presented metallicity measurements using the data taken soon after the explosion. We use N2 and O3N2 indexes to estimate the metallicity (Pettini & Pagel, 2004): N2 log([N ii] 6584/ H) and O3N2 log( ([O iii] 5007/ H)/ ([N ii] 6584/ H) ). Note that these indexes are almost independent on the extinction because of the vicinity of the lines ([N ii] and H, [O iii] and H). Pettini & Pagel (2004) give the following relations calibrated with the metallicity estimated by method: 12 + log(O/H) = 9.37 + 2.03N2 + 1.26N22 + 0.32N23 and 8.73 0.32O3N2, for N2 and O3N2 indexes, respectively.
Using these relations, metallicity is estimated to be 12+log(O/H) = (N2) and (O3N2). The error above includes the 1 dispersion in the relation (0.18 and 0.14 for N2 and O3N2, respectively). These are consistent with the solar metallicity (12+log(O/H)=8.66, Asplund et al. 2004) within the error, but larger than those by Thöne et al. (2009) by 0.2dex (with the same indexes). The host galaxies of the GRB-associated SNe (GRB 030329/SN 2003dh, GRB 031203/SN 2003lw, XRF 020903, XRF 060218/SN 2006aj) have 12 + log(O/H) in O3N2- scale (Modjaz et al., 2008a). Thus, the metallicity at the site of SN 2008D is higher than that in those environments, as pointed by Thöne et al. (2009).
2.3. Photometry
Photometric observations in were performed on 2008 November 22 ( days), 2009 January 6 ( days, Figure 1), and February 19 ( days). We detected a point source at the SN position in the band at three epochs and the band at one epoch. A log of the observations is shown in Table 2. We performed PSF photometry for the - and -band images, where a source is detected. For the images in which the SN was not detected, limiting magnitudes were derived using the local sky noise around the SN position, and further checked using artificial sources.
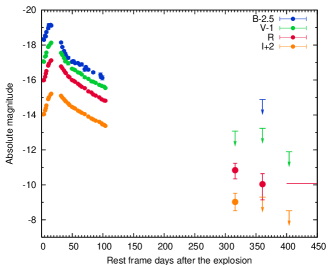
Since the locally strong emission of the H ii region is present at the SN position, our -band photometry overestimates the SN brightness. We have corrected for this effect by estimating the contribution of the narrow lines using the observed spectrum at days ( mag, the red horizontal line in Figure 2). The error in the SN magnitudes at and days does not include the uncertainty caused by the contamination from galaxy light. For the data at days, we refrain from measuring the SN component because of the large uncertainty in the total flux as well as in the galaxy contribution.
3. Light Curves Until Nebular Phases
Figure 2 shows the absolute magnitudes of SN 2008D. For the reddening, mag is assumed (Mazzali et al., 2008; Modjaz et al., 2008c), and the reddening law of Cardelli et al. (1989) is adopted. For the distance to the SN, is assumed (Modjaz et al., 2008c). The data at early phases ( days) are taken from T. Minezaki et al. (in preparation).
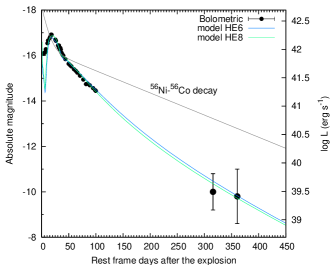
We estimate the bolometric luminosity of SN 2008D at nebular phases. Since multicolor observations are not available at nebular phases, we use the bolometric correction of the well-observed SN 2002ap (Yoshii et al., 2003; Tomita et al., 2006). We define the bolometric correction as BC , where is the bolometric magnitude constructed from magnitudes, and is the reddening corrected, absolute -band magnitude (as plotted in Figure 2). The BC of SN 2008D is found to be consistent with that of SN 2002ap within 0.3 mag at early phases ( mag). The BC of SN 2002ap at nebular phases are applied to SN 2008D by interpolating the epoch. The estimated BC for SN 2008D is and mag at and 362.9 days, respectively. For the bolometric magnitudes, a systematic uncertainty of 0.3 mag has been added.
The bolometric light curve is shown in Figure 3. The models by Tanaka et al. (2009, blue and green lines), with an ejected 56Ni mass of 0.07 , are shown for comparison. These models reproduce the bolometric light curve at early phases. The bolometric magnitudes at nebular phases are consistent with the prediction of these models. Ejecta mass and kinetic energy are different in two models [(/, /erg) = (4.4, 3.7) and (6.2, 8.4) for model HE6 and HE8, respectively]. However, since the difference in the predicted luminosity is very small, our observations at nebular phases do not discriminate between these two models.
4. Nebular Spectrum
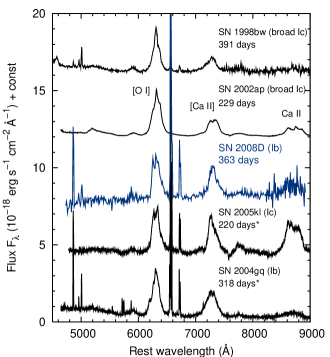
Figure 4 shows the nebular spectrum of SN 2008D (blue line) taken at days after the explosion. The spectrum is binned into 10 Å, similar to the wavelength resolution at Å. It is compared with nebular spectrum of SNe 1998bw (broad Ic, Patat et al., 2001), 2002ap (broad Ic, Mazzali et al., 2007), 2005kl (Ic, Maeda et al., 2008), and 2004gq (Ib, Maeda et al., 2008). The spectrum of SN 2008D clearly shows emission lines of [O i] and [Ca ii]. These lines are commonly seen in the nebular spectra of other Type Ib/c SNe. The Ca ii IR triplet is marginally detected around 8600 Å. Narrow lines at 4800-5000 Å and 6500-6900 Å originate in the H ii region of the host galaxy.
4.1. Line profile
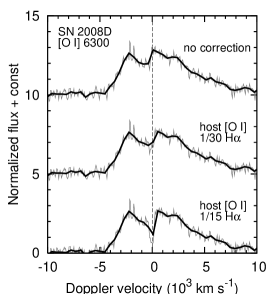
The [O i] line of SN 2008D shows a double-peaked profile. However, given the strong narrow emission lines from the H ii region, the broad [O i] line of the SN could possibly be contaminated by the narrow [O i] line from the H ii region. Since the strength of the narrow [O i] line is of H around the SN position, we subtract the scaled, gaussian-fitted H profile at the position of [O i]. Figure 5 shows the original profile (no correction, top) compared with the profiles corrected with 1/30 and 1/15 of the H line (middle and bottom, respectively). Although the peak at km s-1 in the original spectrum may be due to the contamination of the narrow emission line, the broad, double-peak profile is not affected by the contamination.
The [O i] line shows a double-peaked profile, while such clear two peaks are not seen in the [Ca ii] line. Although these properties were also seen in the spectrum taken at days (Modjaz et al., 2008c), transparency of the ejecta was not sure at such a transition epoch from photospheric to nebular phases. In fact, evolution of the profile from days is not significant. Possible change can be seen in the redder peak of the [O i] line. At days it is clearly located at km s-1, but the position can be redder at days, depending on the contamination of narrow [O i] line from the H ii region.
The [O i] line profile is compared with other SNe in the left panel of Figure 6. Double-peaked profiles are also seen in other Type Ib/c SNe (Sollerman et al., 1998; Mazzali et al., 2005; Valenti et al., 2008a; Maeda et al., 2008; Modjaz et al., 2008b). The fraction of SNe showing a double-peaked [O i] line is roughly (Maeda et al., 2008).
Since our observation is late enough for the ejecta to be optically thin, the double-peaked profile of the [O i] line is unlikely to be caused by optical depth effects (Taubenberger et al., 2009). It is also unlikely to be caused by a combination of the two [O i] lines ( 6300 and 6364) since the strength of the two peaks is comparable (the strength ratio is 3:1 in optically thin limit, Leibundgut et al. 1991).
In addition, if the double-peaked [O i] profile were caused by asphericity in the distribution of the heating source (56Ni), the [Ca ii] line would also show a double-peaked profile. Thus, the profile of [O i] line reflects the distribution of excited O i. The [O i] and [Ca ii] lines may arise from different sites (Fransson & Chevalier, 1989).
4.2. Comparison with the model
 |
 |
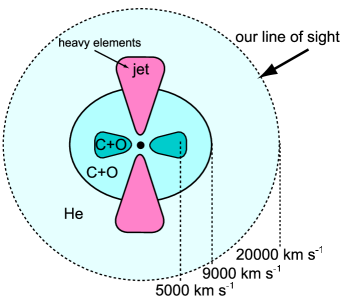
A simple explanation for the double-peaked [O i] profile is that oxygen has a torus-like distribution and our line of sight is near the plane of the torus (Maeda et al. 2002; Mazzali et al. 2005; Maeda et al. 2008; Modjaz et al. 2008b, but see also discussion by Milisavljevic et al. 2009). The torus-like distribution of the presupernova elements, such as oxygen and carbon, can be realized in a bipolar explosion (see Figure 7 for a schematic picture), where more energy is deposited in the polar region, and nucleosynthesis takes place there (e.g., Nagataki et al., 1997; Khokhlov et al., 1999; Maeda & Nomoto, 2003). A bipolar explosion has also been suggested for SN 2008D by polarimetric observations (Gorosabel et al., 2008).
Nebular emission profiles from bipolar models have been examined by Maeda et al. (2006), and compared to nebular spectra of various SNe Ib/c (Maeda et al., 2008). In the right-hand panel of Figure 6, the profiles calculated with a bipolar explosion model BP8 (highly aspherical model) by Maeda et al. (2006) are shown for comparison. The kinetic energy of the model is erg ( defined in Maeda et al. 2006), which is smaller than that estimated for SN 2008D (e.g., Tanaka et al., 2009). This is because the models of Maeda et al. (2006) include only the C+O core. In SN 2008D, and in the models of Tanaka et al. (2009), the He layer is present, and it contains the rest of the kinetic energy.
The line profile of SN 2008D is explained most nicely by a viewing angle of . The double-peaked profile is seen only when the viewing angle is . If the asphericity is smaller, this dividing angle is larger. Since the viewing angle and degree of asphericity have a degenerate effect, we cannot argue that a large asphericity as in model BP8 is preferred for SN 2008D. However, it is true irrespective of the models that our line of sight should be from the polar direction. If the angle is smaller, the [O i] line would show a single-peaked profile (see SNe 1998bw, 2004gq and 2002ap and models in Figure 6).
5. Conclusions
We have presented spectroscopic and photometric observations of SN 2008D at nebular phases. Flux measurements of the narrow emission lines from the H ii region at the site of the SN and the estimates of the local metallicity were also given. In photometric observations, the SN was detected in and . The brightness at nebular phases is consistent with the prediction of explosion models with an ejected 56Ni mass of 0.07 , which explain the light curve at early phases.
In the nebular spectrum taken at a sufficiently late phase, the [O i] line clearly shows a double-peaked profile, while such a profile is not seen in the [Ca ii] line. The evolution of the profile from days (Modjaz et al., 2008c) turned out not to be significant. The double-peaked profile cannot be explained by a spherically symmetric explosion, and it strongly indicates that SN 2008D is an aspherical explosion. The profile can be explained by a torus-like distribution of excited O i viewed from the side (Figure 7). Our line of sight is from the polar direction, irrespective of the degree of asphericity.
References
- Appenzeller et al. (1998) Appenzeller, I., et al. 1998, The Messenger, 94, 1
- Asplund et al. (2004) Asplund, M., Grevesse, N., Sauval, A. J., Allende Prieto, C., & Kiselman, D. 2004, A&A, 417, 751
- Berger & Soderberg (2008) Berger, E., & Soderberg, A. M. 2008, GRB Coordinates Network, 7159, 1
- Cardelli et al. (1989) Cardelli, J. A., Clayton, G. C., & Mathis, J. S. 1989, ApJ, 345, 245
- Chevalier & Fransson (2008) Chevalier, R. A., & Fransson, C. 2008, ApJ, 683, L135
- Deng & Zhu (2008) Deng, J., & Zhu, Y. 2008, GRB Coordinates Network, 7160, 1
- Fransson & Chevalier (1989) Fransson, C., & Chevalier, R. A. 1989, ApJ, 343, 323
- Gorosabel et al. (2008) Gorosabel, J., et al. 2008, submitted to ApJL (arXiv:0810.4333)
- Kashikawa et al. (2002) Kashikawa, N., et al. 2002, PASJ, 54, 819
- Katz et al. (2009) Katz, B., Budnik, R., & Waxman, E. 2009 (arXiv:0902.4708)
- Khokhlov et al. (1999) Khokhlov, A. M., Höflich, P. A., Oran, E. S., Wheeler, J. C., Wang, L., & Chtchelkanova, A. Y. 1999, ApJ, 524, L107
- Leibundgut et al. (1991) Leibundgut, B., Kirshner, R. P., Pinto, P. A., Rupen, M. P., Smith, R. C., Gunn, J. E., & Schneider, D. P. 1991, ApJ, 372, 531
- Li (2008) Li, L.-X. 2008, MNRAS, 388, 603
- Li & Filippenko (2008) Li, W., & Filippenko, A. V. 2008, Central Bureau Electronic Telegrams, 1202, 3
- Maeda et al. (2008) Maeda, K., et al. 2008, Science, 319, 1220
- Maeda et al. (2002) Maeda, K., Nakamura, T., Nomoto, K., Mazzali, P. A., Patat, F., & Hachisu, I. 2002, ApJ, 565, 405
- Maeda & Nomoto (2003) Maeda, K., & Nomoto, K. 2003, ApJ, 598, 1163
- Maeda et al. (2006) Maeda, K., Nomoto, K., Mazzali, P. A., & Deng, J. 2006, ApJ, 640, 854
- Malesani et al. (2009) Malesani, D., et al. 2009, ApJ, 692, L84
- Mazzali et al. (2007) Mazzali, P. A., et al. 2007, ApJ, 670, 592
- Mazzali et al. (2005) —. 2005, Science, 308, 1284
- Mazzali et al. (2008) —. 2008, Science, 321, 1185
- Milisavljevic et al. (2009) Milisavljevic, D., Fesen, R., Gerardy, C., Kirshner, R., & Challis, P. 2009 (arXiv:0904.4256)
- Modjaz et al. (2008a) Modjaz, M., et al. 2008a, AJ, 135, 1136
- Modjaz et al. (2008b) Modjaz, M., Kirshner, R. P., Blondin, S., Challis, P., & Matheson, T. 2008b, ApJ, 687, L9
- Modjaz et al. (2008c) Modjaz, M., et al. 2008c, submitted to ApJ (arXiv:0805.2201)
- Nagataki et al. (1997) Nagataki, S., Hashimoto, M.-A., Sato, K., & Yamada, S. 1997, ApJ, 486, 1026
- Oke (1990) Oke, J. B. 1990, AJ, 99, 1621
- Patat et al. (2001) Patat, F., et al. 2001, ApJ, 555, 900
- Pettini & Pagel (2004) Pettini, M., & Pagel, B. E. J. 2004, MNRAS, 348, L59
- Soderberg et al. (2008) Soderberg, A. M., et al. 2008, Nature, 453, 469
- Sollerman et al. (1998) Sollerman, J., Leibundgut, B., & Spyromilio, J. 1998, A&A, 337, 207
- Tanaka et al. (2009) Tanaka, M., et al. 2009, ApJ, 692, 1131
- Taubenberger et al. (2009) Taubenberger, S., et al. 2009, MNRAS, in press (arXiv:0904.4632)
- Thöne et al. (2009) Thöne, C. C., Michałowski, M. J., Leloudas, G., Cox, N. L. J., Fynbo, J. P. U., Sollerman, J., Hjorth, J., & Vreeswijk, P. M. 2009, ApJ, 698, 1307
- Tomita et al. (2006) Tomita, H., et al. 2006, ApJ, 644, 400
- Valenti et al. (2008a) Valenti, S., et al. 2008a, MNRAS, 383, 1485
- Valenti et al. (2008b) Valenti, S., Turatto, M., Navasardyan, H., Benetti, S., & Cappellaro, E. 2008b, GRB Coordinates Network, 7163, 1
- Xu et al. (2008) Xu, D., Watson, D., Fynbo, J., Fan, Y., Zou, Y.-C., & Hjorth, J. 2008, in COSPAR, Plenary Meeting, Vol. 37, 37th COSPAR Scientific Assembly, 3512–+
- Yoshii et al. (2003) Yoshii, Y., et al. 2003, ApJ, 592, 467