Single-particle and collective slow dynamics of colloids in porous confinement
Abstract
Using molecular dynamics simulations we study the slow dynamics of a hard sphere fluid confined in a disordered porous matrix. The presence of both discontinuous and continuous glass transitions as well as the complex interplay between single-particle and collective dynamics are well captured by a recent extension of mode-coupling theory for fluids in porous media. The degree of universality of the mode-coupling theory predictions for related models of colloids is studied by introducing size-disparity between fluid and matrix particles, as well as softness in the interactions.
pacs:
82.70.Dd, 64.70.pv, 83.10.Rs, 46.65.+gInvestigations of the dynamic properties of fluids confined in a disordered porous matrix have recently attracted considerable attention in the scientific community both from a fundamental and from a technological point of view. Of particular interest is the glass formation process where the single-particle and the collective dynamics of the fluid are exposed to the complex interplay between confinement and connectivity of the pores. While a considerable amount of experimental results has been compiled in this field Alcoutlabi and McKenna (2005); McKenna (2007), theoretical investigations are still rare: remarkable computer simulations on a few selected state points and systems have been performed Kim (2003); Gallo et al. (2003), but systematic studies of this phenomenon are difficult due to the large computational cost caused by the requirement of long simulations and by the thermodynamic averaging prescriptions for these systems.
A breakthrough in the theoretical investigations was achieved with the formalism put forward by Krakoviack Krakoviack (2005, 2007, 2007) who successfully combined two concepts to study the dynamics of fluids confined in disordered porous matrices. On one hand, his framework is based on the replica Ornstein-Zernike (ROZ) formalism Given and Stell (1992), where the system at hand is viewed as a quenched-annealed (QA) mixture of mobile fluid particles and immobile matrix particles. The other ingredient is mode-coupling theory (MCT) Götze and Sjögren (1992): based on the static correlations of the system, MCT predicts the time dependence of the single-particle (“self”) and collective density correlators. MCT has been able to identify new and unexpected features in the dynamics of colloidal systems Sciortino and Tartaglia (2005); Zaccarelli (2007); Mayer et al. (2008); Sciortino et al. (2003) and provides a convincing account of the early stages of the structural arrest in molecular glass-forming liquids Götze (1999).
The results for the kinetic diagram of a simple hard sphere (HS) fluid in a HS matrix, evaluated using the MCT framework with ROZ structure factors as an input, contains indeed a wealth of intriguing features Krakoviack (2007, 2007): (i) two types of glass transitions are encountered, a discontinuous type B transition at low matrix packing fractions (), and a continuous type A transition at large 111The infinite time limit of density correlators changes discontinuously (continuously) from zero to finite values at a type B (type A) transition.; the two transition lines meet at a degenerate high order singularity point (A3). Further, the theory predicts (ii) a re-entrant glass transition for large and (iii) a continuous diffusion-localization transition that occurs only in the self dynamics; the latter transition is driven by the localization of particles in disconnected void domains formed by the matrix Krakoviack (2007), as in the Lorentz model Höfling et al. (2006).
This Letter aims in two directions: on one side we provide for the first time a parallel study to Krakoviack’s main theoretical predictions by means of computer simulations for the same HS system. The simulations provide, in addition, a “realistic” picture of the above dynamic effects as opposed to the “idealized” view that emerges from MCT. On the other hand, with the help of the ROZ+MCT framework we explore the parameter space of two further types of potentials to find out to which degree the predicted dynamic features are generic. To this end we mimic typical interactions encountered in colloidal systems by introducing a size disparity between matrix and fluid particles (establishing thereby a link to the size-asymmetric mixtures investigated in Thakur and Bosse (1991); Moreno and Colmenero (2006); Voigtmann and Horbach (2008)) and softness in the interparticle interaction.
By means of event-driven molecular dynamics (MD) we study a QA system of hard spheres in three dimensions under periodic boundary conditions. As in the monodisperse model studied in Krakoviack (2007), both matrix and fluid particles have the same diameter and mass . The total number of particles was . In the following, we use and as units of length and time, respectively Allen and Tildesley (1987). The porous matrix was generated by quenching an equilibrium fluid configuration at a packing fraction . Subsequently, the fluid component with packing fraction was inserted into the remaining volume using an optimized inflation algorithm. For each state point, dynamic properties were averaged over ten independent realizations of the system. The fluid component was considered equilibrated if the total mean squared displacement (MSD) exceeded within a simulation time of . State points for which at least half of the system realizations did not meet this criterion were considered glassy. No signs of crystallization were observed. The MCT equations for QA systems were solved using the numerical procedure outlined in Krakoviack (2007, 2007). For the HS system, the connected and blocked structure factors, used as an input for the MCT equations, were determined by solving the ROZ equations Given and Stell (1992) with the Percus-Yevick (PY) closure relation. The so-obtained critical packing fractions and exponents typically agree within few percent with those reported in Krakoviack (2007, 2007).
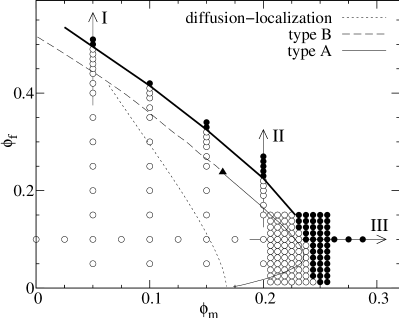
In Fig. 1 we show in the -plane the glass and the diffusion-localization transition lines obtained from MCT Krakoviack (2007, 2007) together with the dynamic arrest line determined from simulations. The arrest line interpolates through points with adjacent equilibrated and glassy state points. The shape of the arrest line resembles qualitatively the ideal MCT glass line, but it starts bending downwards more rapidly for . Performing simulations on a fine mesh in and we found that the arrest line is not re-entrant at small . We will show below that this apparent discrepancy can be rationalized in terms of a crossover from glass to diffusion-localization transition in the self dynamics.
To investigate in more detail the different transition scenarios predicted by MCT, we focus on selected paths (indicated by arrows and labelled in Fig. 1) across the -plane. We study both the self part and the connected part of the intermediate scattering function Krakoviack (2007), where , , and indicates a thermal average. is the appropriate correlator to characterize the slow collective dynamics of fluids in porous media, since the conventional coherent intermediate scattering function, , fails to decay to zero at long times due to matrix-induced average density fluctuations Krakoviack (2007).
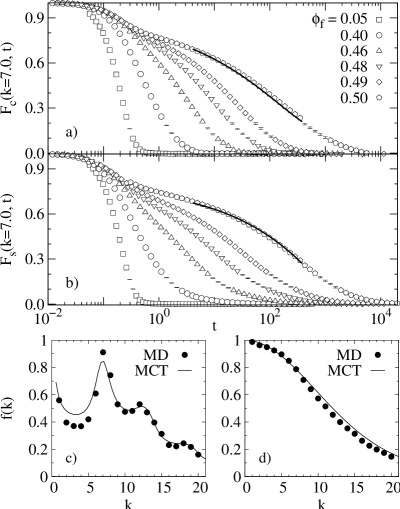
Figure 2 shows the evolution of the intermediate scattering functions upon increasing at fixed (path I). The wave-vector considered is , close to the main peak of the fluid-fluid static structure factor. Both the self and the collective dynamics slow down significantly as increases towards 0.51, while a plateau at intermediate develops both in and in . These features are similar to those observed in bulk glass-forming liquids and are compatible with a “smeared” type B transition. The difference between the MCT critical packing fraction, , and the glass transition observed in our simulations amounts to 15%. Similar discrepancies have been reported in investigations on bulk hard spheres and suspensions of hard colloids Götze (1999).
To test the predictions of MCT at a more quantitative level, we describe the dynamics within the -relaxation regime (close to the plateau) using the second-order asymptotic expansion of the MCT -correlator, Götze and Sjögren (1992). We perform a simultaneous fit to all integer wave-vectors at the largest equilibrated packing fraction, . The result for is included in Fig. 2; the exponent is for and for . The range over which the fit can be considered reliable covers decades in time. The estimated uncertainty on accounts for the sensitivity of the fit to the choice of the time range. The fitted values are somewhat smaller than (independent of correlators) obtained from numerical solution of the MCT equations, which may be due to the limited time window available for fitting the simulation data. Further, in the bottom panels of Fig. 2 we show the non-ergodicity parameter for both self and connected correlators. In both cases, compares well with the MCT predictions at , i.e., only slightly above . Comparisons of similar quality have been reported for bulk glass-formers Nauroth and Kob (1997); Sciortino and Kob (2001). We conclude that MCT is able to describe at a semi-quantitative level the slow dynamics of the QA system in this portion of the kinetic diagram.
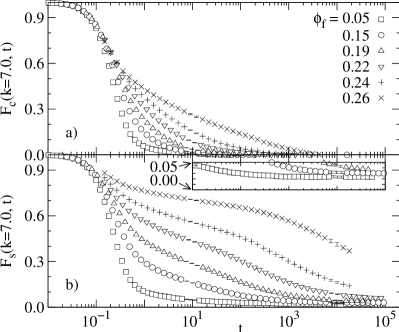
A more complex scenario appears at large , where the stronger influence of the matrix structure changes the nature of the transition. In Fig. 3 we show the intermediate scattering functions for at constant (path II in Fig. 1). Along this path, the relaxation patterns for self and collective correlators differ markedly as is varied. The relaxation of becomes slower as increases. Contrary to the case of dilute matrices, however, there is no finite-height plateau at intermediate times. This indicates the approach to a continuous type A glass transition, consistent with MCT predictions along path II. On the other hand, the decay of occurs in two steps, with a first inflection () and a subsequent stretched decay at long times to a finite plateau. Upon increasing the plateau rises continuously starting from values close to 0, as one expects in a type A transition. These features of are consistent with those predicted by MCT across the continuous diffusion-localization transition (dotted line in Fig. 1).
The cascade of decays in hence arises from the interplay between two dynamic effects: a weak, collective mechanism of caging by fluid particles and an effective trapping in the voids left by the matrix particles. The superposition of glass and diffusion-localization transitions leads to an effective “decoupling” between self and collective dynamics. In fact, at the largest equilibrated along path II () the ratio of the relaxation times, defined via the decay to of the corresponding correlators, is already larger than for . As a result, the dynamic arrest line (see Fig. 1) bends downwards rapidly in the large-, small- part of the diagram, following the trend of the diffusion-localization line. Further work is required to assess whether the predicted re-entrance of the glass line exists or if it is hindered by the progressive arrest of the self dynamics.
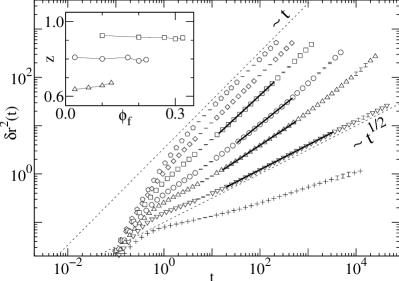
According to MCT, the stretched decay of self correlators for large close to the diffusion-localization line is associated with a sub-diffusive behavior in the MSD Krakoviack (2007). In Fig. 4 we show the evolution of the MSD at constant (path III in Fig. 1). Note that upon increasing along this path, the slowing down of the self dynamics is dictated by the diffusion-localization transition. For , the ballistic regime is followed by normal diffusion . However, for , the system becomes sub-diffusive, i.e., with , over an intermediate time window that becomes broader as increases. As in the Lorentz model Höfling et al. (2006), decreases as increases. Up to a , normal diffusion is eventually recovered at longer times, while for larger the MSD tends to saturate. Close to , the sub-diffusion exponent is , in striking agreement with the MCT prediction along the diffusion-localization line ( Krakoviack (2007)). Remarkably, we also find that is nearly independent of at fixed (see inset of Fig. 4). Hence, even at finite , the diffusion-localization transition is intimately related to the geometrical properties of the matrix.

To assess the degree of universality of the scenario predicted by the ROZ+MCT formalism, we solved the MCT equations for related QA systems based on purely repulsive interactions. Specifically, we considered additive hard spheres with size ratio and soft spheres interacting with inverse power potentials where . In the latter case, we used and the structure factors were calculated at a temperature by solving the ROZ equations in combination with the hypernetted-chain approximation 222In the same range of , the PY closure did not to lead to the correct variation of as a function of for .. In Fig. 5 we show results for selected values of and . The topology of the MCT kinetic diagrams of the studied systems is very similar to the one shown in Fig. 1, but subtle differences are observed as system parameters vary. As decreases in the HS systems, the glass line shifts to smaller and the crossing point between type B and A transitions moves towards the turning point of the glass line. On the other hand, in the soft sphere systems the glass line shifts to larger as decreases (as expected), and the diffusion-localization line becomes clearly re-entrant. We plan to investigate these features in more detail in future work.
In conclusion, we revealed the existence of a subtle interplay between self and collective dynamics in a QA model of fluid in porous confinement. The MCT framework for QA systems Krakoviack (2005, 2007, 2007) provides idealized but consistent guidelines to explain the dynamic features apparent for both dilute and dense matrices. This includes the superposition of glass transitions, driven by a collective caging mechanism, and diffusion-localization transitions, associated with the ceasing percolation of voids in the matrix structure. The predicted features should be generic for a broad class of model colloidal fluids adsorbed in porous media, and should be observed experimentally in colloidal suspensions confined in porous matrix configurations, quenched for instance by optical tweezers.
Acknowledgements.
The authors gratefully acknowledge computational aid by D. Schwanzer and helpful discussions with V. Krakoviack. This work was funded by the Austrian Science Foundation (FWF) under Proj. No. P19890-N16.Note—While finalizing this paper, we became aware of a recent paper by Kim et al. Kim et al. (2009), which focuses on a related model. Their results for the HS QA system are consistent with the analysis presented here.
References
- Alcoutlabi and McKenna (2005) M. Alcoutlabi and G. B. McKenna, J. Phys.: Condens. Matter 17, R461 (2005).
- McKenna (2007) G. B. McKenna, Eur. Phys. J.-Spec. Top. 141, 291 (2007).
- Kim (2003) K. Kim, Europhys. Lett. 61, 790 (2003).
- Gallo et al. (2003) P. Gallo, R. Pellarin, and M. Rovere, Phys. Rev. E 67, 041202 (2003).
- Krakoviack (2005) V. Krakoviack, Phys. Rev. Lett. 94, 065703 (2005).
- Krakoviack (2007) V. Krakoviack, Phys. Rev. E 75, 031503 (2007).
- Krakoviack (2007) V. Krakoviack, Phys. Rev. E 79, 061501 (2009).
- Given and Stell (1992) J. A. Given and G. Stell, J. Chem. Phys. 97, 4573 (1992).
- Götze and Sjögren (1992) W. Götze and L. Sjögren, Rep. Prog. Phys. 55, 241 (1992).
- Sciortino and Tartaglia (2005) F. Sciortino and P. Tartaglia, Adv. Phys. 54, 471 (2005).
- Zaccarelli (2007) E. Zaccarelli, J. Phys.: Condens. Matter 19, 323101 (2007).
- Mayer et al. (2008) C. Mayer, E. Zaccarelli, E. Stiakakis, C. N. Likos, et al., Nature Mat. 7, 780 (2008).
- Sciortino et al. (2003) F. Sciortino, P. Tartaglia, and E. Zaccarelli, Phys. Rev. Lett. 91, 268301 (2003).
- Götze (1999) W. Götze, J. Phys.: Condens. Matter 11, A1 (1999).
- Höfling et al. (2006) F. Höfling, T. Franosch, and E. Frey, Phys. Rev. Lett. 96, 165901 (2006).
- Thakur and Bosse (1991) J. S. Thakur and J. Bosse, Phys. Rev. A 43, 4378 (1991).
- Moreno and Colmenero (2006) A. J. Moreno and J. Colmenero, Phys. Rev. E 74, 021409 (2006).
- Voigtmann and Horbach (2008) T. Voigtmann and J. Horbach, arXiv:0812.3599 (2008).
- Allen and Tildesley (1987) M. P. Allen and D. J. Tildesley, Computer Simulation of Liquids (Clarendon Press, Oxford, 1987).
- Nauroth and Kob (1997) M. Nauroth and W. Kob, Phys. Rev. E 55, 657 (1997).
- Sciortino and Kob (2001) F. Sciortino and W. Kob, Phys. Rev. Lett. 86, 648 (2001).
- Kim et al. (2009) K. Kim, K. Miyazaki, and S. Saito, arXiv:0904.4524 (2009).