The Quasar SDSS J1536+0441: An Unusual Double-Peaked Emitter
Abstract
The quasar SDSS J153636.22+044127.0, exhibiting peculiar broad emission-line profiles with multiple components, was proposed as a candidate sub-parsec binary supermassive black hole system. More recently, imaging revealed two spatially distinct sources, leading some to suggest the system to be a quasar pair separated by 5 kpc. We present Palomar and Keck optical spectra of this system from which we identify a third velocity component to the emission lines. We argue that the system is more likely an unusual member of the class of active galactic nuclei (AGNs) known as “double-peaked emitters” than a sub-parsec black hole binary or quasar pair. We find no significant velocity evolution of the two main peaks over the course of 0.95 yr, with a upper limit on any secular change of 70 km s-1 yr-1. We also find that the three velocity components of the emission lines are spatially coincident to within 0015 along the slit, apparently ruling out the double-quasar hypothesis.
Subject headings:
quasars: individual (SDSS J153636.22+044127.0) — accretion, accretion disks1. Introduction
When galaxies merge, it is expected that their central supermassive black holes will form a binary which will also eventually merge via the emission of gravitational radiation (Begelman et al., 1980). The process by which the orbit of the two black holes shrinks to the point at which gravitational radiation is effective in producing a merger within a Hubble time is not currently understood (dubbed the “final parsec problem”; e.g., Milosavljevic & Merritt 2003), and the observational signatures of such systems have proved to be elusive.
Boroson & Lauer (2009; hereafter BL09) recently identified a candidate sub-parsec binary supermassive black hole system which could potentially merge in less than a Hubble time. They searched the Sloan Digital Sky Survey (SDSS; Abazajian et al. 2009) quasar spectra and identified the object SDSS J153636.33+044127.0 (hereafter SDSS J1536+0441) as one of two low-redshift () quasars exhibiting components having multiple redshifts. The key features of the system are two components of the broad emission lines separated by km s-1. They interpreted these to be the result of broad-line regions around a pair of black holes with masses of 107.3 and 108.9 M⊙, with the relative velocity being a result of the orbital motion in a binary having a sub-parsec semimajor axis with a period of 100 years.
The night after the BL09 publication came to our attention, we obtained Palomar spectra and identified a third velocity component of the broad emission lines (Chornock et al., 2009). This led us to conclude that SDSS J1536+0441 was instead an unusual member of the class of AGNs known as “double-peaked emitters” (e.g., Halpern & Filippenko 1988; Eracleous & Halpern 1994; Strateva et al. 2003), a suggestion that was later made independently by Gaskell (2009).
Radio observations by Wrobel & Laor (2009) led those authors to suggest a third possibility: that of a quasar pair. They identified two radio sources separated by 097 in Very Large Array (VLA) observations of SDSS J1536+0441. Subsequently, Decarli et al. (2009a) found that the two radio sources were coincident with a pair of -band sources that they suggested were members of a 5 kpc quasar pair. As we completed this work, a second preprint by Lauer & Boroson (2009; hereafter LB09) appeared. They presented Hubble Space Telescope (HST) images confirming the double nature of the optical source, but they also argued that the optical data were inconsistent with a double-quasar hypothesis.
In §2 of this Letter, we present the Palomar spectra that led to our initial identification of this source as a double-peaked emitter, as well as additional high-quality Keck spectra. We set upper limits on the long-term evolution of velocity shifts of the broad peaks and on any spatial offset of the emission regions in §3. We then argue (§4) that the double-peaked emitter nature of this object provides a better explanation than the alternatives. LB09 reached similar conclusions, so we compare with their results where appropriate and highlight our differences.
2. Observations
Our initial spectroscopy was performed using the Double Spectrograph on the Palomar 5-m Hale telescope (Oke & Gunn, 1982); two 600 s exposures were obtained on 2009 March 7.52 UT. The blue-side (3150–5700 Å) observations we present here had a spectral resolution of 6 Å from the combination of a 15 slit and the 300/3990 grating. In addition, we obtained a pair of 600 s observations with the Echellette Spectrograph and Imager (ESI; Sheinis et al. 2002) on the Keck II 10-m telescope on 2009 March 22.64 UT. The 075 slit was used, giving a resolution of 45 km s-1 over the range 4000–10,200 Å.
The two-dimensional (2D) images were processed and the spectra were extracted using standard routines in IRAF111IRAF is distributed by the National Optical Astronomy Observatories, which are operated by the Association of Universities for Research in Astronomy, Inc., under cooperative agreement with the National Science Foundation.. Our own IDL routines were used to flux calibrate the individual ESI echellette orders and remove telluric absorption features, as well as to combine the individual orders together over their overlap regions to make the final spectrum. The wavelength scale was established using comparison-lamp spectra, with small shifts ( Å) of the zeropoints of the wavelength scales found by cross correlating the night-sky lines in the object observations against reference-sky spectra. The flux level of the first ESI observation was scaled up by 15% to match the second before combining them, under the assumption that the first was affected by clouds or poor guiding.
3. Results
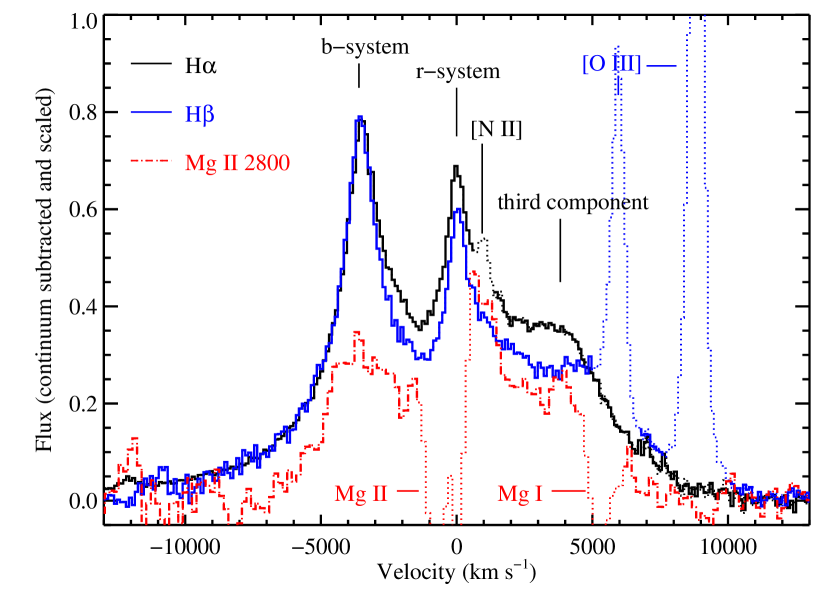
Both of our spectra reveal that SDSS J1536+0441 has unusual broad-line profiles (see Fig. 1), as initially described by BL09. The Balmer lines have a multi-peaked structure, with one peak having the same redshift as the narrow nebular emission lines () and a second one blueshifted by km s-1 relative to the first. We follow BL09 by referring to these as the “r-system” and “b-system,” respectively. However, as we first noted (Chornock et al., 2009), the H line shows a clear third component, visible as a shoulder or hump present at a velocity of 4000 km s-1 relative to the r-system, almost symmetrically opposite in velocity space from the b-system. The third component is also present in the H profile, but it is partially hidden by the superposed [O III] emission line. Although the broad Mg II line is contaminated by superposed narrow Mg I and Mg II absorption lines as well as broad Fe II emission, it too shows a boxy profile with the “corners” of the box at the same velocity as the b-system and the third component.
No features due to starlight in the host galaxy are seen in the spectra, but absorption lines from several common interstellar species (Na I, Ca II, Mg I, and Mg II) are present at a redshift intermediate between the b and r-systems (), as identified by BL09. Our ESI spectrum, which includes only the Na I and Ca II lines, resolves those absorptions (full widths at half maximum 100 km s-1 and 170 km s-1, respectively). Weaker (rest-frame equivalent width 0.16 Å) absorption from Na I D2 is also present at , close to the redshift of the r-system, and is likely due to the host galaxy (D1 at this redshift is blended with D2 of the stronger absorption system). The stronger absorption system is therefore blueshifted by 220 km s-1 relative to the narrow emission lines, possibly analogous to the blueshifted low-ionization ultraviolet (UV) absorber seen in the prototypical double-peaked emitter, Arp 102B (Halpern et al., 1996; Eracleous et al., 2003).
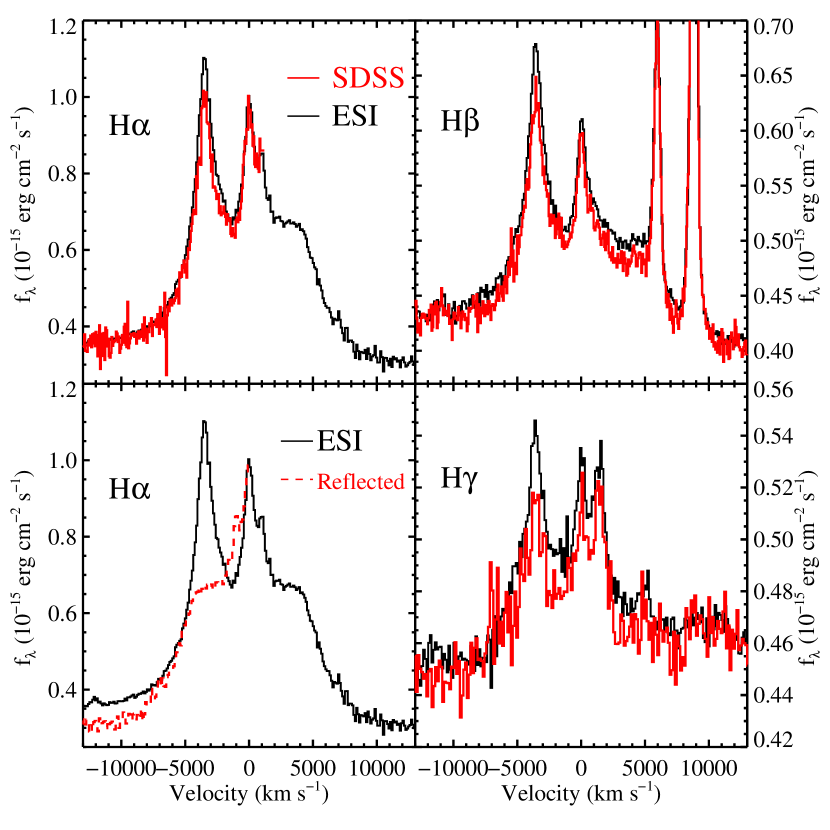
It is of interest to examine the line profiles of SDSS J1536+0441 in more detail, both to investigate potential line-profile variations and velocity shifts of emission components. In Figure 2, we have plotted a comparison of the Balmer-line profiles in the SDSS and ESI spectra. The original SDSS spectrum did not cover the full H profile, explaining why BL09 could not have identified the third component. The spectra are very similar, with the biggest difference being the 10% higher peaks associated with the b-system in the newer spectrum. This increase in the ratio of the peak fluxes of the b-system to the r-system is seen consistently in H, H, and H.
The lower-left panel of Figure 2 also shows a comparison of the blue and red halves of the H profile in our ESI spectrum. There is perhaps some excess flux at high velocities on the blue side relative to the red half of the line, but the overall shape of the wings ( km s-1) is similar on both sides. The big difference between the two halves is the emission peak at km s-1 associated with the b-system, which is at a very similar velocity (but with the opposite sign) as the shoulder on the red side. A potential explanation is that the b-system and the third component represent velocity flows in the broad-line region that are projected onto our line of sight in opposite directions (possibly due to rotation or outflows). The binary black hole interpretation lacks a natural explanation for both the existence of the third component and its presence at an opposite velocity from the b-system.
One explicit prediction of the binary black hole hypothesis made by BL09 is that the system might show noticeable velocity shifts due to the relative orbital motion of the two components of order 100 km s-1 yr-1. Our ESI spectrum was taken 0.95 yr after the SDSS spectrum, so such a velocity shift should be easily measurable. We experimented with several methods to find a robust method of determining line peaks without being sensitive to assumptions about the line profile. We settled on a procedure where we iteratively fit a quadratic function to each line peak and then fit a quadratic to the region of km s-1 around the preliminary peak location. The two spectra were fit in an identical manner. The differences between the peak wavelengths in the SDSS and ESI spectra were then converted to velocity shifts and are listed in Table LABEL:velstab. Gaussian fits to the peaks gave similar results for the shifts.
The two spectra have very consistent wavelength scales, as demonstrated by the 2.8 km s-1 shift between the [O III] lines in the two spectra. Our ESI spectrum has a high signal-to-noise ratio (S/N) and velocity resolution, so the errors are dominated by the S/N of the SDSS spectrum, as demonstrated by the substantially smaller errors in fitting the bright [O III] line. The weighted average values for the velocity change of the b and r-systems (as measured from the H and H lines) are km s-1 yr-1 and km s-1 yr-1, respectively, in the rest frame of the object. We can therefore set a 3 limit on any velocity shift of the underlying emission regions of 70 km s-1 yr-1.
| Line | Velocity Shift (km s-1) |
|---|---|
| [O III] 5007 r-system | -2.8 2.5 |
| H r-system | 13 18 |
| H r-system | 4.8 27 |
| H b-system | 4.8 22 |
| H b-system | -19 15 |
Wrobel & Laor (2009) observed SDSS J1536+0441 with the VLA and discovered a pair of radio sources with 097 separation (named A and B). Decarli et al. (2009a,b) and LB09 found -band and optical sources coincident with both the A and B radio components. One possible interpretation of these results is that the A and B radio sources can be identified with the b and r-systems seen in the optical spectra, making this source a double quasar with a 5 kpc separation. With a fiber size of 3 in diameter, both systems would have naturally fallen within the single spectrum obtained by SDSS. At the time of our ESI observations, we were unaware of the radio results of Wrobel & Laor (2009) and so did not orient the spectrographic slit along the vector separating the A+B radio sources (PA=88). Instead, our slit was aligned with the parallactic angle (Filippenko 1982; PA=48).We also do not know for certain the exact position of the slit on the sky relative to the two components.
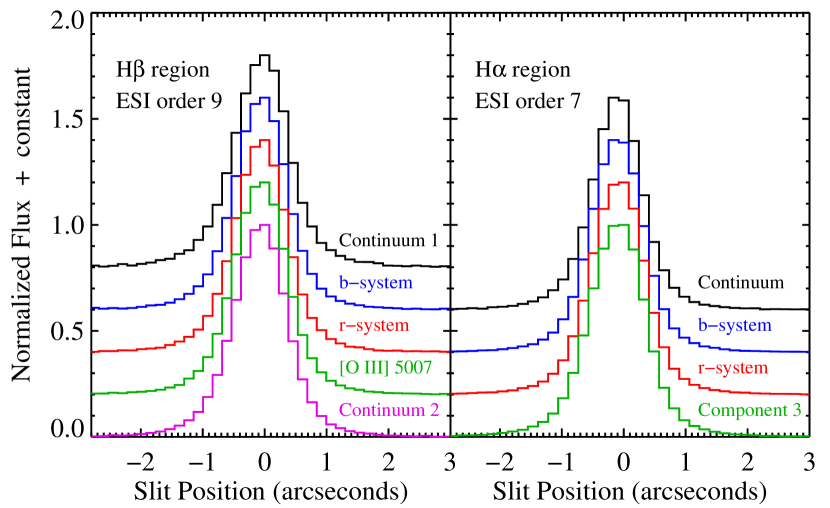
Whether the slit was centered on the bright optical source corresponding to the A source or somewhere between the A and B sources, one would expect an easily measurable spatial offset between the b and r-systems of 07 projected along the spatial direction of the slit if they were associated with the A and B sources. The echelle orders of ESI are highly curved relative to the CCD columns, so we used the trace of our bright standard star to rectify each order. We summed the counts in the 2D CCD frame in several wavelength intervals corresponding to the three velocity components of the broad emission lines, as well as the narrow [O III] line and the surrounding continuum. The results for the ESI orders containing H and H are plotted in Figure 3.
As can be seen from Figure 3, the spatial profiles are almost identical at all wavelengths along the slit. We fit Gaussians to the spatial profiles and found the centroids to be essentially coincident. The maximum and minimum slit positions across the H and H line profiles are equal to better than 0.1 ESI spatial pixel (), which is highly inconsistent with a 07 projected separation. Therefore, we reject the double-quasar hypothesis. LB09 obtained a similar constraint on the basis of observations taken with the slit aligned along a more optimal position angle and also presented photometric evidence that the B source is associated with an early-type galaxy.
4. Discussion
AGNs with double-peaked broad emission lines have been known for many years as a relatively rare subclass of AGNs. Systematic surveys of radio galaxies (Eracleous & Halpern, 1994) and the SDSS quasar sample (Strateva et al., 2003) have found numerous members of the class. The most plausible current explanation for the displaced red and blue peaks for most objects in this class involves rotational motion in a relativistic accretion disk (Chen et al., 1989), possibly with some emission component originating in a wind being driven from the surface of the disk (Murray & Chiang, 1997).
Some double-peaked emitters observed in the past have been proposed to be candidate binary black hole systems (Gaskell, 1983, 1996), much like SDSS J1536+0441. However, that interpretation has been ruled out in well-studied systems such as Arp 102B, 3C 390.3, and 3C 332 by the lack of appropriate long-term velocity evolution of the peaks (Halpern & Filippenko, 1988; Eracleous et al., 1997). BL09 proposed that the observable velocity evolution would be a test of their black hole binary hypothesis. While the observed upper limits (§3; LB09) to the velocity evolution constrain the allowed orbital parameters for a potential binary (explored in detail by LB09), we caution that small velocity shifts of the line peaks may even be expected in the double-peaked emitter scenario. The objects studied by Eracleous et al. (1997) did show significant velocity evolution, but in a manner that was inconsistent with orbital motion. The origin of these variations is still not well understood (Gezari et al., 2007).
The full widths at half maximum and at quarter maximum for H in SDSS J1536+0441 (relative to the maximum flux in the central peak) are 8700 and 11,500 km s-1, respectively. These values are almost identical to the mean values of 8852 and 11,702 km s-1 found by Strateva et al. (2003) for their optically selected double-peaked emitter sample from SDSS, and are significantly larger than those of their reference sample of normal quasars.
The [O III] 5007 flux in the ESI spectrum is within 2% of that in the SDSS spectrum, showing excellent agreement of the absolute flux scales despite the very different aperture sizes (the 5007 emission region appears to be spatially unresolved; Fig. 3). The total continuum-subtracted H flux over the velocity range km s-1 is 1.6 10-13 ergs cm-2 s-1, or ergs s-1 (assuming a flat CDM cosmology with km s-1 Mpc-1; Dunkley et al. 2009). This value is higher than any of the double-peaked emitters from the sample of Strateva et al. (2003), but is exceeded by a few of the radio-selected objects of Eracleous & Halpern (2003), indicative of the extreme nature of SDSS J1536+0441. In addition, the low-ionization narrow emission lines have lower rest-frame equivalent widths (0.7 Å for [O I] 6300) than most double-peaked emitters in the literature (Eracleous & Halpern, 2003; Strateva et al., 2003).
LB09 compared SDSS J1536+0441 with several objects from the literature, identifying three differences between SDSS J1536+0441 and the majority of double-peaked emitters. Two of these differences are the relative strengths and shapes of the central and blue peaks seen in SDSS J1536+0441 compared to the other objects. Double-peaked emitters are rather heterogeneous as a class (Eracleous & Halpern, 1994; Strateva et al., 2003), and we suggest that SDSS J1536+0441 is an extreme example. The third difference noted by LB09 was the lack of change in the intensity of the blue peak over a one-year baseline seen in their Kitt Peak spectrum. However, in our data (Fig. 2) the blue peak has increased in flux by 10% in both H and H.
5. Conclusions
We demonstrated in §3 that the broad emission components of SDSS J1536+0441 were spatially coincident, ruling out the double-quasar hypothesis suggested by Wrobel & Laor (2009) and Decarli et al. (2009a). We believe the preponderance of evidence is in favor of interpreting SDSS J1536+0441 as an unusual double-peaked emitter, not the binary black hole originally suggested by BL09. LB09 have reached similar conclusions about the nature of this system, but do not yet rule out the binary hypothesis. As a phenomenological matter, SDSS J1536+0441 clearly shows multi-peaked emission-line profiles like other members of the class of double-peaked emitters. We cannot conclusively disprove the binary black hole hypothesis, but feel that there is no compelling reason to adopt a binary interpretation when SDSS J1536+0441 shows characteristics of a previously known class of objects probably unrelated to binaries.
SDSS J1536+0441 certainly exhibits a few extreme properties for a double-peaked emitter. The optical luminosity is very high, as is the ratio of the blue to red peaks. Tang & Grindlay (2009) modeled the Balmer line profiles in the Keck data presented here and found that a standard disk model could reproduce the third component and a shelf of emission under the peak associated with the b-system. However, their disk models alone could not reproduce the sharp blue peak, so another component was required, which they proposed was due to a broad-line region around a secondary black hole in the accretion disk. We note that a significant fraction of the other known double-peaked emitters are also not well fit in detail by simple disk models, either, possibly indicating the presence of an additional emission component or non-axisymmetric disks (Eracleous & Halpern, 2003; Strateva et al., 2003).
Instead of waiting for several years to further refine the constraints on the lack of orbital motion in the system as suggested by LB09, we note that there is potentially a simple test that can be done more quickly. Now that HST has been refurbished, it will be possible to obtain UV spectroscopy. UV observations of other double-peaked emitters have shown that the emission lines from high-ionization material (e.g., Ly and C IV) frequently lack double-peaked velocity profiles (Halpern et al., 1996; Eracleous et al., 2004). This striking difference between the profiles of different lines has been attributed to density and radiative-transfer effects in the multiple line-emitting regions (e.g., the accretion disk and associated wind). The absence of multiple velocity peaks in the UV emission lines would be strong evidence in favor of SDSS J1536+0441 being a member of the class of double-peaked emitters; the presence of multiple peaks, however, would still render the interpretation ambiguous. UV spectra may also clarify the nature of the strong blueshifted absorption system.
The high spatial resolution of HST spectra could also be used to obtain separate spectra of both the A and B sources to conclusively establish the origin of the three components. Likewise, spatially resolved spectra of the Paschen lines in the infrared (using adaptive optics from the ground, for instance) should be fruitful. In either case, we expect such observations to reveal that either A or B (but not both) would be associated with the broad emission-line profiles.
References
- Abazajian et al. (2009) Abazajian, K. N., et al. 2009, ApJS, 182, 543
- Begelman et al. (1980) Begelman, M. C., Blandford, R. D., & Rees, M. J. 1980, Nature, 287, 307
- Boroson & Lauer (2009a) Boroson, T. A., & Lauer, T. R. 2009, Nature, 458, 53 (BL09)
- Chen et al. (1989) Chen, K., Halpern, J. P., & Filippenko, A. V. 1989, ApJ, 339, 742
- Chornock et al. (2009) Chornock, R., et al. 2009, The Astronomer’s Telegram, 1955, 1
- Decarli et al. (2009b) Decarli, R., Dotti, M., Falomo, R., Treves, A., Colpi, M., Kotilainen, J. K., Montuori, C., & Uslenghi, M. 2009b, ApJ, 703, L76
- Decarli et al. (2009a) Decarli, R., Treves, A., Falomo, R., Dotti, M., Colpi, M., & Kotilainen, J. K. 2009a, IAU Circ., 9047, 2
- Dunkley et al. (2009) Dunkley, J., et al. 2009, ApJS, 180, 306
- Eracleous & Halpern (1994) Eracleous, M., & Halpern, J. P. 1994, ApJS, 90, 1
- Eracleous & Halpern (2003) Eracleous, M., & Halpern, J. P. 2003, ApJ, 599, 886
- Eracleous et al. (2003) Eracleous, M., Halpern, J. P., & Charlton, J. C. 2003, ApJ, 582, 633
- Eracleous et al. (1997) Eracleous, M., Halpern, J. P., Gilbert, A. M., Newman, J. A., & Filippenko, A. V. 1997, ApJ, 490, 216
- Eracleous et al. (2004) Eracleous, M., Halpern, J. P., Storchi-Bergmann, T., Filippenko, A. V., Wilson, A. S., & Livio, M. 2004, in The Interplay Among Black Holes, Stars and ISM in Galactic Nuclei, ed. T. Storchi-Bergmann, L. C. Ho, & H. R. Schmitt (Cambridge: Cambridge Univ. Press), 29
- Filippenko (1982) Filippenko, A. V. 1982, PASP, 94, 715
- Gaskell (1983) Gaskell, C. M. 1983, in Liege International Astrophysical Colloquia, Vol. 24, ed. J.-P. Swings (Cointe-Ougree, Belgium: Universite de Liege), 473
- Gaskell (1996) Gaskell, C. M. 1996, ApJ, 464, L107
- Gaskell (2009) Gaskell, C. M. 2009, ArXiv e-prints, arXiv:0903.4447
- Gezari et al. (2007) Gezari, S., Halpern, J. P., & Eracleous, M. 2007, ApJS, 169, 167
- Halpern et al. (1996) Halpern, J. P., Eracleous, M., Filippenko, A. V., & Chen, K. 1996, ApJ, 464, 704
- Halpern & Filippenko (1988) Halpern, J. P., & Filippenko, A. V. 1988, Nature, 331, 46
- Lauer & Boroson (2009) Lauer, T. R., & Boroson, T. A. 2009, ApJ, 703, 930 (LB09)
- Milosavljevic & Merritt (2003) Milosavljevic, M., & Merritt, D. 2003, in The Astrophysics of Gravitational Wave Sources, ed. J. M. Centrella, (New York: AIP, Vol. 686), 201
- Murray & Chiang (1997) Murray, N., & Chiang, J. 1997, ApJ, 474, 91
- Oke & Gunn (1982) Oke, J. B., & Gunn, J. E. 1982, PASP, 94, 586
- Sheinis et al. (2002) Sheinis, A. I., Bolte, M., Epps, H. W., Kibrick, R. I., Miller, J. S., Radovan, M. V., Bigelow, B. C., & Sutin, B. M. 2002, PASP, 114, 851
- Strateva et al. (2003) Strateva, I. V., et al. 2003, AJ, 126, 1720
- Tang & Grindlay (2009) Tang, S., & Grindlay, J. 2009, ApJ, 704, 1189
- Wrobel & Laor (2009) Wrobel, J. M., & Laor, A. 2009, ApJ, 699, L22