Laboratory evidence for the non-detection of excited nascent H2 in dark clouds
Abstract
There has always been a great deal of interest in the formation of H2 as well as in the binding energy released upon its formation on the surface of dust grains. The present work aims at collecting experimental evidence for how the bond energy budget of H2 is distributed between the reaction site and the internal energy of the molecule. So far, the non-detection of excited nascent H2 in dense quiescent clouds could be a sign that either predictions of emission line intensities are not correct or the de-excitation of the newly formed molecules proceeds rapidly on the grain surface itself. In this letter we present experimental evidence that interstellar molecular hydrogen is formed and then rapidly de-excited on the surface of porous water ice mantles. In addition, although we detect ro-vibrationally excited nascent molecules desorbing from a bare non-porous (compact) water ice film, we demonstrate that the amount of excited nascent hydrogen molecules is significantly reduced no matter the morphology of the water ice substrate at 10 K (both on non-porous and on porous water ice) in a regime of high molecular coverage as is the case in dark molecular clouds.
keywords:
ISM: clouds – ISM: molecules – dust, extinction – methods: laboratory.1 Introduction
The formation of molecular hydrogen (H2) in the interstellar medium (ISM) is considered one of the most important chemical reactions occurring in space. H2 is ubiquitous, it is by far the most abundant molecular species in the Universe and is a major contributor to the cooling of astrophysical media. In addition, this simple molecule is also responsible for initiating the interstellar chemistry leading to the large and various inventory of molecules that have been observed so far (Dalgarno 2000).
Since gas phase routes for the conversion of hydrogen atoms to molecules are too inefficient to account for the high abundances that are observed, it has been long assumed (Gould & Salpeter 1963), and now confirmed by many laboratory experiments (e.g., Vidali et al. 2006, and references therein), that molecular hydrogen is formed efficiently in surface reactions on cosmic dust grains. The two main mechanisms invoked for surface catalysis are: the Langmuir-Hinshelwood (L-H) mechanism, in which H2 forms in a H-atom diffusion process, and the Eley-Rideal (E-R) mechanism, or ‘prompt’ mechanism, in which an impinging H-atom reacts directly with an adsorbed H-atom (Duley 1996).
Of major concern for this work, is the 4.48 eV released upon formation of the H2 molecule on grain surfaces and how the binding energy is distributed between the reaction site and the translational and internal energy in the molecule. Several theoretical and experimental works have been carried out on this subject. To cite just a few examples, the formation of H2 via the E-R process on graphite surfaces at 10 K was studied with purely quantum mechanical calculations (Farebrother et al. 2000; Meijer et al. 2001; Morisset et al. 2004a), semi-classical quantum molecular dynamics (Rutigliano 2001) and classical and quasi-classical trajectory calculations (Parneix & Brechignac 1998). These studies generally find the product H2 in significantly excited v–J states. Quantum dynamics of the L-H mechanism on graphite was studied by Morisset et al. (2004b, 2005). They predict even greater vibrational energy of the nascent molecule. A very recent computational study by Goumans et al. (2009) on an olivine surface seems to suggest, however, that nascent H2 formed from chemisorbed H-atoms is considerably less ro-vibrationally excited than when it is formed on graphite. As to the case of interest here, hydrogen formation on water ice, Takahashi et al. (1999) made a detailed calculation of H2 formation on amorphous ice using a classical description in a molecular dynamics formulation. They found most of the recombination energy distributed in vibration (70 to 80%) of the product H2 while only 5% of the H-H bond energy was deposited in the ice substrate.
Experiments performed on non-porous surfaces show that molecular hydrogen is formed in a ro-vibrational excited state both on graphite (Latimer et al. 2008) and on amorphous solid water ice (Amiaud et al. 2007). As for the formation of H2 on porous substrates, Roser et al. (2003) and Hornekær et al. (2003) found that newly formed HD molecules desorb from a porous water ice film with a kinetic energy that shows previous thermalization with the substrate. However, their experiments do not provide any information on the internal excitation of the molecules upon formation.
In principle it is possible to observe newly formed molecular hydrogen directly in the interstellar medium. The formation excitation of ro-vibrational states will be followed by spontaneous radiative transitions to lower energy levels hence infrared emission from newly formed H2 in dark cores should be detectable (Duley & Williams 1993). Observations of Barnard 68 (or Lynds Dark Nebula LDN 57) have been made as part of the programme ref 66.C-0526(A) in March 2001 at ESO-VLT using the ISAAC instrument in spectroscopic mode by Lemaire & Field (private communication). No detection of H2 emission has been observed looking at the core of the object in K band, despite a 5-hour integration in nodding mode to subtract the telluric lines. The position of the slit on the object was chosen on the core and off object including, in the latter case, a few faint stars in or on the side of the spectrograph slit. Then only the continuum for these non-listed stars has been detected. This lack of detection has been reported later on by Tiné et al. (2003) on two others dark nebulae, L1498 and L1512, using the CGS4 spectrometer at UKIRT and observing in the H band. Using the calculations by Farebrother et al. (2000) and Meijer et al. (2001), Tiné et al. (2003) predicted an observational spectrum arising from newly formed excited H2. According to their model, there should be a clear spectral signature of H2 formation excitation in both diffuse and (particularly) dark clouds. They then went on to observe two dark clouds to verify their predictions. H2 emission was not detected at the 3 level. The authors provide several reasons for this non-detection. Possibly one of the most important reasons is that the predicted spectrum is based on dust grain surfaces composed of pure graphite. In the case of the L1498 and L1512 it is known that molecular species such as CO, CS, H2CO and CCS have been depleted from the gas phase and reside on the surface of the grains (e.g., Shirley et al. 2005, and references therein). It is therefore very likely that grains are covered in molecular ices. The dust temperature is estimated to be K in both clouds. The other main assumption is that the formation of H2 proceeds through the E-R mechanism although it is likelier that the formation proceeds through the L-H mechanism (e.g., Creighan et al. 2006).
This letter is intended to provide another strong argument to explain the non-detection of excited product H2 in dark clouds.
2 Experimental Methods
The experimental technique and apparatus have been described elsewhere (Amiaud et al. 2006) and are only summarized here. The experiments take place under ultra-high vacuum (UHV) conditions (base pressure mbar) in a stainless steel chamber. This experiment directs a D-atom beam collimated through a triply differentially pumped beam-line to a target located in the vacuum chamber. The target consists of a polished circular (1 cm in diameter) copper surface attached to the cold finger of a closed-cycle He cryostat and can be cooled to a lower limit of 8 K. The temperature is measured by a calibrated silicon diode clamped on the back of the target. D-atoms generated by microwave dissociation of D2 are piped through a PTFE tubing to an aluminium nozzle in the first stage of the beam-line. A typical dissociation efficiency in this experiment was 60% and the resulting D-atoms were thermalized to approximately 300 K via collisions with the walls of the PTFE tube. Amorphous solid water (ASW) ice samples were grown in situ by exposing the cold Cu surface to pure water vapor by back-filling the chamber. Non-porous (compact) ASW (np-ASW) ices were prepared at a surface temperature of 120 K while porous ASW (p-ASW) samples were prepared with the surface held at 10 K. The preparation and characterization methods are the same as employed in a recent work by our group (Fillion et al. 2009).
A quadrupole mass spectrometer (QMS) is employed for the detection of the products entering the vacuum chamber or coming off the sample in real-time mode during the irradiation phase. Due to the configuration of our apparatus, the QMS was placed 5 cm above the surface to allow for direct D-irradiation of the ASW ice sample. The QMS is also used to detect D2 molecules in a vibrationally excited state by tuning the ionizing electron energy inside the QMS head as follows. The QMS detection is preceded by ionization of the molecules that are then selected by their m/e ratio and finally detected as ion counts. The ionization threshold for the lower level of D2 is 15.46 eV and the ionizing electron energy is normally set to 30 eV. As the energy requirement for ionization decreases for the vibrationally excited molecule, setting the electron energy to a value lower than 15.46 eV allows to detect solely internally excited molecules. In the present experiment, the detection of excited D2 was performed with the ionizing electron energy set to 15.2 eV, which would allow us to detect molecules in a vibrationally excited state . Previous experiments carried out using this technique proved effective for the detection of excited D2 up to (Amiaud et al. 2007). Newly formed molecules are not detected directly as they leave the ASW sample but as background molecules that have collided at least once with the walls of the vacuum chamber. However, it can be fairly assumed that this configuration has the only disadvantage of reducing the number of detectable excited molecules but that no qualitative effect occurs.
Nascent excited D2 molecules were studied by D-atom irradiation of a 100-monolayer (1 ML molecules cm-2) np-ASW ice and D-atom irradiation of a 10 ML p-ASW ice film grown on a substrate of np-ASW. In both cases the substrate temperature was held at 10 K.
3 Results
3.1 D irradiation of non-porous ASW
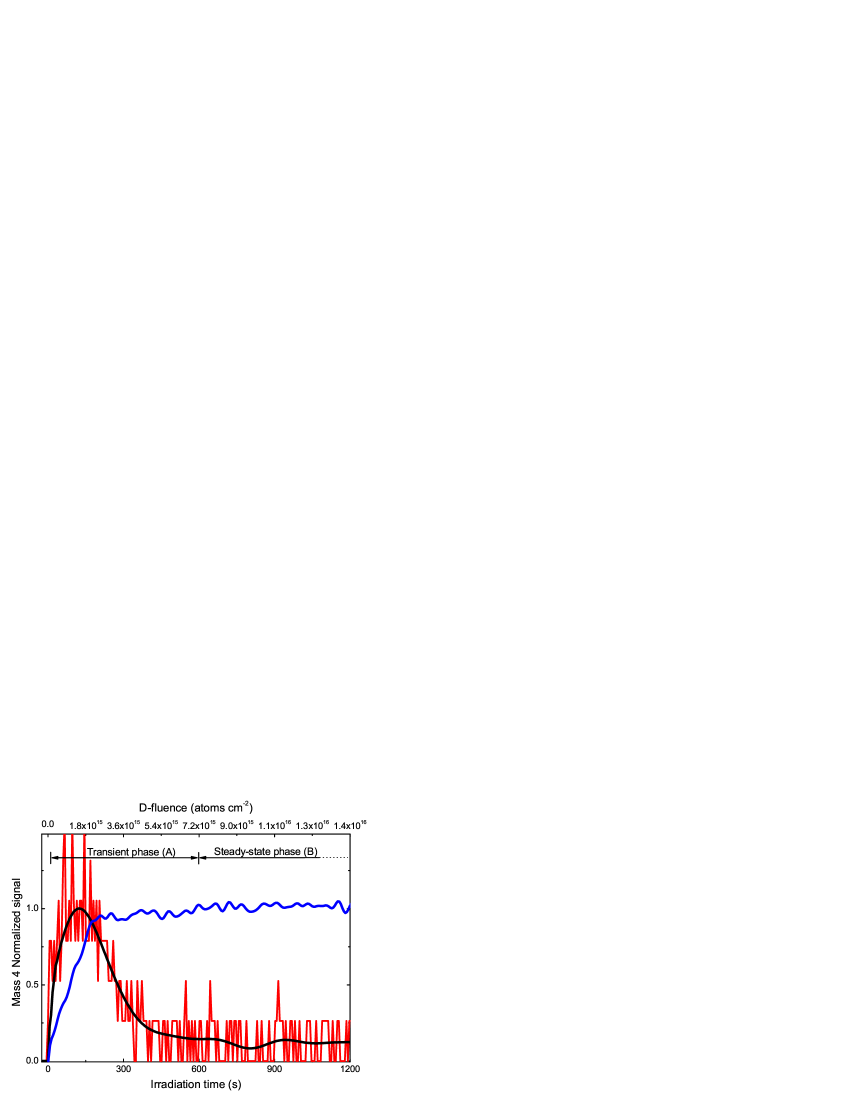
Fig. 1 shows a comparison between the two curves obtained by monitoring the total amount of D2 molecules and only the excited-D2 signal (two separate experiments) during a 1-hour exposure of D-atoms to the np-ASW ice substrate. The blue trace represents the signal from all D2 molecules, whether in an excited state or not. As discussed in detail in Amiaud et al. (2007), the roughly linear increase of the total-D2 signal during the first 200 s of D-irradiation indicates an enhancement of D2 formation. Because of the augmented number of molecules on the surface, deposited by the non-dissociated fraction of the impinging D beam, the D-atom sticking probability increases (Govers et al. 1980). In the early stage of the D-atom irradiation, when the surface coverage is still low, the hallmark of the ongoing molecular formation – besides the increase of the total-D2 signal – is the simultaneous increase of the number of excited nascent D2 molecules detected (red trace in Fig. 1). In such a coverage regime we assume that the excited-D2 yield is proportional to the total number of nascent molecules. This also agrees with the results obtained on another non-porous substrate (highly orientated pyrolitic graphite) by Creighan et al. (2006) at a surface temperature of 15 K. As the number of adsorbed molecules on the np-ASW substrate approaches the saturation coverage of molecules cm-2 (Amiaud et al. 2007), the total-D2 trace becomes less steep (i.e., decrease of the recombination rate) until it reaches a plateau value after s. A steady-state regime between formed/deposited and desorbed D2 molecules is now established and the recombination rate remains constant. Concurrently with the probable decrease of the recombination probability we also observe a drop in the excited-D2 yield after it peaks at s and reaches rapidly ( s) a steady low-count signal that is about of the maximum value. Together with a reduced recombination probability with the onset of the saturation coverage, the decrease of the excited-D2 signal suggests that newly formed D2 molecules may also undergo a thermalization with the surface via an efficient energy transfer due to the enhanced number of molecules on the surface. The low-count plateau value of ro-vibrationally excited D2 molecules is however not to be seen as a mere instrumental noise, but as a real and measurable signal. In fact, much attention has been paid to verifying that we do not observe excited D2 molecules when the ASW ice substrate is exposed to a beam of molecules (i.e., no D2 formation in progress) nor when D-atoms are exposed to a surface at a higher temperature (i.e., residence time of atoms on the surface becomes too short for recombination to be efficient).
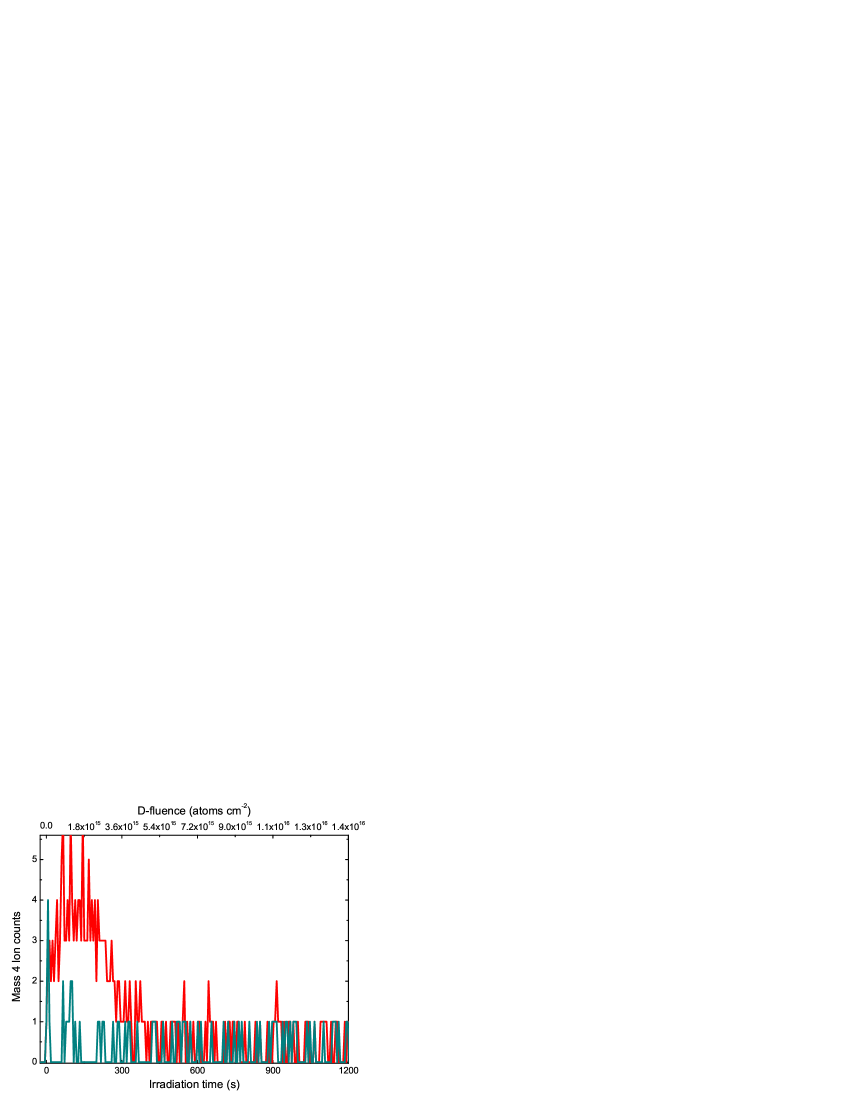
In order to prove the decisive role of already adsorbed molecules in a regime of saturation coverage and at what extent they determine the drop-off in the amount of excited nascent D2 molecules, we repeated the D exposure of the np-ASW substrate after dosing the surface with D2 molecules. To saturate the surface, we irradiated the non-porous ice substrate to a 20-minute D2 exposure (corresponding dose of exposed ML). However, it should be noted that when the saturation at 10 K is achieved, only a fraction () of the non-porous water ice surface is covered with molecules. This is due to a reduced sticking coefficient of D2 molecules and a reduced binding energy. Fig. 2 displays a comparison between the excited-D2 yields vs D-irradiation time of a bare np-ASW surface (red trace, case discussed above) and of a np-ASW surface pre-dosed with molecules (dark cyan trace). This figure clearly shows that the excited-D2 yield in the case of a surface with D2 pre-adsorbed on the np-ASW film is much lower and a low-count plateau is attained rapidly after the D-irradiation begins.
3.2 D irradiation of porous ASW
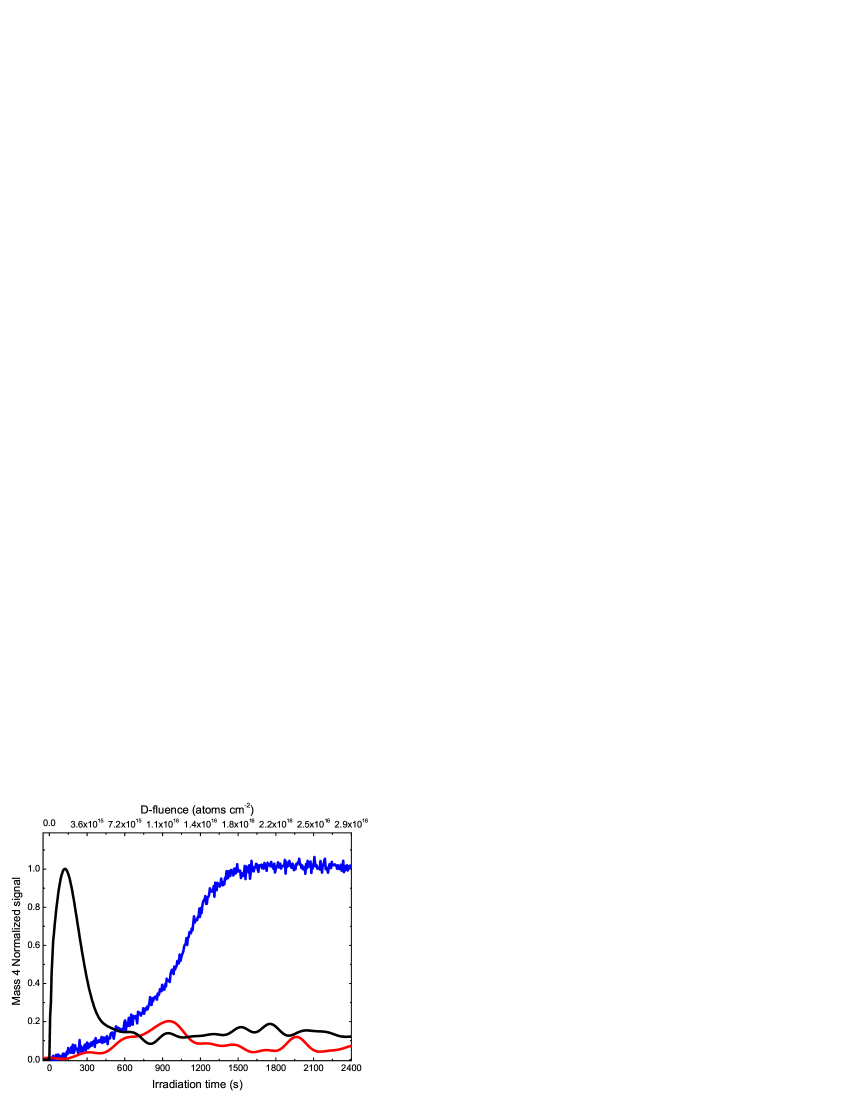
In Fig. 3 we show the results obtained during D irradiation of a 10 ML p-ASW ice film held at 10 K. The blue trace represents the normalized total-D2 yield vs D exposure time. Since the effective surface area of the porous substrate is considerably larger than that of the non-porous substrate, we observe a slower completion of the saturation coverage (compare with blue curve in Fig. 1). As we have seen in the case of the np-ASW substrate, the excited-D2 signal (red line) is likewise proportional to the total yield of D2 molecules until a maximum is reached after around 1000 s of D-atom irradiation, concurrent with a fast rise of the molecular formation efficiency (slope of the total-D2 yield). This is in agreement with the assumption made earlier that, in a regime of low coverage, the number of excited-D2 molecules is proportional to the total number of nascent molecules. However, the peak detected in the case of p-ASW is so small that it barely stands out from the excited-D2 low-count plateau value that is attained right after the maximum (at s). To emphasize the big difference between the amount of ro-vibrationally excited molecules detected in the two types of water ice substrates investigated (np- vs p-ASW), the excited-D2 yield curve of the porous substrate case (red curve) and the excited-D2 yield curve of the non-porous surface case (black curve) are both shown in Fig. 3. To facilitate a direct comparison, the red curve (porous case) was scaled by the same factor used for normalizing the black curve (non-porous case, Fig. 1). From this comparison, it is clear that the excited-D2 yield is considerably reduced in the case of the p-ASW substrate. This result implies that the excited nascent molecules readily thermalize with the substrate as they form in the pores of the p-ASW film.
4 Discussion
4.1 De-excitation mechanisms on the surface
In order to make assumptions as to what kind of mechanism causes the drop in the excited-D2 yield at saturation coverage at 10 K, it is worth discussing in more detail what happens when the sample of np-ASW is exposed to D-atoms (Fig. 1). We can define two main phases during the irradiation of the ASW ice surface; (A) a transient phase comprised between D irradiation at and the beginning of the saturation coverage ( s), and (B) a steady-state regime that is established at the saturation coverage and that goes on as long as the D irradiation is running. In the first part of the transient phase (A), after the irradiation begins at , few atoms are expected to stick although those that are adsorbed on the D2-free surface can occupy the deeper binding sites. This results in a long residence time that, in turn, favours recombination. As the irradiation goes on, the change in surface coverage affects greatly the recombination efficiency (Schutte et al. 1976; Govers 2005). Molecules gradually fill up the surface and the binding energy of adsorbed atoms decreases gradually as the molecules saturate the stronger binding sites (Hixson et al. 1992). Yet, this effect is compensated for by the increase of the sticking probability of D-atoms. The excited-D2 peak in Fig. 1 indicates a high recombination probability resulting from an optimum equilibrium between the increase of the sticking efficiency and the shortening of the residence time of D-atoms on the surface. The surface coverage at this stage is molecules cm-2. As pointed out by Govers (2005), around this molecular coverage range we observe an abrupt change in the binding energy of atoms, in that it begins to decrease as the surface coverage grows further. As a result, the excited-D2 signal begins to drop rapidly as more molecules are deposited on the surface and this may reflect, at least in part, a decrease of the recombination efficiency. On the other hand, a large number of D2 are still likely to be formed in an excited state but promptly release their internal energy on the surface via an efficient energy transfer that involves the favourable mass ratio (1-to-1) between newly formed molecules and the molecules adsorbed in the vicinity (Schutte et al. 1976). The already-adsorbed molecules can in turn use this energy to desorb in a low- or non-excited state via a non-thermal desorption process. At the onset of the steady-state phase (B), the excited-D2 yield has already attained a low-count plateau and stays as such in a regime of saturation of the surface, that is to say under conditions close to those of the dense regions of the ISM (cf. § 4.2) and of concern to us.
In the case of p-ASW, Hornekær et al. (2003) measured the kinetic energy of HD molecules formed on the surface and found that they fully thermalize with the porous surface before desorbing. In this work we show that also the internal energy of newly formed D2 molecules that rapidly desorb is deposited almost completely in the porous ice. In fact, hydrogen atoms are mobile at 10 K and penetrate the porous structure (Matar et al. 2008), thus nascent molecules are re-captured several times within the pores. This explains why we do not observe significant internal or kinetic energy in the desorbing molecules.
Unfortunately, we are not able to give an estimate of the fraction of the bond energy deposited in the np-ASW ice substrate. Yet, qualitative indications are that it is greater than what predicted by Takahashi et al. (1999) (5% of the entire formation energy) but comparable to a value between 40% and 60% found by Creighan et al. (2006) and Yabushita et al. (2008). This is consistent with the findings by Schutte et al. (1976) and with preliminary results obtained recently by our group in an experiment studying the effects of non-thermal desorption induced by hydrogen recombination that will be published in a forthcoming paper.
4.2 Astrophysical implications
Our experiments demonstrate unequivocally that two conditions contribute to the prompt de-excitation of nascent hydrogen molecules formed on the surface of amorphous water ice. In the first experiment, carried out on np-ASW, nascent D2 molecules are promptly de-excited as the surface coverage reaches the saturation value at 10 K. In the experiment performed on p-ASW, we found that the excited-D2 yield was always low and basically independent of the surface coverage, indicating that the roughness of the surface contributes efficiently to the relaxation of newly formed molecules at the surface. These results are relevant to the formation of molecular hydrogen in the ISM and provide a plausible explanation as to why excited nascent H2 is very difficult to observe in quiescent dark clouds.
We can actually assess if, under interstellar conditions of interest here, surface coverage and surface morphology are comparable to those simulated in our experiments. To estimate the surface coverage on interstellar dust grain we have to verify that the lifetime of a molecule on the surface is comparable to the time interval between the arrival of two molecules on a single dust grain surface; i.e., that the arrival rate balances the evaporation rate. Let us consider the time interval between the impacts of two molecules on the surface of a dust grain. Typical conditions of the dense quiescent medium are K, density cm-3, and for our calculation we can approximate the dust grains to spheres with average radius m. Then we have
is the mean velocity of the molecules and is the grain surface accessible to the molecules in the gas phase. Under dense cloud conditions turns out to be of hours. The residence time is expressed as . is the vibration frequency of a molecule on the surface and represents the number of attempts per second to evaporate ( s-1). is the adsorption energy in units of Kelvin and is the surface temperature. The surface temperature in our case is 10 K so the residence time of H2 molecules on the grain surface depends critically on the adsorption energy. Amiaud et al. (2007) derived the distribution of from D2 TPD spectra in a saturation regime on np-ASW at 10 K. They found that ranges from about 400 to 700 K (33 to 59 meV) and estimated the saturation coverage to be molecules cm-2. Putting K in the expression of (corresponding value for the lesser bound molecules) we find a residence time of hours, and thus . By scaling to a lower value suitable for H2, presumably comprised between 360 and 650 K (Vidali et al. 1991), we find a minimum value for of around 10 minutes which does not impair the validity of our conclusion as the fraction of weakly bound H2 ( K) does not account for more than a few percent of the total surface population (e.g., Hixson et al. 1992).
The surface molecular coverage on interstellar dust grains in dark clouds can then be estimated to be in the range molecules cm-2, a value consistent with previous estimates by Govers et al. (1980) and Buch & Devlin (1994) and comparable to the surface coverage we attain in our experiments. In addition, since dust grains residing in dark clouds are covered by icy mantles of many monolayers dominated by water ice, as in the present work, our results are relevant to the excited newly formed H2 molecules in dark clouds. If we assume a non-porous ice substrate covering cosmic dust grains, we have shown that the fraction of newly formed excited H2 molecules is considerably reduced in the gas phase. Should the surface of dust grains in dark clouds be covered with a porous water ice mantle, the binding energy of the H-H reaction is released on the surface even more efficiently owing to the pores that trap the molecules long enough so that they de-excite inside the pores before leaving the grain.
In dark clouds both ‘quenching mechanisms’ are at play on the surface of dust grains, namely, a high molecular coverage is present on the icy mantles and a surface morphology that is probably an open porous structure. Our results are even more remarkable if we consider that the experiments were performed on a 10 ML p-ASW ice substrate whereas icy deposits of 100 monolayers are typically associated with dense cloud mantles. In the light of our results, the observational predictions made by Tiné et al. (2003) for the H2 ro-vibrational emission line intensities should be revised and the non-detection occurred in the searches by observing dark and quiescent cores is now explained. Furthermore, the important role played by the high molecular coverage in the decrease of the observable internally excited H2 leads us to suggest that these results are relevant not only to water ice substrates, but also to other types of substrates whenever H2 becomes far more abundant than H on the grain surface.
These experiments, performed under conditions close to those encountered in dark clouds, demonstrate that the excess energy from hydrogen formation distributed over vibrational states flows almost completely into the grain surface and very little, if any, H2 ro-vibrational emission becomes detectable.
Acknowledgments
We acknowledge the support of the national PCMI programme founded by the CNRS, the Conseil Regional d’Ile de France through SESAME programmes (contract I-07-597R), the Conseil Général du Val d’Oise and the Agence Nationale de Recherche (contract ANR 07-BLAN-0129). EC in particular thanks the ANR for a post-doctoral grant.
References
- Amiaud et al. (2007) Amiaud L., Dulieu F., Fillion J.-H., Momeni A., Lemaire J. L., 2007, J. Chem. Phys., 127, 144709
- Amiaud et al. (2006) Amiaud L., Fillion J. H., Baouche S., Dulieu F., Momeni A., Lemaire J. L., 2006, J. Chem. Phys., 124, 094702
- Buch & Devlin (1994) Buch V., Devlin J. P., 1994, ApJ, 431, L135
- Creighan et al. (2006) Creighan S. C., Perry J. S. A., Price S. D., 2006, J. Chem. Phys., 124, 114701
- Dalgarno (2000) Dalgarno A., 2000, in Combes F., Pineau des Forêts G., eds, Molecular hydrogen in space, Cambridge University Press p. 3
- Duley (1996) Duley W. W., 1996, MNRAS, 279, 591
- Duley & Williams (1993) Duley W. W., Williams D. A., 1993, MNRAS, 260, 37
- Farebrother et al. (2000) Farebrother A. J., Meijer A. J. H. M., Clary D. C., Fisher A. J., 2000, Chem. Phys. Lett., 319, 303
- Fillion et al. (2009) Fillion J.-H., Amiaud L., Congiu E., Dulieu F., Momeni A., Lemaire J. L., 2009, PCCP 11, 4396
- Gould & Salpeter (1963) Gould R. J., Salpeter E. E., 1963, ApJ, 138, 393
- Goumans et al. (2009) Goumans T. P. M., Richard C., Catlow A., Brown W. A., 2009, MNRAS, 393, 1403
- Govers (2005) Govers T., 2005, eprint arXiv:physics/0502101
- Govers et al. (1980) Govers T. R., Mattera L., Scoles G., 1980, J. Chem. Phys., 72, 5446
- Hixson et al. (1992) Hixson H. G., Wojcik M. J., Devlin M. S., Devlin J. P., Buch V., 1992, J. Chem. Phys., 97, 753
- Hornekær et al. (2003) Hornekær L., Baurichter A., Petrunin V. V., Field D., Luntz A. C., 2003, Science, 302, 1943
- Latimer et al. (2008) Latimer E. R., Islam F., Price S. D., 2008, Chem. Phys. Lett., 455, 174
- Matar et al. (2008) Matar E., Congiu E., Dulieu F., Momeni A., Lemaire J. L., 2008, A&A, 492, L17
- Meijer et al. (2001) Meijer A. J. H. M., Farebrother A. J., Clary D. C., Fisher A. J., 2001, J. Phys. Chem. A, 105, 2173
- Morisset et al. (2004a) Morisset S., Aguillon F., Sizun M., Sidis V., 2004a, J. Chem. Phys., 121, 6493
- Morisset et al. (2004b) Morisset S., Aguillon F., Sizun M., Sidis V., 2004b, J. Phys. Chem. A, 108, 8571
- Morisset et al. (2005) Morisset S., Aguillon F., Sizun M., Sidis V., 2005, J. Chem. Phys., 122, 194702
- Parneix & Brechignac (1998) Parneix P., Brechignac P., 1998, A&A, 334, 363
- Roser et al. (2003) Roser J. E., Swords S., Vidali G., Manicò G., Pirronello V., 2003, ApJ, 596, L55
- Rutigliano (2001) Rutigliano M., 2001, Chem. Phys. Lett., 340, 13
- Schutte et al. (1976) Schutte A., Bassi D., Tommasini F., Turelli A., Scoles G., Herman L. G. F., 1976, J. Chem. Phys., 64, 4135
- Shirley et al. (2005) Shirley Y. L., Nordhaus M. K., Grcevich J. M., Evans II N. J., Rawlings J. M. C., Tatematsu K., 2005, ApJ, 632, 982
- Takahashi et al. (1999) Takahashi J., Masuda K., Nagaoka M., 1999, MNRAS, 306, 22
- Tiné et al. (2003) Tiné S., Williams D. A., Clary D. C., Farebrother A. J., Fisher A. J., Meijer A. J. H. M., Rawlings J. M. C., Davis C. J., 2003, AP&SS, 288, 377
- Vidali et al. (1991) Vidali G., Ihm G., Kim H. Y., Cole M. W., 1991, Surface Science Reports, 12, 133
- Vidali et al. (2006) Vidali G., Roser J. E., Li L., Congiu E., Manicò G., Pirronello V., 2006, Faraday Discuss., 133, 125
- Yabushita et al. (2008) Yabushita A., Hama T., Iida D., Kawanaka N., Kawasaki M., Watanabe N., Ashfold M. N. R., Loock H. P., 2008, ApJ, 682, L69
The definitive version will be available at www.blackwell-synergy.com