Toward Understanding The B[e] Phenomenon:
III. Properties of the optical counterpart
of IRAS 00470+6429.11affiliation: Partially based on data obtained at the 6–m BTA
telescope of the Russian Academy of Sciences, 3–m IRTF, 3–m Shane
telescope of the Lick Observatory, 2.7–m Harlan J. Smith and 2.1–m
Otto Struve telescopes of the McDonald Observatory, 2.1–m telescope
of the San Pedro Martir Observatory, 1.5–m telescope of the Loiano
Observatory, and 0.8–m telescope of the Dark Sky Observatory
Abstract
FS CMa type stars are a group of Galactic objects with the B[e] phenomenon. They exhibit strong emission-line spectra and infrared excesses, which are most likely due to recently formed circumstellar dust. The group content and identification criteria were described in the first two papers of the series. In this paper we report our spectroscopic and photometric observations of the optical counterpart of IRAS 00470+6429 obtained in 2003–2008. The optical spectrum is dominated by emission lines, most of which have P Cyg type profiles. We detected significant brightness variations, which may include a regular component, and variable spectral line profiles in both shape and position. The presence of a weak Li I 6708 Å line in the spectrum suggests that the object is most likely a binary system with a B2–B3 spectral type primary companion of a luminosity L/L = 3.90.3 and a late-type secondary companion. We estimate a distance toward the object to be 2.00.3 kpc from the Sun.
1 Introduction
The B[e] phenomenon refers to the simultaneous presence of forbidden lines and a strong near-infrared (IR) excess in the spectra of hot stars (typically late-O to early-A type, Allen & Swings, 1976). The group of FS CMa type stars consists of 40 Galactic objects with the B[e] phenomenon that exhibit very strong emission-line spectra and a steep decrease of the IR flux at m (Miroshnichenko, 2007). Until recently, the nature and evolutionary state of the majority of these objects were considered controversial. Their luminosity range (2.5 L/L4.5) indicates that the stars are not very massive, while the location on the Hertzsprung-Russell diagram (typically within the main sequence) suggests that they are not extremely evolved. The shape of the IR spectral energy distribution (SED) in combination with a lack of a visible nebulosity suggest that circumstellar (CS) dust is compactly distributed around the source of radiation. It has probably been formed recently or is being formed now.
Furthermore, the very strong emission-line spectra of FS CMa type objects are not expected from single stars, because theory predicts relatively weak stellar winds for the above mentioned luminosity range. Their H line equivalent widths are typically over an order of magnitude higher than those of other intermediate-luminosity hot stars (see, e.g., Be stars, Herbig Ae/Be stars; Miroshnichenko, 2008). It has been shown that a noticeable fraction of them (30%) are either recognized or suspected binary systems (Miroshnichenko, 2007; Miroshnichenko et al., 2007). Mass transfer between the stellar companions can be an important mechanism, responsible for accumulation of large amounts of CS gas and formation of CS dust in and around the system.
The CS matter distribution is a key factor that affects the observed parameters. Strong and fast stellar winds (e.g., in OB supergiants) introduce spectral line emission, but hardly alter the stellar continuum radiation due to a steep outward decrease of the CS gas density. In slowly expanding CS envelopes (e.g., Keplerian disks of Be stars or slow winds of B[e] supergiants) the line emission can be even stronger, and the free-free and bound-free radiation can significantly increase the object’s brightness in the optical region. It has been shown that CS disks in Be stars can contribute up to 70% to the stellar optical continuum (Telting et al., 1993; Carciofi et al., 2006). This effect can be important in FS CMa type objects, and neglecting it may lead to an overestimation of the luminosity.
Our previous studies of some FS CMa type objects (see, e.g., Miroshnichenko et al., 2000, 2002) did not take into account the entire variety of the CS effects on their parameters, because we had very sparse data at that time. Over the last few years we obtained multiple spectroscopic and photometric observations for a large fraction of the group members. Beginning with this paper, we will try to study carefully their properties in order to determine both stellar and circumstellar characteristics and ultimately understand the reasons for the B[e] phenomenon in the FS CMa group.
In this paper we report the results of our low- and high-resolution optical and near-IR spectroscopy and optical photometry of the optical counterpart of IRAS 00470+6429. Initial information about its spectrum and SED was reported by Polcaro et al. (2006) and Miroshnichenko et al. (2007). The object has been recognized as an emission-line star since the 1950’s (Gonzalez & Gonzalez, 1954) and repeatedly detected in later optical surveys for H line emitters (see, e.g., Coyne & MacConnell, 1983; Kohoutek & Wehmeyer, 1999). It was suggested to be a proto-planetary nebula (PPN) candidate by Meixner et al. (1999) and Kelly & Hrivnak (2005), but neither of these studies confirmed this hypothesis (see Section 4 for more detail). The object is located in an H II region S2–182 and seems to be its only illumination source (Russeil, Adami, & Georgelin, 2007). No radio flux exceeding 5 mJy was detected from the nebula at 4.89 GHz (Fich, 1993). Based on a radial velocity of the CO emission from the region (27 km s-1), Fich & Blitz (1984) estimated a distance toward it as 2.00.6 kpc. Russeil (2003) gives a systemic radial velocity of 32 km s-1 (from various data in the radio region) and a distance of 1.40.5 kpc. Both distances depend on the adopted Galaxy rotation curve and need verification with other data.
2 Observations
2.1 Spectra
Spectroscopic observations of IRAS 00470+6429 were obtained at several telescopes in 2003–2008. Information about the telescopes and spectrographs we used is presented in Table 1.
The optical spectrum of IRAS 00470+6429 is dominated by emission lines, most of which have P Cyg type profiles (mostly hydrogen and singly ionized metals). In particular, it contains many Fe II lines, which is typical of an object with the B[e] phenomenon. The absorption components of the P Cyg profiles are hard to trace, because in most lines they are broad and weak. Other factors that contribute to the problem are moderate signal-to-noise ratios at the continuum level in our data (typically 20–100) and complicated variations of the continuum in échelle spectra. There are many pure emission lines, such as [O I] 6300 and 6364 Å, which are the only forbidden lines detected in our spectra, weak and broad He I 5876 and 6678 Å lines, and hydrogen lines of the Paschen series in the red part of the spectrum. The O I triplet at 7770–7775 Å exhibits either an emission-absorption profile or a pure emission one. The near-IR Ca II triplet shows strong emission profiles. The equivalent width of the emission component of the H line varies between 60 Å and 100 Å with no obvious periodicity.
Absorption features detected in the spectrum are mostly interstellar (Na I 5889 and 5895 Å and diffuse interstellar bands, DIBs). Weak absorption lines of Mg II 4481 Å and Si II 5056 Å, typical of a hot star, were detected in some of our spectra. They are relatively narrow (full width at half maximum is 50 km s-1), suggesting a low rotation rate of the star. A weak absorption line of Li I 6708 Å is clearly seen in all the spectra obtained at McDonald (see Figure 2). It is the only detected feature of a late-type star that can be interpreted a sign of the presence of a secondary companion (see Section 4.2). This line was also detected in the spectra of several other FS CMa type objects (see Miroshnichenko et al., 2007).
The entire list of spectral lines detected in the object’s optical spectrum ( 0.38–1.05 m) is presented in Table 2. The radial velocities of the most prominent species in the spectra of some other stars close by on the sky that were observed in order to help constrain the distance to the object, are listed in Table 3. Most features of the optical spectrum are shown in Figure 1-3.
The near-IR spectra were obtained at the 3-m Shane telescope of the Lick Observatory with the Near-InfraRed Imaging Spectrograph (NIRIS, Rudy, Puetter, & Mazuk, 1999) in 2003 December and 2007 December. The 2003 observations were taken in two channels, which provide nearly continuous coverage between 0.8 and 2.5 m. Additionally, an optical channel was used in 2007 to cover a range between 0.48 and 0.9 m. The average spectral resolution is 800 in the optical channel and 700 in the near-IR channels. It shows only emission lines (H I, Fe II, O I) except for the He I 10830 Å line, which has both emission and absorption components (see the left panel of Figure 4) and is different from purely emission He I lines in the optical region. The Br line with a maximum intensity of 1.4 relative to the underlying continuum is weak (shown by Miroshnichenko et al., 2007), as it is superimposed on the thermal continuum produced by CS dust. Kelly & Hrivnak (2005), who took the object’s spectrum in 1999 with a three times lower resolving power, describe this line as strong at 1.2 continuum intensity at its maximum. The intensity difference can be explained by the different spectral resolution.
Our near-IR spectra exhibit the same features with roughly the same strengths, but the continuum level in 2007 is 20% weaker than that in 2003. The latter is consistent with the strong variations of the optical continuum (see Figure 5). The list of lines detected in the near-IR region ( 1.05–2.5 m) is presented in Table 4.
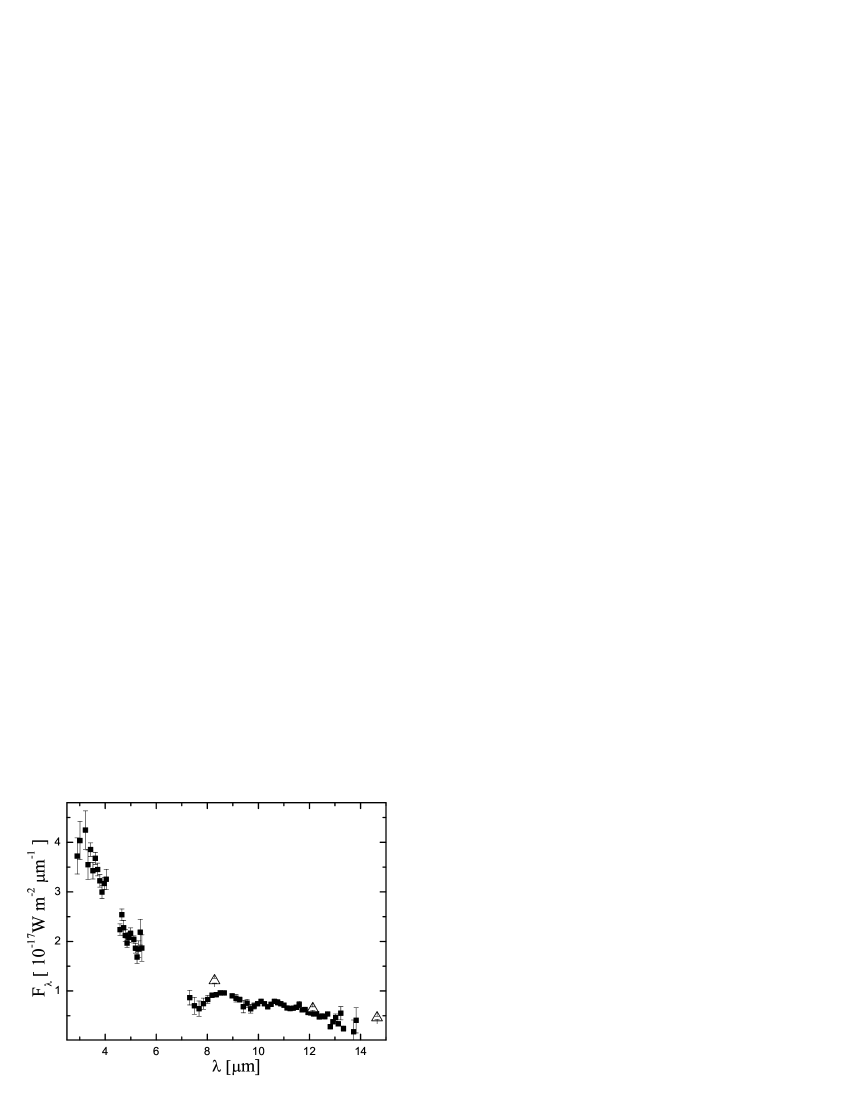
In 2003 October, IRAS 00470+6429 was observed with the Broadband Array Spectrograph (BASS, Hackwell et al., 1990) at the 3–m IRTF in the range 3–14 m. The flux level in this spectral region is consistent with that of the NIRIS data and the MSX data (Egan et al., 2003). The BASS spectrum shows no noticeable features, although there is some uncertainty in the region of the 9.7m silicate band due to difficulties in removing extinction by atmospheric ozone. There is a change of slope in the continuum near m (see right panel of Figure 4), which is probably due to the CS dust temperature structure.
2.2 Photometry
The photometric observations were also obtained at several observatories. At the Tien-Shan Observatory (Kazakhstan) and the Maidanak Observatory (Uzbekistan) we used single-element pulse-counting photometers. At the Lizard Hollow Observatory (LHO, Tucson, AZ), Sonoita Research Observatory (AZ), and two observatories in Norway (Bossmo and Persbuhaugen) we used CCD photometers. All our long-term sets taken at were reduced to the standard Johnson (Maidanak) or Johnson-Cousins (LHO and Sonoita) photometric system. The log of the photometric observations is presented in Table 5.
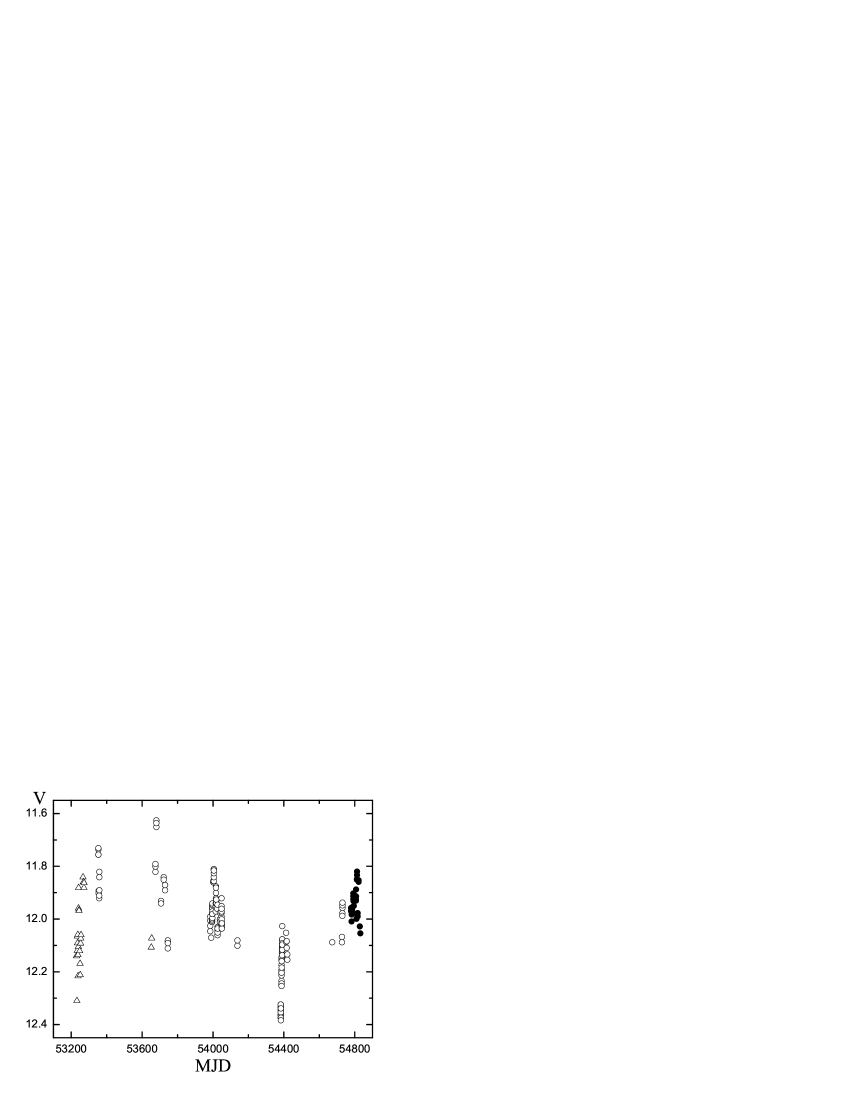
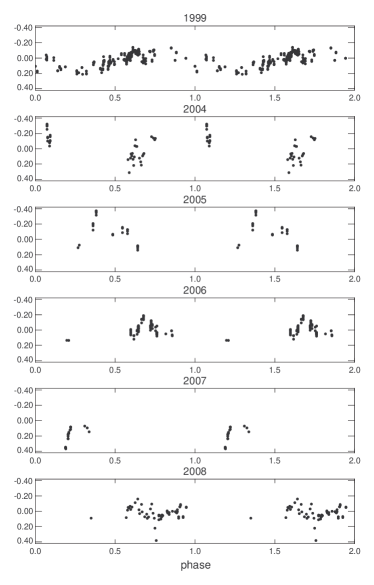
Before our campaign, the object was observed in the course of the Northern Star Variability Survey (NSVS, Wozniak et al., 2004a) with no filter. To compare these data with our -band photometry, we used a transformation derived by Wozniak et al. (2004a, ) and the average color from our Maidanak data. Since this transformation is based on the Tycho photometric system, which slightly deviates from the standard Johnson system (Hog et al., 1998), we expect a small systematic shift between the corrected NSVS and our data. The object’s light curve in the –band is shown in Figure 5.
We have used the northern location of the object to monitor its short-term variations during long winter nights at two observatories in Norway. In total we obtained three series of observations over seven hours each. The results are shown in Figure 6. The object’s brightness shows no significant variations on a timescale of a few hours. The 0.06–mag fading on 2007 January 23 and a similar brightening on 2006 December 28 may be due to changes in the CS medium, which is also suggested by the spectral line variations (see Section 2.1).
In all the observations we used BD+63∘98 as a comparison star (at 2 from the object) and USNO–B1.0 1547–0023650 (at 4) as a check star. No relative variations exceeding 0.02 mag have been detected for this pair of stars.
3 Data analysis
3.1 Light curve
The light curve was analyzed using the PERIOD software time-series analysis package from the Starlink Software Collection††thanks: Information about the collection is available from http://starlink.jach.hawaii.edu/release/. Periods were searched with two different methods: the method and the Lomb-Scargle periodogram analysis (Scargle, 1982). The first method is a straightforward technique, in which the input data are folded on a series of trial periods. At each trial period, the data are fitted with a sinusoid. The resulting reduced- values are plotted as a function of the trial frequency, and the minima suggest the most likely periods. This method is ideally suited to study any sinusoidal variations (Horne, Wade, & Szkody, 1986). The second method is a novel type of periodogram analysis, quite powerful for finding and testing the significance of weak periodic signals in otherwise random, unevenly sampled data (see Horne & Baliunas, 1986; Press & Rybicki, 1989).
False-alarm probabilities (FAP1) for the period were computed using a Fisher randomization test or a Monte-Carlo method (see, e.g., Nemec & Nemec, 1985). FAP1 represents the fraction of permutations (i.e. shuffled time-series) that contained a trough lower than (in the case of the method) or a peak higher than (in the case of the Lomb-Scargle periodogram analysis) that of the periodogram of an unrandomized dataset at any frequency. Therefore, this represents a probability that, given the frequency search parameters, no periodic component with this frequency is present in the data. To ensure reliable significance values, the minimum number of permutations was set to 1000. If a FAP1 lies between 0.00 and 0.01, then the corresponding period is correct with 95% confidence. Periods were searched for within an interval ranging from 0.5 day to 1000 days. The periodogram is computed at 1000 equally spaced frequencies between 0.001 and 2. As these two methods have yielded identical results, we discuss below only results of the Lomb-Scargle method.
We analyzed each of the long-term datasets separately as well as the combined one. We found that the Maidanak and LHO datasets show no significant cycles. The NSVS data exhibit two cycles, whose durations are 1 day and 25020 days (Figure 7). A careful analysis shows that the shorter cycle is caused by on-off time ratio of observations close to one day. The 250–day cycle can be easily recognized in the left panel of Figure 5. Unfortunately, the length of the NSVS dataset (only 237 days) permits no precise estimate the cycle duration. For example, Wozniak et al. (2004b) report a 302–day cycle for the same NSVS dataset. An analysis of own photometric data (LHO + Maidanak + SRO) obtained in 2004–2008 as well as of the combined dataset confirms neither of these long-term cycles. We should note that this might be partially due to a highly unequal time distributions of observations in our datasets (especially in the LHO data). There are only 60 nights with brightness measurements during a total period of 1427 nights. This leads to a low significance level of the peaks in the power spectrum. A -band light curve of IRAS 00470+6429 for the combined dataset folded with the 250–day period is shown in Figure 8.
Another cycle that emerges from our data is based on two minima near JD2453200 and JD2454400 (Figure 5). This timescale is close to that between the two minima of the He I line radial velocity, which occurred near JD2452900 and JD2454100 (Figure 11). The 1200–day cycle is probably of CS origin, because we observe no strong radial velocity variations of the Li I line, which should trace the motion of a secondary companion (see the discussion in Section 4.2). Further photometric and spectroscopic monitoring is needed to verify whether the cycle is stable.
3.2 Distance
The position of IRAS 00470+6429 (catalog ) in the sky is projected onto a region, occupied by the association Cas OB7 (catalog ). The association is thought to be located in the Perseus spiral arm, but the distance toward it is uncertain. It contains 40 B-type stars, whose brightness is dimmed by interstellar extinction in a range of AV from 2 to 3 mag. Humphreys (1978) placed it at 2.5 kpc from the Sun by averaging distances, calculated from the luminosity and reddening of individual members. Garmany & Stencel (1992) adopted a distance of 1.8 kpc, based on the best fit to an intrinsic color-magnitude diagram for the main-sequence B-type stars. Cazzolato & Pineault (2003) argued that Cas OB7 is surrounded by an expanding H I shell, whose approaching side is missing due to expansion into interarm space. These authors studied interstellar gas and dust around the association, and concluded that it is very patchy; and adopted a distance of 2 kpc for the association.
In order to constrain the distance of IRAS 00470+6429, we collected available photometric and spectroscopic information about projectionally close hot stars and obtained our own high-resolution spectra of six members of Cas OB7 at angular distances of from the object (see Table 3). Studying our spectra, we found a striking difference in the structure of the interstellar components of the Na I D-lines for the stars with very similar spectroscopic distances and reddenings. Some of them (Hiltner 74 (catalog ) and BD+6387) exhibit only one absorption component in each of the D-lines, while the others (Hiltner 62, HD 4694, HD 4841, and BD+63102) exhibit two components. The low-velocity component at (11–18) km s-1 originates in the local arm, while the high-velocity one at (58–66) km s-1 most likely forms in the Perseus arm within the association. The absence of the high-velocity component in the spectrum of IRAS 00470+6429 in combination with a high reddening and a strength of the diffuse interstellar bands, which is virtually equal to that of HD 4694 (see the lower panel of Figure 9), BD+63102, and BD+6387, suggests that our object is located near the closer edge of both the association and the Perseus arm. The high-velocity interstellar component of the sodium lines in the spectrum of IRAS 00470+6429, if it exists, is weak or blends with the CS absorption components (see the upper panel of Figure 9).
The position and width of the Na I D-line profiles in the spectrum of IRAS 00470+6429 are also very close to those of Cas (catalog ), a supergiant from the association Cas OB14 (catalog ) (Humphreys, 1978). Cas OB14 is located at from Cas OB7, but Cas OB14 is about half as far from the Sun, and its stars are much less reddened than those of Cas OB7 (see Figure 10). Additionally, heliocentric radial velocities of the emission components of the metallic lines in the spectrum of IRAS 00470+6429 ((40–20) km s-1) are closer to those of members of Cas OB7 ((60–35) km s-1) than to those of members of Cas OB14 (e.g., (2–9) km s-1 for HD 2905, Münch, 1957; Humphreys, 1978).
The spectroscopic distances of the Cas OB7 members with one Na I D-line component are 0.1 kpc smaller than those of the members with two line components (see Table 3). Taking into account uncertainties in the distance determination due to using average luminosities for the adopted MK types (Straizys & Kuriliene, 1981), we estimate a distance of 2.00.3 kpc toward IRAS 00470+6429, as an initial approximation. Its lower limit is constrained by the distance of the nearest edge of the Perseus arm, which is not precisely known. Its upper limit cannot exceed distances toward stars with two sodium line components near the object. The distance toward IRAS 00470+6429 is also in agreement with independently derived distance of Sh2–182 (see Section 1).
High-resolution spectroscopy of more members of Cas OB7 is needed to put better constraints on the distances. We also note that the distance of Cas OB7 adopted by Garmany & Stencel (1992) does not appear well-justified, as not all stars in it might have been born at the same time. This opinion is corroborated by large deviations of spectroscopic distances of individual stars from 1.8 kpc.
Our observations of stars near IRAS 00470+6429 also revealed that radial velocities of Hiltner 62 and BD +6387 are inconsistent with the Galactic rotation for their spectroscopic distances (see Table 3), probably indicating their binary nature. Based on our spectra, we classify HD 4694 as B3 Ib and BD+63102 as B1 III instead of B3 Ia and B1 II, respectively, as suggested earlier (see, e.g., Garmany & Stencel, 1992).
3.3 Stellar parameters
The average brightness of IRAS 00470+6429 ( mag) and the above distance estimate rule out a high luminosity for the hot star. The absence of luminosity sensitive photospheric lines, such as Si III 5739 Å (Miroshnichenko et al., 2004) and Si II 6347 and 6371 Å (Rosendhal, 1974), which are seen in the spectra of supergiants with even stronger line emission, supports this conclusion.
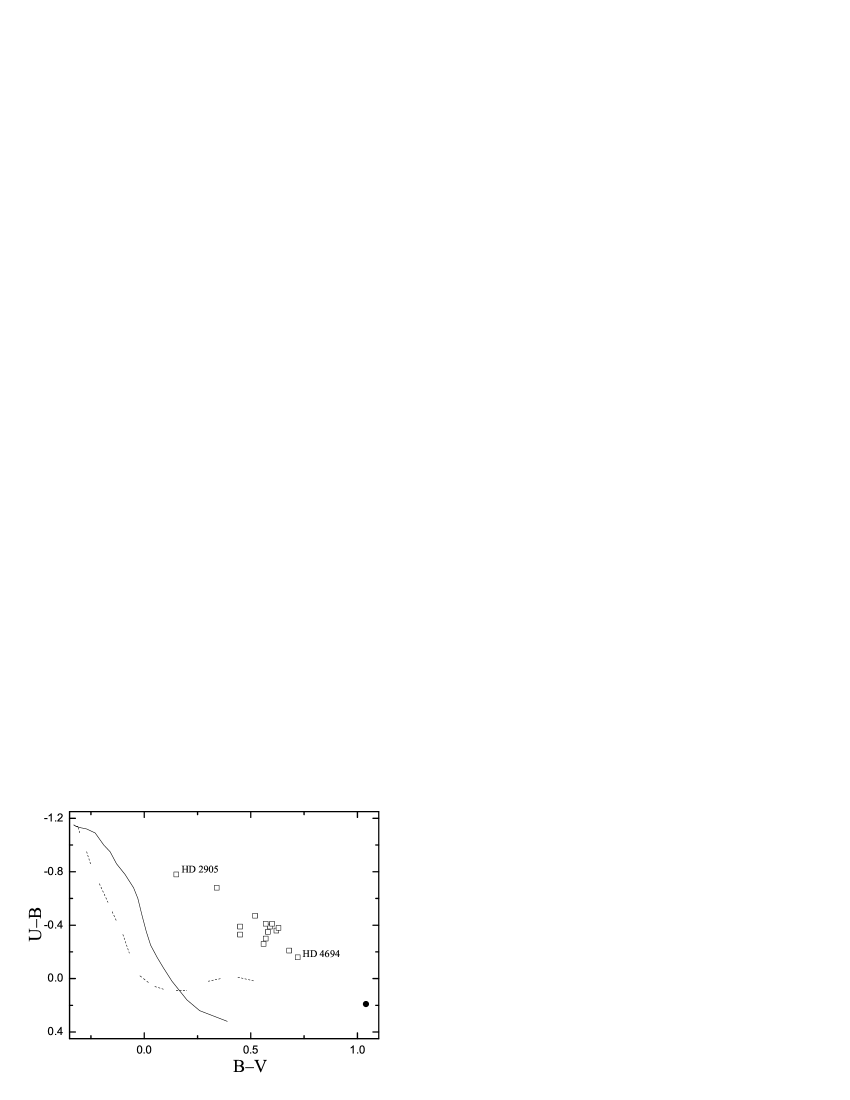
Our multicolor photometric data give the following average color-indices in the Johnson photometric system: , , and mag. Comparison with those of projectionally close B-type stars from Cas OB7 and Cas OB14 shows that IRAS 00470+6429 has the strongest reddening. Part of it is definitely due to the CS matter, because even more distant stars of Cas OB7 are bluer than the object (see Figure 10). Using a relationship between the DIB strengths and reddening from Herbig (1993), we estimate the interstellar component of the reddening toward IRAS 00470+6429 to be mag. This estimate coincides with that calculated for HD 4694 ( = 0.72 mag, Hiltner, 1956), thus supporting the use of the relationship.
The CS component of the reddening depends somewhat on the object’s spectral type, which can be constrained from the spectral line content. The absence of high excitation lines, the weakness of the He I emission lines (which may be excited by a different source, see Section 3.4), and the average optical color-indices (assuming that the wavelength dependence of the CS reddening is not very different from that of the interstellar one) suggest that the star’s spectral type is B2–B3. Therefore, the CS part of the reddening is mag.
Assuming that the overall selective reddening is mag, the total extinction is AV = 3.1 3.8 mag, the star’s effective temperature is T 20000 K, and the distance is 2.00.3 kpc, one can estimate the star’s luminosity to be (L/L) = 3.90.3. This estimate places IRAS 00470+6429 in the middle of the luminosity distribution of the FS CMa group (Miroshnichenko, 2007).
The adopted luminosity is somewhat uncertain, because neither a contribution to the optical continuum from the CS gas nor a possible deviation of the CS reddening law from the interstellar one was taken into account. This can only be resolved by careful modeling, which will be presented in the next paper of this series. However, we do not expect the correction to be large, because we still detect photospheric lines (see Section 2.1). They are weak, indicating that the photospheric spectrum is partially veiled by the CS free-free and bound-free continuum radiation. Nevertheless, the observed optical color-indices of IRAS 00470+6429 do not noticeably deviate from those expected from a normal B2–B3 star affected by interstellar reddening (see Figure 10).
3.4 CS gas
The presence of P Cyg profiles in the spectrum of IRAS 00470+6429 is unusual for the FS CMa star group, the majority of whose members exhibit single- or double-peaked profiles that are typical for disk-like CS gaseous envelopes. There are only two other objects in the entire group with P Cyg type profiles: AS 78 (catalog ) (Miroshnichenko et al., 2000) and HD 85567 (catalog ) (Miroshnichenko et al., 2001). However, this type of a line profile does not exclude a disk-like geometry, which is natural in a binary system (our working hypothesis for explaining properties of FS CMa stars, Miroshnichenko, 2007). In this case, the orbital plane should be viewed nearly edge-on. In combination with narrow photospheric lines, this suggestion favors a low rotational velocity of the primary companion.
P Cyg type profiles are observed in various groups of early-type emission-line stars. In supergiants with accelerating stellar winds, spectral lines are not very strong because of a fast matter density decrease with distance from the star. The position of the blue edge of the line absorption component roughly marks the wind terminal velocity. In pre-main-sequence Herbig Ae/Be stars with more complicated CS envelopes, which include both accretion (in a disk) and outflow (in a wider range of angles), the material is thought to have higher velocities near the star (for a review and an example see Beskrovnaya & Pogodin, 2004). Therefore, the blue edge of the line may mark the velocity of material that was recently ejected from the stellar surface. It seems unlikely that the wind of a relatively low-luminosity star, such as IRAS 00470+6429, will accelerate up to the radial velocities of the blue edges of the Balmer lines (in some spectra they reach 900 km s-1) through radiation pressure in spectral lines as in supergiants.
Thus, we assume a different mechanism of the CS gaseous envelope formation in the object. Following the reasoning of Miroshnichenko (2007), IRAS 00470+6429 does not seem to be a young star, and one should not expect a protostellar type accretion to be responsible for the formation of the CS disk. On the other hand, the object is probably a binary system (see Section 4.2), in which the disk forms through mass loss from the hot primary or mass transfer from the secondary. Additional matter ejection in the line of sight, even if the orbital plane deviates from this direction, could account for the observed absorption components of the P Cyg line profiles.
The profile shapes vary with time (see Figure 11). The position of the emission component in the P Cyg type profiles depends on the strength of the absorption component. However, it seems that the entire spectrum shifts with time. This is based on the observed differences of the radial velocities of the emission components of Fe II, Na I, and Balmer lines measured in different spectra. The differences have the same sign and are close in magnitude.
The shape of the absorption components in the P Cyg type profiles is complicated and variable. This is clearly seen in the strongest lines, such as the Balmer lines (see Figure 11), Na I and Fe II (mult. 42). These lines have multiple absorption components, whose boundaries (especially the blue ones) are very sharp. In particular, strong absorption components in the spectrum of 2005 November 11 are almost rectangular. Their depth is nearly the same in the range of radial velocities from 200 to 100 km s-1 in the Fe II (mult. 42) lines and from 250 to 90 km s-1 in H and H.
Our spectra obtained in 2005 November with the 6-m telescope of SAO RAS show that the profile shape varies noticeably in just a few days. This is detected in the Fe II 5316 Å and 5363 Å lines. The line intensities did not change between 11 and 14 November, but their emission peaks shifted by +8 km s-1, while the deepest depressions in their absorption components got shifted by 20 km s-1. On the other hand, in our short series of three spectra taken at San Pedro Martir in 2006 December 2006 and 2007 November (which also have a lower resolution) such shifts are within the measurement uncertainties.
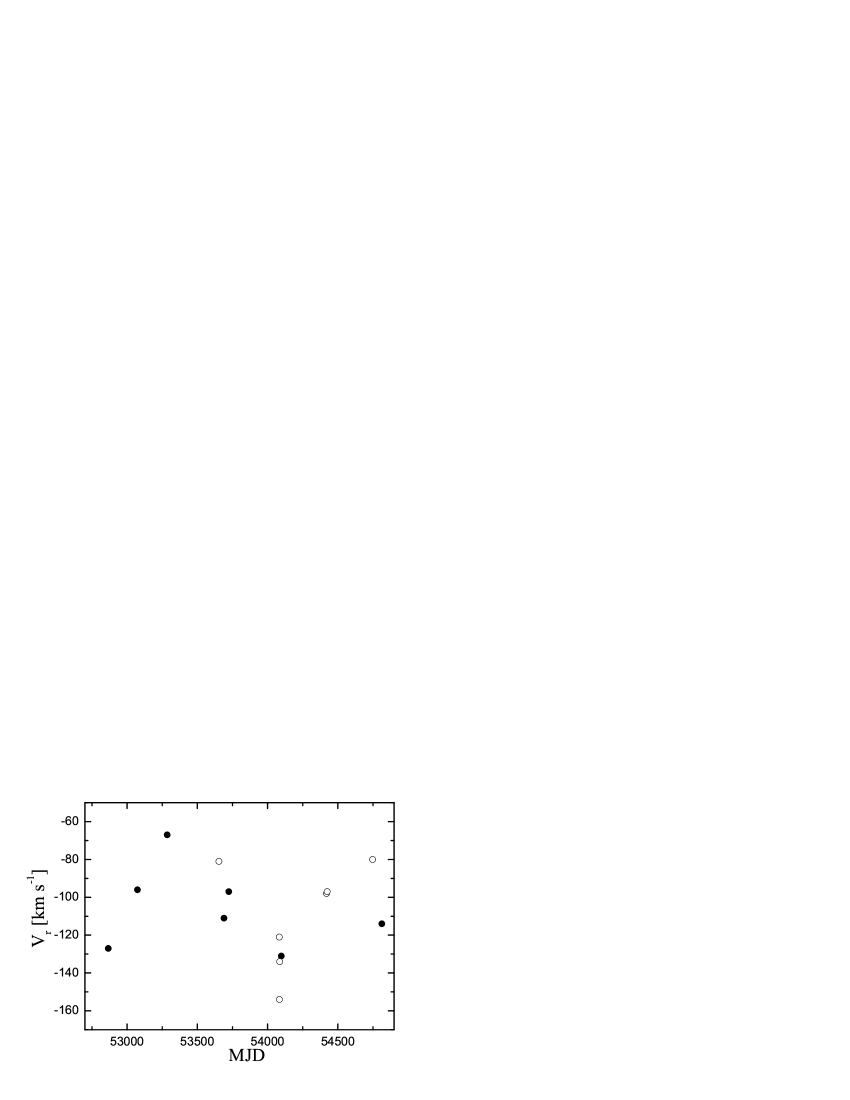
One of the most interesting findings from our spectroscopic data is the relative behavior of the He I 5876 Å and 6678 Å emission lines compared to the other observed emission lines. First, the He I lines show pure emission profiles that are broader than the emission components of the Balmer and Fe II lines. Second, their average radial velocity is km s-1 versus km s-1 for the emission components of the Balmer lines and km s-1 for those of the Fe II lines. A similar phenomenon was found in several other FS CMa type objects, such as MWC 657 (Miroshnichenko et al., 2000) and AS 160 (Miroshnichenko, Klochkova, & Bjorkman, 2003). Finally, they appear to exhibit a long-term ( 1200 days), probably cyclic, variation (Figure 12). He I lines usually form near the base of the stellar wind, and the observed variations may be due to those of the mass loss. This process is also reflected in the variable CS components of the H and Na I lines (see Figure 11).
3.5 CS dust
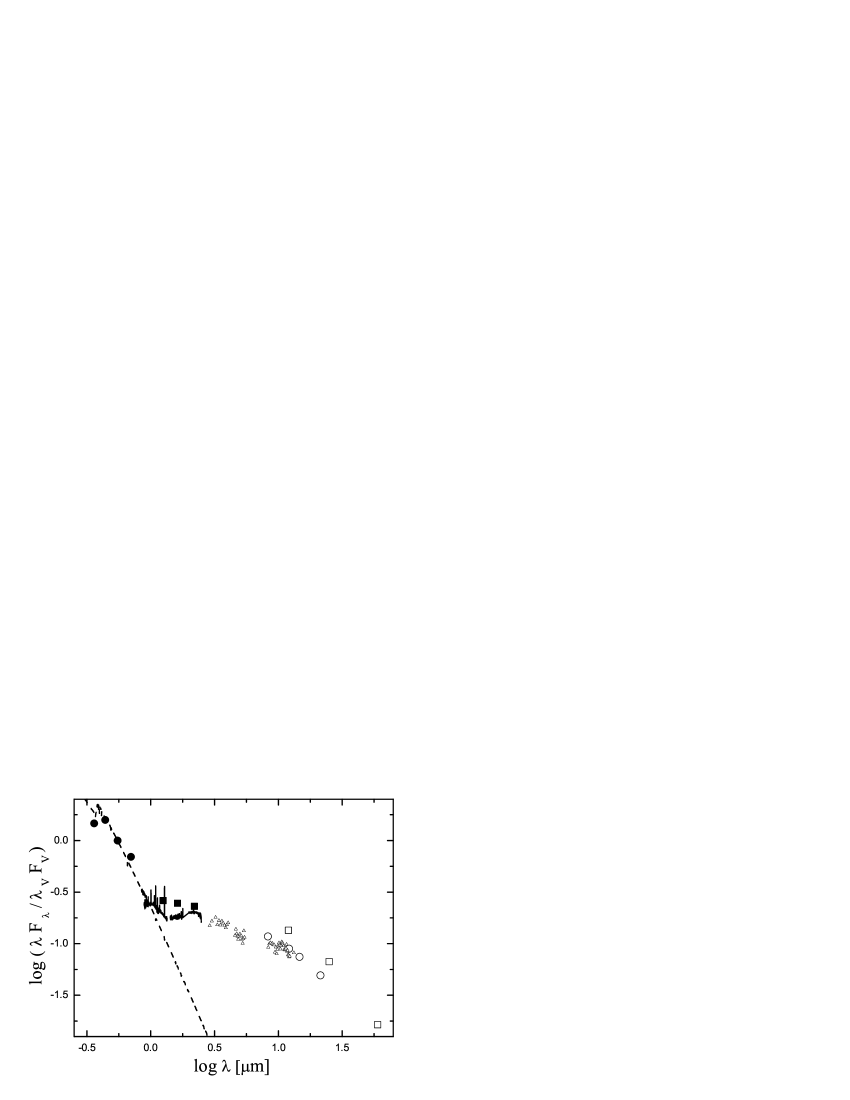
The strong IR excess observed in IRAS 00470+6429, whose SED shown in Figure 13 is definitely due to CS dust emission. It is clearly seen that the IRAS data obtained through large apertures (1) deviate from those of BASS and MSX. The IRAS data include a contribution from the entire H II region and perhaps additional emission from interstellar IR cirrus at = 60 m (see Section 4.1).
The SED does not show any noticeable silicate feature at m. This might be due to a large average grain size, the absence of silicates in the CS dust, or a large optical depth. At this point, it is unclear which of these explanations is correct. It seems unlikely that the grains are large, because the entire evolutionary phase of FS CMa objects does not seem to last long. Otherwise, we would observe many more such objects, because they populate a large region of the Hertzsprung-Russell diagram.
The dust chemical composition is still uncertain. Our observations of FS CMa objects with the InfraRed Spectrograph (IRS) of the Spitzer Space Telescope show that a significant fraction of them exhibit weak silicate emission features (Miroshnichenko et al., 2008). Unfortunately, IRAS 00470+6429 was not observed in this program because of the presence of a bright nearby IR source. However, our BASS spectrum seems to rule out silicate dust with a low optical depth, which would produce a strong emission at m.
4 Discussion
Let us consider the nature and evolutionary state of IRAS 00470+6429 in more detail. As mentioned in Section 1, the object has only been suggested to be a PPN candidate (Meixner et al., 1999; Kelly & Hrivnak, 2005). Miroshnichenko (2007) discussed general differences between the FS CMa objects and post-AGB stars. Here we attempt a deeper analysis for IRAS 00470+6429.
4.1 Evolutionary state
Meixner et al. (1999) were the first to select the object as a PPN candidate, but they have not justified their choice. It might be due to the 100–m IRAS flux ( Jy, Joint IRAS Science W.G., 1986), which is stronger than those at 12, 25, and 60 m. However, as IRAS 00470+6429 is located near the Galactic plane (), its IR fluxes may be affected by the interstellar dust emission (IR cirrus) and contaminated by emission from projectionally close sources. Co-addition of all IRAS scans through the source position (the SCANPI procedure, Weaver & Jones, 1992) shows that the spatially wide 100–m IRAS band at least partially include two optically brighter nearby late-type stars; BD (catalog ) at 2 and V634 Cas (catalog ) at 4 from the IRAS 00470+6429. Another contribution may come from the H II region Sh2–182, which is considered to be illuminated by the object (Russeil, Adami, & Georgelin, 2007). Finally, the surface brightness of the sky region, which surrounds IRAS 00470+6429, at m is high enough for the IR cirrus emission to be important. It is represented by the cirr3 parameter in the IRAS Point Source Catalog. It is of the order of 713 MJy ster-1 for IRAS 00470+6429 and nearby objects. According to Ivezić & Elitzur (1995), IR cirrus affect both the 60–m (F60) and 100–m fluxes of a point source even with a CS envelope, if cirr3/F 1–5. This ratio is over 30 for IRAS 00440+6429. Therefore, the object’s high 100–m flux is unreliable.
Imaging at m (Meixner et al., 1999) and spectroscopy near m (Kelly & Hrivnak, 2005) showed no features, specific to the post-AGB evolution. On the other hand, these results are inconclusive. Although neither Meixner et al. (1999) nor Kelly & Hrivnak (2005) discarded the object from their PPN candidate lists, there is no compelling evidence that it undergoes this evolutionary stage.
The main combination of features that distinguishes IRAS 00470+6429 from most post-AGB objects includes an early spectral type, strong emission-line spectrum and near-IR excess, and a flux decrease longward of the 25–m IRAS band. Typically the dust, responsible for the IR excess, is mostly produced during the AGB stage. A strong stellar wind, which weakens as the object enters the post-AGB stage, efficiently moves the dust away, so that a small fraction of hot dust survives near the star. This makes the near-IR excess small and produces a well-known double-peaked SED with the short-wavelength peak due to the direct star’s radiation and the long-wavelength peak due to the dust radiation (see, e.g., van Hoof, Oudmaijer, & Waters, 1997). The long-wavelength peak typically has the highest flux either in the 25–m or in the 60–m IRAS band. Therefore, in an IRAS color-color diagram FS CMa objects may be mixed with those at the post-AGB stage (see Miroshnichenko, 2007).
Inspection of a recent catalog of PPNe by Szczerba et al. (2007) shows that it contains 70 objects, which have been classified as B- or A-type stars. Forty two of them have IRAS data, but only seven satisfy both photometric criteria for FS CMa objects (see Figs. 1 and 2 of Miroshnichenko et al., 2007). Five of these seven objects have spectra with weak emission lines and many photospheric features. The remaining two objects are MWC 939 (catalog ), which is an unconfirmed PPN and a candidate member of the FS CMa group (Miroshnichenko, 2007), and M2–56 (catalog ), which was mentioned in Miroshnichenko (2007) as an example of a possible confusion between the FS CMa objects and intermediate-mass PPNe. Thus, IRAS 00470+6429 is not a typical PPN of an early spectral type.
M2–56 is a post-AGB object surrounded by a bipolar nebula. According to Castro-Carrizo et al. (2002), its closest distance (2 kpc) coincides with that we suggest for IRAS 00470 +6429. One possibility for our object to be a PPN is to evolve fast enough, so that its nebula is still too small to be resolved. During the post-AGB stage, objects keep roughly a constant luminosity, and their photospheric temperature increases at a different rate that depends on the object’s mass. The highest-mass objects exhibit noticeable spectral changes over a timescale of a few decades. These changes are accompanied by a decrease of the optical brightness, as a wavelength of the strongest photospheric radiation shifts toward UV domain. Our spectroscopic data for IRAS 00470+6429 show no change in the spectral line content. Its optical brightness in 2003–2008 ( mag) is marginally lower than that in 1958, when Dolidze & Ponomareva (1975) first recorded it as a 12.7–mag star in the photographic region, which roughly corresponds to the modern -band of the Johnson photometric system. However, the accuracy of the latter estimate as well as that of its transformation into the -magnitude system cannot be verified. Also, recognized high-mass PPNe with strong emission-line spectra that also show evidence for a rapid spectral evolution (see, e.g., OY Gem (catalog ), Jaschek, Andrillat, & Jaschek, 1996; Arkhipova et al., 2006) exhibit much stronger forbidden lines and virtually no near-IR excess. Finally, our luminosity estimate for the object is at least a factor of two lower than those expected for a fast-evolving post-AGB object with physical parameter changes to be detected over a few decades (Blöcker, 1995).
IRAS 00470+6429 also has some similarities with lower-mass post-AGB objects. These objects (RV Tau stars) pulsate with periods of 30–150 days due to being located within an instability strip. A group of them, known as RVb type, shows additional long-term photometric variations with periods from 600 to 1500 days (De Ruyter et al., 2006). Some RV Tau stars are binary systems surrounded by dusty disks. There is a marginal detection of variability with a timescale of 1200 days in the photometry (see Figure 5). There is also independent, spectroscopic evidence (see Section 4.2) that the system is a binary with a gaseous-and-dusty disk. On the other hand, RV Tau stars exhibit spectroscopic properties of supergiants with weak emission-line spectra. They also have mostly F–K spectral types and a significant deficit of iron (De Ruyter et al., 2006). If IRAS 00470+6429 is an extremely evolved RV Tau object, then one could expect to see some features of a planetary nebula, such as an expanding shell similar to the one observed in M2–56, and evidence of a chemical evolution in the spectrum. No observation reported in this paper clearly supports that IRAS 00470+6429 belongs to the RV Tau group.
4.2 Single or binary?
FS CMa objects exhibit some features that are indicative of the presence of secondary stellar companions. Some of them show absorption lines that are typical for late-type stars (e.g., Li I 6708 Å and Ca I 6717 Å) in addition to emission lines that require the presence of a hot star. These are MWC 623 (catalog ) (Zickgraf, 2001), MWC 728 (catalog ), AS 174 (catalog ), and FX Vel (catalog ) (Miroshnichenko et al., 2007). Also, CI Cam (catalog ) has a degenerate secondary (a white dwarf or a neutron star), which is thought to be responsible for a major eruption in the system in 1998 (see, e.g., Clark et al., 2000). A traveling emission line of He II at 4686 Å with a similar profile to that of the He I lines in IRAS 00470+6429 was found in the spectrum of CI Cam by Barsukova et al. (2006).
The absence of high-excitation lines and the presence of a weak absorption line of Li I at 6708 Å in the spectrum of IRAS 00470+6429 suggest that its secondary companion is a late-type object. The line was detected in all our spectra taken at McDonald and has an equivalent width of 0.04 Å. Its heliocentric radial velocity was 4 km s-1 in 2005 December, 14 km s-1 in 2006 December, and 18 km s-1 in 2008 December. This virtual constance is inconsistent with the strong variations of the He I lines, so that these phenomena may not be related to each other. This information is insufficient to constrain the putative secondary’s properties.
The presence of the Li I line might also be due to convection as a result of the Hot Bottom Burning (HBB) process, which occurs during the AGB stage (Maceroni et al., 2002). However, for this process to occur, the star has to be at a high end of the mass range of stars that follow this evolutionary path. If IRAS 00470+6429 is a post-AGB object, its luminosity we derive here is not high enough to have HBB. Maceroni et al. (2002) observed several objects in this luminosity range (for example, NGC 1866 , and ) and have detected no traces of the Li I 6708 Å line in their spectra. Also, the radial velocity of this line in the spectrum of IRAS 00470+6429 is significantly different from that of the few reliably detected photospheric absorption lines (e.g., Mg II 4481 Å) and from those of Fe II emission lines, which are believed to trace the star’s velocity.
Using our photometric data and the fact that the Li I line is the only one that does not seem to belong to the hot companion, we can roughly estimate an upper limit for the secondary’s luminosity. It has to be a factor of a few less luminous than the hot companion near the Li I line wavelength, otherwise traces of numerous absorption lines of neutral metals (e.g., Fe I, Ca I as, for instance, seen in the spectrum of MWC 623; Zickgraf, 2001) would appear in the spectrum. The red spectral region seems to be slightly affected by the CS contribution, which is not well-constrained (see Section 3.3), but the secondary’s continuum is not noticeable. Therefore, the secondary should be at least 1 mag fainter in the -band. If it is an early K–type star, as in the case of MWC 623 (Zickgraf, 2001), its luminosity does not exceed 500 L⊙. Given the available evidence, it is not possible to further constrain the secondary’s spectral type. Formally, this estimate assumes that the luminosity type is between IV and III (Straizys & Kuriliene, 1981). A dwarf of any appropriate late spectral type would be too dim to reveal any of its features, while a bright giant or a supergiant would dominate in a region between 0.5–1.5 m (CS dust takes over at longer wavelengths).
5 Conclusions
We accomplished a five-year long (2003–2008) photometric and spectroscopic monitoring of the optical counterpart of the IR source IRAS 00470+6429. Our results in combination with other available data for the object and information about surrounding stars and associations allowed us to reach the following conclusions.
-
•
The optical counterpart of IRAS 00470+6429 is most likely a binary system with a B-type visible primary companion and a much fainter late-type secondary companion. The main indication in favor of the binary hypothesis is the presence of a weak Li I 6708 Å absorption line in the object’s spectrum.
-
•
The primary companion is a B2–B3 spectral type with a luminosity of L/L = 3.90.3 at a distance of 2.00.3 kpc from the Sun. The system probably belongs to the stellar association Cas OB7. Properties of the association members need to be better constrained with high-resolution spectroscopy to improve its distance and investigate the fine internal structure, revealed in this study.
-
•
The optical brightness variations exceed 0.5 mag that is typical for FS CMa type objects. Many lines in the spectrum of the B-type companion exhibit variable P Cyg type profiles. Also, multiple variable CS absorption components of the Na I D-lines were detected. This indicates the presence of a significant amount of CS gas in the line of sight. Nevertheless, most of the observed reddening has interstellar origin.
-
•
Although some similarities with post-AGB type objects can be identified in the properties of IRAS 00470+6429 (e.g., possible long-term variation cycles), it is unlikely to be highly evolved.
The results of this study support our earlier hypothesis that FS CMa type objects are binary systems. The sparseness of our spectroscopic data did not allow us to find the orbital period of the IRAS 00470+6429 system. In the next paper of this series we will present an initial attempt to model the wealth of data available for this object.
References
- Allen & Swings (1976) Allen, D.A., & Swings, J.-P. 1976, A&A, 47, 293
- Arkhipova et al. (2006) Arkhipova, V.P., Klochkova, V.G., Chentsov, E.L., Esipov, V.F., Ikonnikova, N.P., & Komissarova, G.V. 2006, Astron. Lett., 32, 661
- Barsukova et al. (2006) Barsukova, E.A., Borisov, N.V., Burenkov, A.N., Klochkova, V.G., Goranskij, V.P., & Metlova, N.V. 2006, Astron. Rep., 50, 664
- Beskrovnaya & Pogodin (2004) Beskrovnaya, N.G., & Pogodin, M.A. 2004, A&A, 414, 955
- Blöcker (1995) Blöcker T., 1995, A&A, 299, 755
- Carciofi et al. (2006) Carciofi, A.C., et al. 2006, ApJ, 652, 1617
- Castro-Carrizo et al. (2002) Castro-Carrizo, A., Bujarrabal, V., Sánchez Contreras, C., Alcolea, J., & Neri, R. 2002, A&A, 386, 633
- Cazzolato & Pineault (2003) Cazzolato, F., & Pineault, S. 2003, AJ, 125, 2050
- Clark et al. (2000) Clark, J.S., et al. 2000, A&A, 356, 50
- Coyne & MacConnell (1983) Coyne, G.V., & MacConnell, D.J. 1983, Vatican Obs. Publ., 2, 73
- De Ruyter et al. (2006) De Ruyter, S., Van Winckel, H., Maas, T., Lloyd Evans, T., Waters, L.B.F.M., & Dejonghe, H. 2006, A&A, 448, 641
- Dolidze & Ponomareva (1975) Dolidze, N., & Ponomareva, G. 1975, Soviet Astron., 9, 157
- Egan et al. (2003) Egan, M.P., et al. 2003, The Midcourse Space Experiment Point Source Catalog Version 2.3 (October 2003), AFRL-VS-TR–2003–1589
- Fich (1993) Fich, M. 1993, A&AS, 86, 475
- Fich & Blitz (1984) Fich, M., & Blitz, L. 1984, ApJ, 279, 125
- Garmany & Stencel (1992) Garmany, C.D., & Stencel, R.E. 1992, A&AS, 94, 211
- Gonzalez & Gonzalez (1954) Gonzalez, G., & Gonzalez, G. 1954, Bol. Obs. Tonantz. Tacub., 1, No 9, 3
- Hackwell et al. (1990) Hackwell, J.A., et al. 1990, in SPIE Conf. Series 1235, Instrumentation in Astronomy VII, (Bellingham, WA: SPIE), 171
- Herbig (1993) Herbig, G.H. 1993, ApJ, 407, 142
- Hiltner (1956) Hiltner, W.A. 1956, ApJ, 2, 389
- Hog et al. (1998) Høg, E., et al. 1998, in IAU Symp. 179, New Horizons from Multi-Wavelength Sky Surveys, ed. B. J. McLean, D. A. Golombek, J. J. E. Hayes, and H. E. Payne (Dordrecht: Kluwer), 395
- Horne, Wade, & Szkody (1986) Horne, K., Wade, R.A., & Szkody, P. 1986, MNRAS, 219, 791
- Horne & Baliunas (1986) Horne, J.H., & Baliunas, S.L. 1986, AJ, 302, 757
- Humphreys (1978) Humphreys, R.M. 1978, AJ, 38, 309
- Ivezić & Elitzur (1995) Ivezić, Ž., & Elitzur, M. 1995, ApJ, 445, 415
- Jaschek, Andrillat, & Jaschek (1996) Jaschek, C., Andrillat, Y., & Jaschek, M. 1996, A&AS, 117, 281
- Joint IRAS Science W.G. (1986) Joint IRAS Science W.G. 1986, IRAS Catalog of Point Sources, Version 2.0, IPAC
- Kelly & Hrivnak (2005) Kelly, D.M., & Hrivnak, B.J. 2005, ApJ, 629, 1040
- Kohoutek & Wehmeyer (1999) Kohoutek, L., & Wehmeyer, H. 1999, A&AS, 134, 255
- Kurucz (1994) Kurucz, R. L. 1994, Kurucz CD ROM 19, Solar Model Abundance Model Atmospheres, (Cambridge: Smithsonian Astrophysical Observatory)
- Levine & Chakrabarty (1995) Levine S., & Chakrabarty D. 1995, IA-UNAM Tech. Rep., MU–94–04
- Maceroni et al. (2002) Maceroni, C., Testa, V., Plez, B., García-Lario, P., & D’Antona, F. 2002, A&A, 395, 179
- McCarthy et al. (1993) McCarthy, J.K., Sandiford, B.A., Boyd, D., & Booth, J. 1993, PASP, 105, 881
- Meixner et al. (1999) Meixner, M. et al. 1999, ApJS, 122, 221
- Miroshnichenko (2007) Miroshnichenko, A.S. 2007, ApJ, 667, 497
- Miroshnichenko (2008) Miroshnichenko, A.S. 2008, in ASP Conf. Ser. 388, Mass Loss from Stars and the Evolution of Stellar Clusters, ed. A. de Koter, L.J. Smith, and L.B.F.M. Waters, (San Francisco: ASP), 205
- Miroshnichenko et al. (2000) Miroshnichenko, A.S., et al. 2000, A&AS, 147, 5
- Miroshnichenko et al. (2001) Miroshnichenko, A.S., et al. 2001, A&A, 371, 600
- Miroshnichenko et al. (2002) Miroshnichenko, A.S., et al. 2002, A&A, 388, 563
- Miroshnichenko, Klochkova, & Bjorkman (2003) Miroshnichenko, A.S., Klochkova, V.G., & Bjorkman, K.S. 2003, Astronomy Letters, 29, 336
- Miroshnichenko et al. (2004) Miroshnichenko, A.S., et al. 2004, A&A, 417, 731
- Miroshnichenko et al. (2007) Miroshnichenko, A.S., et al. 2007, ApJ, 671, 828
- Miroshnichenko et al. (2008) Miroshnichenko, A.S., et al. 2008, AAS, 212, 09.01
- Münch (1957) Münch, G. 1957, ApJ, 125, 42
- Nemec & Nemec (1985) Nemec, A.F.L., & Nemec, J.M. 1985, AJ, 90, 2317
- Panchuk et al. (2007) Panchuk, V. E., Klochkova, V. G., Yushkin, M., & Najdenov, I. D. 2007, in The UV Universe: stars from birth to death. Proceedings of the Joint Discussion No. 4 during the IAU General Assembly of 2006, ed. A.I. Gomez de Castro & M.A. Barstow (Cambridge: Cambridge Univ. Press), 179
- Polcaro et al. (2006) Polcaro, V.F., Miroshnichenko, A.S., Bernabei, S., Viotti, R.F., Rossi, C., & Norci, L. 2006, in ASP Conf. Ser. 355, Stars with the B[e] Phenomenon, ed. M. Kraus, & A.S. Miroshnichenko, (San Francisco: ASP), 343
- Press & Rybicki (1989) Press, W.H., & Rybicki, G.B. 1989, ApJ, 338, 277
- Rosendhal (1974) Rosendhal, J.D. 1974, ApJ, 187, 261
- Rudy, Puetter, & Mazuk (1999) Rudy R. J., Puetter, R. C., & Mazuk, S. 1999, AJ, 118, 666
- Russeil (2003) Russeil, D. 2003, A&A, 397, 133
- Russeil, Adami, & Georgelin (2007) Russeil, D., Adami, C., & Georgelin, Y.M. 2007, A&A, 470, 161
- Savage & Mathis (1979) Savage, B.D., & Mathis, J.S. 1979, ARA&A, 17, 73
- Scargle (1982) Scargle, J.D. 1982, ApJ, 263, 835
- Straizys & Kuriliene (1981) Straizys, V, & Kuriliene, G. 1981, Ap&SS, 80, 353
- Szczerba et al. (2007) Szczerba, R., Siódmiak, N., Stasińska, G., & Borkowski, J. 2007, A&A, 469, 799
- Telting et al. (1993) Telting, J.H., Waters, L.B.F.M., Persi, P., & Dunlop, S.R. 1993, A&A, 270, 355
- Tull et al. (1995) Tull, R.G., MacQueen, P.J., Sneden, C., & Lambert, D.L. 1995, PASP, 107, 251
- van Hoof, Oudmaijer, & Waters (1997) van Hoof, P.A.M., Oudmaijer, R.D., & Waters, L.B.F.M. 1997, MNRAS, 289, 371
- Weaver & Jones (1992) Weaver, W.B., & Jones, G. 1992, ApJS, 78, 239
- Wozniak et al. (2004a) Wozniak, P.R., et al. 2004a, AJ, 127, 2436
- Wozniak et al. (2004b) Wozniak, P.R., Williams, S.J., Vestrand, W.T., & Gupta, V. 2004b, AJ, 128, 2965
- Zickgraf (2001) Zickgraf, F.-J. 2001, A&A, 375, 122
| Date | HJD | Range | Exp.time | Ref. | Date | HJD | Range | Exp.time | Ref. |
|---|---|---|---|---|---|---|---|---|---|
| mm/dd/yyyy | 2450000+ | Å | s | mm/dd/yyyy | 2450000+ | Å | s | ||
| 08/14/2003 | 2866.42 | 5278–6760 | 3600 | 1 | 12/27/2006 | 4096.65 | 3600–10500 | 3600 | 6 |
| 08/18/2003 | 2869.81 | 3800–5600 | 3170 | 2 | 12/28/2006 | 4097.64 | 3600–10500 | 3600 | 6 |
| 03/09/2004 | 3073.52 | 5278–6760 | 3600 | 1 | 11/14/2007 | 4418.75 | 3800–6800 | 4800 | 5 |
| 10/06/2004 | 3285.50 | 5278–6760 | 3600 | 1 | 11/15/2007 | 4419.76 | 3800–6800 | 4800 | 5 |
| 11/27/2004 | 3336.40 | 3600–8700 | 3600 | 3 | 11/19/2007 | 4423.76 | 3800–6800 | 4800 | 5 |
| 12/26/2004 | 3365.62 | 5400–6700 | 2700 | 4 | 10/04/2008 | 4743.88 | 3800–6800 | 3600 | 5 |
| 10/09/2005 | 3653.80 | 4300–6800 | 3600 | 5 | 10/05/2008 | 4744.78 | 3800–6800 | 3600 | 5 |
| 10/12/2005 | 3655.88 | 4300–6800 | 3600 | 5 | 10/07/2008 | 4746.77 | 3800–6800 | 6000 | 5 |
| 11/11/2005 | 3686.38 | 4015–5460 | 3600 | 1 | 10/09/2008 | 4748.79 | 3800–6800 | 4800 | 5 |
| 11/14/2005 | 3689.34 | 5278–6760 | 3600 | 1 | 10/10/2008 | 4749.82 | 3800–6800 | 4800 | 5 |
| 12/19/2005 | 3723.60 | 3600–10500 | 6000 | 6 | 10/11/2008 | 4750.74 | 3800–6800 | 4800 | 5 |
| 12/13/2006 | 4082.72 | 3800–6800 | 3600 | 5 | 12/13/2008 | 4812.64 | 3600–10500 | 4800 | 6 |
| 12/14/2006 | 4083.70 | 3800–6800 | 4800 | 5 | 12/14/2008 | 4813.67 | 3600–10500 | 3600 | 6 |
| 12/16/2006 | 4085.73 | 3800–6800 | 3600 | 5 |
| Line | 08/14/2003 | 03/09/2004 | 10/06/2004 | 11/11/2005 | |||||
|---|---|---|---|---|---|---|---|---|---|
| Å | |||||||||
| H | 4101.74 | 0.18/1.44 | -140:/45: | ||||||
| TiII(105) | 4171.90 | 0.90/1.08 | |||||||
| FeII(27) | 4173.46 | ||||||||
| FeII(21) | 4177.68 | 0.87/1.10 | |||||||
| FeII(28) | 4178.85 | ||||||||
| FeII(27) | 4233.17 | 0.76/1.50 | -150/-23: | ||||||
| ScII(7) | 4246.82 | ||||||||
| TiII(41) | 4290.21 | 0.85/1.08 | -162:/-46: | ||||||
| TiII(20) | 4294.10 | 0.88/1.10 | -150:/ - | ||||||
| FeII(98) | 4296.57 | 0.92/1.05 | -140:/-58: | ||||||
| TiII(41) | 4300.04 | 0.85/1.18 | -150/-50 | ||||||
| FeII(27) | 4303.17 | - /1.16 | - /-54 | ||||||
| TiII(41) | 4307.89 | 0.90/1.18 | -165:/-60: | ||||||
| TiII(41) | 4312.86 | 0.82/ - | -150:/ - | ||||||
| ScII(15) | 4314.08 | - /1.10 | - /-40: | ||||||
| FeII(32) | 4314.30 | ||||||||
| H | 4340.47 | 0.08/2.08 | -162/33 | ||||||
| FeII(27) | 4351.77 | 0.83/1.35 | -160/-45 | ||||||
| TiII(104) | 4367.65 | 0.90/1.03 | -120:/-34: | ||||||
| FeII(27) | 4385.38 | - /1.20 | - /-49: | ||||||
| TiII(19) | 4395.03 | 0.82/1.25 | -160/-43 | ||||||
| TiII(51) | 4399.77 | 0.94/1.14 | -145:/-40: | ||||||
| FeII(27) | 4416.82 | 0.90/1.20 | |||||||
| TiII(40) | 4417.72 | ||||||||
| TiII(51) | 4418.33 | ||||||||
| TiII(19) | 4443.80 | 0.90/1.22 | -162:/-40 | ||||||
| TiII(31) | 4468.49 | 0.92/1.32 | -160/-41 | ||||||
| FeII(37) | 4472.92 | 0.87/1.09 | -130:/-54: | ||||||
| MgII(4) | 4481.22 | 0.84 | -35 | ||||||
| FeII(37) | 4489.17 | 0.92/1.08 | -144:/-70: | ||||||
| FeII(37) | 4491.40 | - /1.10 | - /-60: | ||||||
| TiII(31) | 4501.27 | 0.90/1.17 | -160:/-50 | ||||||
| FeII(38) | 4508.28 | 0.90/1.30 | -158/-41 | ||||||
| FeII(37) | 4515.33 | 0.90/1.27 | -157/-43 | ||||||
| FeII(37) | 4520.22 | 0.92/1.18 | -159:/-53: | ||||||
| FeII(38) | 4522.63 | 0.87/1.33 | - /-41 | ||||||
| TiII(82) | 4529.48 | 0.92/1.03 | |||||||
| TiII(50) | 4534.02 | 0.84/1.25 | -165/-47: | ||||||
| FeII(37) | |||||||||
| FeII(38) | 4541.51 | 0.91/1.10 | -161:/-43: | ||||||
| FeII(38) | 4549.54 | 0.68/1.55 | -160/-34 | ||||||
| TiII(82) | |||||||||
| FeII(37) | 4555.89 | 0.93/1.31 | -151:/-47: | ||||||
| CrII(44) | 4558.65 | ||||||||
| TiII(50) | 4563.76 | 0.89/1.17 | -161/-51 | ||||||
| TiII(82) | 4571.97 | 0.83/1.24 | -168:/-40 | ||||||
| FeII(38) | 4576.33 | 0.90/1.03 | - /-63: | ||||||
| FeII(37) | 4582.83 | ||||||||
| FeII(38) | 4583.83 | 0.74/1.60 | -157/-36 | ||||||
| CrII(44) | 4588.20 | 0.90/1.09 | - /-58: | ||||||
| CrII(44) | 4589.89 | ||||||||
| TiII(50) | 4589.95 | ||||||||
| CrII(44) | 4618.82 | 0.96/1.10 | |||||||
| FeII(38) | 4620.51 | ||||||||
| FeII(37) | 4629.33 | 0.93/1.36 | -154/-43 | ||||||
| CrII(44) | 4634.07 | 0.95/1.14 | |||||||
| FeII(186) | 4635.31 | ||||||||
| DIB | 4726.27 | ||||||||
| FeII(43) | 4731.47 | 0.94/1.06 | -165:/-27: | ||||||
| DIB | 4762.67 | ||||||||
| TiII(17) | 4762.78 | ||||||||
| TiII(48) | 4763.89 | 0.91/ - | |||||||
| TiII(48) | 4764.53 | ||||||||
| CrII(30) | 4824.14 | 0.93/1.09 | -157:/-55: | ||||||
| CrII(30) | 4848.25 | 0.94/1.12 | -165:/-55: | ||||||
| H | 4861.33 | 0.90: | -380: | ||||||
| 0.17/3.90 | -175/36 | ||||||||
| TiII(114) | 4911.19 | 0.91/ - | |||||||
| FeII(42) | 4923.92 | 0.86 | -240 | ||||||
| 0.52/1.86 | -155/-26 | ||||||||
| OI(14) | 4967.38 | ||||||||
| OI(14) | 4967.88 | 0.94 | |||||||
| OI(14) | 4968.79 | ||||||||
| FeII(42) | 5018.44 | 0.76 | -235 | ||||||
| 0.43/2.02 | -158/-23 | ||||||||
| SiII(5) | 5056.02 | ||||||||
| FeII(167) | 5127.86 | ||||||||
| TiII(86) | 5129.16 | 0.96/1.02 | -170:/-45: | ||||||
| Line | 08/14/2003 | 03/09/2004 | 10/06/2004 | 11/11/2005 | |||||
|---|---|---|---|---|---|---|---|---|---|
| Å | |||||||||
| FeII(35) | 5132.66 | 0.96/1.03 | - /-49: | ||||||
| FeII(35) | 5146.11 | 0.95/1.02 | |||||||
| TiII(70) | 5154.07 | 0.95/1.03 | -161/-60: | ||||||
| FeII(42) | 5169.03 | 0.62 | -235 | ||||||
| 0.35/1.97 | -156/-21 | ||||||||
| MgI(2) | 5172.69 | ||||||||
| MgI(2) | 5183.61 | 0.95/1.16 | -170:/-54: | ||||||
| TiII(70) | 5188.68 | 0.97/1.13 | -140:/-60: | ||||||
| FeII(49) | 5197.58 | 0.95/1.38 | -162:/-50: | ||||||
| TiII(70) | 5226.54 | 0.95/1.12 | - /-50: | ||||||
| FeII(49) | 5234.62 | 0.94/1.37 | -147/-46 | ||||||
| FeII(49) | 5254.93 | 0.96/1.02 | |||||||
| FeII(48) | 5264.80 | 0.95/- | -146:/ - | ||||||
| TiII(103) | 5268.63 | 0.95/1.02 | |||||||
| FeII(185) | 5272.40 | 0.93/1.02 | -135:/-50: | ||||||
| FeII(49) | 5276.00 | 0.92/1.38 | -174:/-44 | ||||||
| CrII(43) | 5279.88 | 0.92/ - | |||||||
| FeII(40) | 5284.10 | - /1.24 | - /-10: | 0.92/1.13 | -160/-37 | ||||
| FeII(49) | 5316.65 | 0.90/1.70 | -150:/-16 | 0.87/1.50: | -272/-42 | 0.96/1.85 | -200/-21 | 0.90/1.69 | -160/-41 |
| FeII(49) | 5325.56 | 0.95/ - | |||||||
| OI(12) | 5329.10 | ||||||||
| OI(12) | 5329.69 | 0.91 | |||||||
| OI(12) | 5330.74 | ||||||||
| FeII(48) | 5362.86 | 0.96/1.23 | -170:/-28 | 0.97:/1.16 | -270/-40 | 0.98/1.19 | -193:/-21: | 0.95/1.21 | -157:/-47 |
| DIB | 5404.50 | 0.92 | -8: | 0.95 | |||||
| FeII(49) | 5425.25 | 0.98/1.06 | -222/ - | ||||||
| FeII(55) | 5432.98 | ||||||||
| DIB | 5487.67 | ||||||||
| DIB | 5494.10 | ||||||||
| FeII(55) | 5534.84 | 0.97:1.09 | -165:/-51 | 0.97/1.12 | -195/-22: | ||||
| DIB | 5762.70 | ||||||||
| DIB | 5766.16 | ||||||||
| DIB | 5780.37 | 0.76 | -7: | 0.77: | -14: | 0.71 | -8: | ||
| DIB | 5796.96 | 0.79 | -9: | 0.80 | -13 | 0.80 | -14 | ||
| DIB | 5809.24 | ||||||||
| DIB | 5849.80 | 0.94: | -10: | 0.88 | -9: | ||||
| HeI(11) | 5875.72 | 1.12 | -127: | 1.14: | -67: | 1.17 | -96 | ||
| NaI(1) | 5889.95 | 0.80 | -180 | 0.71/1.12: | -263/-34 | 0.80 | -190 | ||
| 0.60/1.30 | -108/25: | 0.91/1.27 | -135/0 | ||||||
| 0.04 | -17 | 0.06 | -18 | 0.03 | -18 | ||||
| NaI(1) | 5895.92 | 0.92 | -175 | 0.87/1.15: | -225/-9: | 0.92 | -178 | ||
| 0.73/1.22 | -102/18: | 1.01/1.30 | -115:/3 | ||||||
| 0.03 | -17 | 0.06 | -18 | 0.04 | -17 | ||||
| FeII(46) | 5991.37 | ||||||||
| FeII(74) | 6147.74 | - /1.17 | - /1.12 | ||||||
| FeII(74) | 6149.25 | ||||||||
| DIB | 6195.96 | 0.87 | -12 | 0.86 | -15 | ||||
| DIB | 6203.08 | 0.88 | -20: | 0.91 | -16 | ||||
| FeII(74) | 6238.39 | ||||||||
| FeII(74) | 6239.95 | ||||||||
| FeII(74) | 6247.55 | 0.94/1.2 | -178:/-6 | - /1.17 | - /-14: | ||||
| DIB | 6269.75 | 0.86 | -14: | 0.88 | -8: | 0.89 | -11: | ||
| DIB | 6283.85 | 0.79 | -12: | 0.78 | -11: | 0.82 | -14: | ||
| 6300.30 | 1.40 | -42: | 1.28 | -38 | 1.30 | -37: | |||
| 6363.78 | 1.13 | -37: | 1.08 | -41 | 1.10 | -39 | |||
| DIB | 6375.95 | 0.92: | -12: | 0.86 | -12 | ||||
| DIB | 6379.29 | 0.77 | -16: | 0.79: | -13 | 0.79 | -18 | ||
| FeII(74) | 6416.93 | 0.96/1.05 | -143:/14 | ||||||
| FeII(40) | 6432.70 | 0.96/1.0 | -130:/-20: | -/1.07 | -/-38: | 0.97/1.07 | -155/-14 | ||
| FeII(74) | 6456.38 | 0.96/1.2 | -100:/-3 | 0.97/1.15 | -226/-30 | - /1.30 | - /-18 | ||
| FeII(40) | 6516.08 | - /1.2 | - /-15: | -/1.08: | -/-36: | - /1.19 | - /-25 | ||
| H | 6562.81 | 0.53 | -310 | 0.51/11.9 | -320/-13 | 0.60 | -540: | ||
| 0.53/16. | -220:/67 | 0.46/15.2 | -377/18 | ||||||
| DIB | 6613.56 | 0.75 | -16 | 0.77 | -13 | 0.78 | -15 | ||
| DIB | 6660.64 | 0.91 | -11: | ||||||
| HeI(46) | 6678.15 | ||||||||
| LiI(1) | 6707.80 | ||||||||
| FeII(73) | 7462.38 | ||||||||
| Pa 29 | 8292.31 | ||||||||
| Pa 20 | 8392.40 | ||||||||
| Pa 19 | 8413.31 | ||||||||
| CaII(2) | 8542.09 | ||||||||
| Pa 14 | 8598.39 | ||||||||
| DIB | 8620.00 | ||||||||
| NI(7) | 8629.24 | ||||||||
| Pa 12 | 8750.47 | ||||||||
| Pa 10 | 9014.91 | ||||||||
| Pa 9 | 9229.00 | ||||||||
| Pa 7 | 10049.40 | ||||||||
| Line | 11/14/2005 | 12/18/2005 | 12/27/2006 | 12/14/2008 | |||||
|---|---|---|---|---|---|---|---|---|---|
| Å | |||||||||
| H | 4101.74 | 0.26/1.45 | 251/35 | 0.14/1.37 | 173/54 | 0.14/1.45 | 311/19 | ||
| 0.40 | 421 | ||||||||
| TiII(105) | 4171.90 | ||||||||
| FeII(27) | 4173.46 | ||||||||
| FeII(21) | 4177.68 | ||||||||
| FeII(28) | 4178.85 | ||||||||
| FeII(27) | 4233.17 | 0.90/1.39 | 244/27 | /1.47 | /24: | /1.47 | /20 | ||
| ScII(7) | 4246.82 | 1.14 | 42: | 1.15 | 34: | 1.15 | 31 | ||
| TiII(41) | 4290.21 | ||||||||
| TiII(20) | 4294.10 | ||||||||
| FeII(98) | 4296.57 | ||||||||
| TiII(41) | 4300.04 | ||||||||
| FeII(27) | 4303.17 | ||||||||
| TiII(41) | 4307.89 | ||||||||
| TiII(41) | 4312.86 | ||||||||
| ScII(15) | 4314.08 | ||||||||
| FeII(32) | 4314.30 | ||||||||
| H | 4340.47 | 0.25/1.88 | 237/29 | 0.14/1.96 | 205/24 | 0.16/2.15 | 319/13 | ||
| 0.37 | 411 | ||||||||
| FeII(27) | 4351.77 | /1.43 | /37 | /1.42 | /33 | /1.41 | /41 | ||
| TiII(104) | 4367.65 | ||||||||
| FeII(27) | 4385.38 | ||||||||
| TiII(19) | 4395.03 | /1.29 | /30 | ||||||
| TiII(51) | 4399.77 | /1.13 | /36 | ||||||
| FeII(27) | 4416.82 | /1.20 | /17: | /1.22 | /29 | ||||
| TiII(40) | 4417.72 | ||||||||
| TiII(51) | 4418.33 | ||||||||
| TiII(19) | 4443.80 | /1.19 | /30 | /1.17 | /38 | /1.17 | /31 | ||
| TiII(31) | 4468.49 | /1.20 | /34 | /1.20 | /31 | /1.23 | /36 | ||
| FeII(37) | 4472.92 | ||||||||
| MgII(4) | 4481.22 | 0.86 | 29 | 0.85 | 28 | ||||
| FeII(37) | 4489.17 | ||||||||
| FeII(37) | 4491.40 | ||||||||
| TiII(31) | 4501.27 | ||||||||
| FeII(38) | 4508.28 | /1.22 | /44 | ||||||
| FeII(37) | 4515.33 | /1.21 | /44 | ||||||
| FeII(37) | 4520.22 | ||||||||
| FeII(38) | 4522.63 | ||||||||
| TiII(82) | 4529.48 | ||||||||
| TiII(50) | 4534.02 | /1.24 | /38 | ||||||
| FeII(37) | |||||||||
| FeII(38) | 4541.51 | ||||||||
| FeII(38) | 4549.54 | ||||||||
| TiII(82) | |||||||||
| FeII(37) | 4555.89 | ||||||||
| CrII(44) | 4558.65 | ||||||||
| TiII(50) | 4563.76 | ||||||||
| TiII(82) | 4571.97 | ||||||||
| FeII(38) | 4576.33 | ||||||||
| FeII(37) | 4582.83 | ||||||||
| FeII(38) | 4583.83 | ||||||||
| CrII(44) | 4588.20 | ||||||||
| CrII(44) | 4589.89 | ||||||||
| TiII(50) | 4589.95 | ||||||||
| CrII(44) | 4618.82 | ||||||||
| FeII(38) | 4620.51 | ||||||||
| FeII(37) | 4629.33 | ||||||||
| CrII(44) | 4634.07 | ||||||||
| FeII(186) | 4635.31 | ||||||||
| DIB | 4726.27 | ||||||||
| FeII(43) | 4731.47 | ||||||||
| DIB | 4762.67 | ||||||||
| TiII(17) | 4762.78 | ||||||||
| TiII(48) | 4763.89 | ||||||||
| TiII(48) | 4764.53 | ||||||||
| CrII(30) | 4824.14 | 1.11 | 31: | ||||||
| CrII(30) | 4848.25 | ||||||||
| H | 4861.33 | 1.09 | 859: | ||||||
| 0.28/3.33 | 285/39 | 0.23/3.30 | 237/37 | 0.16/3.26 | 321/8 | ||||
| TiII(114) | 4911.19 | ||||||||
| FeII(42) | 4923.92 | 0.91 | 440 | 0.61/1.73 | 152/2 | ||||
| 0.74/1.69 | 223/21 | 0.78/1.73 | 458/35 | ||||||
| OI(14) | 4967.38 | ||||||||
| OI(14) | 4967.88 | ||||||||
| OI(14) | 4968.79 | ||||||||
| FeII(42) | 5018.44 | ||||||||
| 0.77/1.98 | 219/21 | 0.78/1.98 | 205/18 | 0.67/2.04 | 471/35 | ||||
| Line | 11/14/2005 | 12/18/2005 | 12/27/2006 | 12/14/2008 | |||||
|---|---|---|---|---|---|---|---|---|---|
| Å | |||||||||
| SiII(5) | 5056.02 | 0.95 | 22 | 0.95 | 23 | ||||
| FeII(167) | 5127.86 | ||||||||
| TiII(86) | 5129.16 | ||||||||
| FeII(35) | 5132.66 | ||||||||
| FeII(35) | 5146.11 | ||||||||
| TiII(70) | 5154.07 | ||||||||
| FeII(42) | 5169.03 | 0.83 | 360 | 0.90: | 461 | ||||
| 0.75/1.95 | 230/27 | 0.67/1.85 | 155/16 | /2.03 | /35 | ||||
| MgI(2) | 5172.69 | 1.16 | 35 | ||||||
| MgI(2) | 5183.61 | /1.16 | /36 | /1.13 | /30 | /1.21 | /28 | ||
| TiII(70) | 5188.68 | /1.06 | /41 | /1.07 | /55: | ||||
| FeII(49) | 5197.58 | /1.33 | /38 | 0.95/1.34 | 327:/34 | 0.96/1.31 | 310/29 | ||
| TiII(70) | 5226.54 | /1.08 | /37 | ||||||
| FeII(49) | 5234.62 | /1.39 | /38 | ||||||
| FeII(49) | 5254.93 | ||||||||
| FeII(48) | 5264.80 | ||||||||
| TiII(103) | 5268.63 | ||||||||
| FeII(185) | 5272.40 | ||||||||
| FeII(49) | 5276.00 | 0.95/1.36 | 226/42 | /1.36 | /35 | /1.35 | /39 | ||
| CrII(43) | 5279.88 | ||||||||
| FeII(40) | 5284.10 | /1.10 | /38 | /1.08 | /37 | /1.11 | /38 | ||
| FeII(49) | 5316.65 | 0.93/1.64 | 191/33 | 0.94/1.61 | 235/39 | /1.74 | /34 | /1.54 | /41 |
| FeII(49) | 5325.56 | ||||||||
| OI(12) | 5329.10 | ||||||||
| OI(12) | 5329.69 | ||||||||
| OI(12) | 5330.74 | ||||||||
| FeII(48) | 5362.86 | 0.97/1.21 | 206:/35 | /1.18 | /36 | /1.19 | /36 | /1.20 | /42 |
| DIB | 5404.50 | 0.94 | 10: | ||||||
| FeII(49) | 5425.25 | /1.04 | /33 | ||||||
| FeII(55) | 5432.98 | 0.98/1.02 | 132:/40: | ||||||
| DIB | 5487.67 | 0.95 | 10: | ||||||
| DIB | 5494.10 | 0.93 | 18 | ||||||
| FeII(55) | 5534.84 | 0.97/1.14 | 215:/39 | ||||||
| DIB | 5762.70 | 0.97 | 20: | ||||||
| DIB | 5766.16 | 0.97 | 18: | ||||||
| DIB | 5780.37 | 0.77 | 10 | 0.79 | 16 | 0.78 | 9 | 0.78 | 8 |
| DIB | 5796.96 | 0.80 | 10 | 0.79 | 15: | 0.79 | 10: | 0.81 | 10 |
| DIB | 5809.24 | 0.96 | 17: | ||||||
| DIB | 5849.80 | 0.92 | 17: | 0.94 | 17 | 0.94 | 18 | ||
| HeI(11) | 5875.72 | 1.08 | 111 | 1.12 | 92 | 1.10 | 131 | 1.08 | 119 |
| NaI(1) | 5889.95 | 0.47 | 195 | 0.72 | 247 | 0.76/0.83 | 473/309 | ||
| 0.64/1.22 | 155/17 | 0.65/0.92 | 221/137 | 0.63/0.56 | 156/91 | 0.73/0.68 | 222/126 | ||
| 0.02 | 18 | 0.10/0.11 | -20/-4 | 0.03/0.01 | 23/6 | 0.00/0.01 | 19/4 | ||
| NaI(1) | 5895.92 | 0.63 | 196 | 0.84 | 237 | ||||
| 0.80/1.17 | 150:/14 | 0.83/0.97 | 224/130 | 0.77/0.63 | 162/93 | 0.68 | 126 | ||
| 0.03 | 18 | 0.08/0.10 | 19/5 | 0.03/0.01 | 20/5 | /0.03 | /17 | ||
| FeII(46) | 5991.37 | /1.08 | /46: | ||||||
| FeII(74) | 6147.74 | 0.96/1.10 | |||||||
| FeII(74) | 6149.25 | ||||||||
| DIB | 6195.96 | 0.86 | 13 | 0.92 | 15 | 0.88 | 15 | ||
| DIB | 6203.08 | 0.89 | 12 | 0.89 | 16 | 0.91 | 25 | ||
| FeII(74) | 6238.39 | 0.97/1.10 | 218:/38: | /1.07 | /35 | ||||
| FeII(74) | 6239.95 | ||||||||
| FeII(74) | 6247.55 | 0.97/1.21 | 203:/27 | 0.97/1.15 | 220:/29 | /1.18 | /26 | ||
| DIB | 6269.75 | 0.90 | 13 | 0.90 | 13 | 0.90 | 13 | ||
| DIB | 6283.85 | 0.76 | 9: | ||||||
| 6300.30 | 1.24 | 38 | 1.31 | 35 | 1.31 | 35 | |||
| 6363.78 | 1.07 | 40 | 1.07 | 44 | 1.10 | 41 | 1.09 | 43 | |
| 1.32 | 0 | ||||||||
| DIB | 6375.95 | 0.91 | 16: | 0.94 | 10 | ||||
| DIB | 6379.29 | 0.81 | 15 | 0.81 | 16 | 0.84 | 13 | ||
| FeII(74) | 6416.93 | 0.97/1.08 | /29: | ||||||
| FeII(40) | 6432.70 | 0.97/1.09 | 167:/38 | /1.11 | /28 | ||||
| FeII(74) | 6456.38 | 0.96/1.24 | 212/29 | 0.97/1.24 | 321/17 | ||||
| FeII(40) | 6516.08 | ||||||||
| H | 6562.81 | 1.07 | 376 | ||||||
| 0.47 | 256 | 0.44 | 270 | 0.46 | 275 | 0.84/0.33 | 657/326 | ||
| 0.80:/14.2 | 155:/27 | 10.8 | 26 | 13.4 | 35 | 12.9 | 2 | ||
| DIB | 6613.56 | 0.78 | 15 | 0.79 | 17 | 0.78 | 16 | 0.79 | 15 |
| DIB | 6660.64 | 0.91 | 12 | ||||||
| LiI(1) | 6707.80 | 0.97 | 4 | 0.97 | 14 | ||||
| HeI(46) | 6678.15 | 1.05 | 137 | 1.03 | 106 | ||||
| FeII(73) | 7462.38 | 1.04 | 33 | 1.05 | 33 | ||||
| Pa 29 | 8292.31 | 1.02 | 59 | ||||||
| Pa 20 | 8392.40 | 1.21 | 39 | 1.24 | 39 | 1.22 | 48 | ||
| Pa 19 | 8413.31 | 1.24 | 29 | 1.23 | 37 | 1.22 | 41 | ||
| CaII(2) | 8542.09 | 3.21 | 32 | 2.72 | 17 | 3.73 | 26 | ||
| Pa 14 | 8598.39 | 1.43 | 45 | 1.47 | 35 | 1.43 | 42 | ||
| Line | 11/14/2005 | 12/18/2005 | 12/27/2006 | 12/14/2008 | |||||
|---|---|---|---|---|---|---|---|---|---|
| Å | |||||||||
| DIB | 8620.50 | 0.96 | 10: | 0.96 | 10: | ||||
| NI(7) | 8629.24 | 1.11 | 48 | ||||||
| Pa 12 | 8750.47 | 1.57 | 35 | 1.54 | 39 | ||||
| Pa 10 | 9014.91 | 1.50 | 30 | ||||||
| Pa 9 | 9229.00 | 1.52 | 35 | ||||||
| Pa 7 | 10049.40 | 1.88 | 48 | 1.93 | 20 | 2.00 | 31 | ||
| Object | Sp.T. | Date | Tel. | D | (km s-1) | |||
|---|---|---|---|---|---|---|---|---|
| H I | Na I(IS) | DIB | ||||||
| Hiltner 62 | B3 III | 0.5 | 03/07/1999 | SAO | 2.3 | 4 | 62/14 | 13 |
| HD 4841 | B5 Ia | 1.0 | 08/11/2006 | SAO | 2.4 | 35 | 58/36/12 | 11 |
| HD 4694 | B3 Ib⋆ | 0.1 | 12/04/2006 | SAO | 2.2 | 64/14 | 13 | |
| HD 4694 | B3 Ib | 0.1 | 12/27/2006 | McD | 2.2 | 50 | 65/13 | 14 |
| BD +6387 | B0.5 IV | 0.7 | 10/04/2008 | SPM | 2.1 | 86 | 18 | 18 |
| BD +63102 | B1 III⋆ | 0.2 | 10/09/2008 | SPM | 2.4 | 33 | 63/13 | 16 |
| Hiltner 74 | B2 V | 0.3 | 12/13/2008 | McD | 2.3 | 16 | 15 | |
| Line | Rem. | Line | Rem. | ||
|---|---|---|---|---|---|
| Å | ID | Å | ID | ||
| 9997.00 | Fe II | 15191.8 | Br 20 | ||
| 10049.4 | Pa 7 | 15260.5 | Br 19 | ||
| 10121.7 | Ca I | weak | 15341.8 | Br 18 | |
| 10455.4 | Fe II | 15387.7 | Ca I | ||
| 10499.3 | Fe II | 15438.9 | Br 17 | ||
| 10686.5 | Fe II | 15556.5 | Br 16 | ||
| 10830.3 | He I | emis/abs | 16109.3 | Br 13 | |
| 10938.1 | Pa 6 | 16407.2 | Br 12 | ||
| 11286.8 | O I | 16806.5 | Br 11 | ||
| 11748.8 | Ca I | 16873.2 | Fe II | weak | |
| 12818.1 | Pa 5 | 21655.3 | Br- |
| Observatory | Telescope | Filters | JD | N | Err. |
|---|---|---|---|---|---|
| 2450000+ | mag | ||||
| Los Alamos | 0.20–m | Clear | 1335–1571 | 180 | 0.02 |
| TSAO | 0.48–m | 2970–2974 | 2 | 0.03 | |
| Maidanak | 0.48–m | 3230–3654 | 24 | 0.02 | |
| LHO | 0.30–m | 3353–4779 | 140 | 0.02 | |
| SRO | 0.36–m | 4778–4831 | 18 | 0.02 | |
| Persbuhaugen | 0.35–m | 4098 | 47 | 0.01 | |
| Bossmo | 0.25–m | 4124 | 390 | 0.01 | |
| Bossmo | 0.25–m | Clear | 4460 | 282 | 0.01 |


|
|

|
|


|

|