Microscopic calculation of the phonon dynamics of Sr2RuO4 compared with La2CuO4
Abstract
The phonon dynamics of the low-temperature superconductor Sr2RuO4 is calculated quantitatively in linear response theory and compared with the structurally isomorphic high-temperature superconductor La2CuO4. Our calculation corrects for a typical deficit of LDA-based calculations which always predict a too large electronic -dispersion insufficient to describe the -axis response in the real materials. With a more realistic computation of the electronic band structure the frequency and wavevector dependent irreducible polarization part of the density response function is determined and used for adiabatic and nonadiabatic phonon calculations. Our analysis for Sr2RuO4 reveals important differences from the lattice dynamics of - and -doped cuprates. Consistent with experimental evidence from inelastic neutron scattering the anomalous doping related softening of the strongly coupling high-frequency oxygen bond-stretching modes (OBSM) which is generic for the cuprate superconductors is largely suppressed or completely absent, respectively, depending on the actual value of the on-site Coulomb repulsion of the Ru4d orbitals. Also the presence of a characteristic -mode with a very steep dispersion coupling strongly with the electrons is missing in Sr2RuO4. Moreover, we evaluate the possibility of a phonon-plasmon scenario for Sr2RuO4 which has been shown recently to be realistic for La2CuO4. In contrast to La2CuO4 in Sr2RuO4 the very low lying plasmons are overdamped along the -axis.
pacs:
74.25Kc, 63.20.Dj, 74.70Pq, 74.72.Dn1 Introduction
The discovery of superconductivity in Sr2RuO4 by Maeno and coworkers [1] has attracted widespread attention partially because of the structural similarity with the cuprate-based high-temperature superconductors (HTSC’s). While the mother compounds of the HTSC’s are charge transfer insulators, and they usually need to be doped to become metallic and show superconductivity, in Sr2RuO4 low-temperature superconductivity at = 1.5 K condenses from a metallic state that is a strongly two-dimensional Fermi liquid below about 20 K. The Fermi surface consists of three weakly corrugated cylindrical sheets being hole-like and and which are electon-like [2]. This is in contrast to La2CuO4 where only one Fermi sheet exists. The mechanism of conduction in Sr2RuO4 at higher temperatures is an interesting issue because the -axis resistivity shows a broad maximum at around 130 K and for increasing temperatures the resistivity starts to decrease. In [3] such a metallic to nonmetallic crossover in the -axis resistivity of a highly anisotropic metal like Sr2RuO4 with no corresponding feature in the -plane properties has been related to the strong coupling between the electrons and a bosonic mode propagating and polarized in -direction, like the axial oxygen breathing mode , at the point of the Brillouin zone (BZ) to be discussed in section 3.
Superconductivity in Sr2RuO4 is thought to be of unconventional character and thus is intensively discussed in the literature. The current state of the experiments points to triplet superconductivity in Sr2RuO4 in contrast to the -wave singlet pairing in the HTSC’s. Most discussion of the superconducting mechanism for Sr2RuO4 is focussed on magnetic fluctuations and Coulomb repulsion, for a review see [4]. However, a contribution of electron-phonon interaction (EPI) to pairing may not be ruled out because the superconducting transition exhibits a clear isotope effect [5]. In case of the HTSC’s there is increasing evidence that EPI is strong and phonons might play an important role for the electron dynamics, see [6], [7] and references therein.
Thus, a detailed theoretical study of phonon dynamics in Sr2RuO4 and a comparison with the situation in the HTSC’s is desirable. The low-temperature superconductor Sr2RuO4 crystallizes in the K2NiF4 structure (I4/mmm) isostructural to the HTSC La2CuO4. An analysis and comparison of the lattice dynamics in both materials is the main intention of the present work. For this purpose we compute the phonon dynamics for Sr2RuO4 and oppose it with our earlier calculations for La2CuO4.
The most characteristic feature of phonon dynamics in the HTSC’s is the strong softening upon doping of the high-frequency oxygen bond-stretching modes (OBSM) which seems to be generic for - as well as -doped cuprates, see [6, 7, 8, 9]. The strong frequency renormalization and a related increase of the linewidths observed for these anomalous modes point to a strong coupling of the phonons to the charge dynamics. A discussion and theoretical investigations of these phonon anomalies are presented e.g. in [6, 7, 8, 10]. In agreement with inelastic neutron scattering [11] our calculations demonstrate that the typical OBSM phonon anomalies of the cuprates are not present in Sr2RuO4. Moreover the characteristic branch related to the strongly coupling mode in La2CuO4 is missing.
In order to achieve reliable results for the phonon modes propagating and polarized along the -axis a careful calculation of the proper polarization part of the density response function is crucial. This has already been shown for La2CuO4 in [12] where we have proven that the modes are highly sensitive with respect to the charge response perpendicular to the CuO plane. The large anisotropy of the electronic structure of the cuprates is as a rule considerably underestimated in DFT-LDA calculations and as a consequence the modes are not well described. So we have modified a LDA-based calculation for La2CuO4 to account for the much weaker -dispersion of the electronic bandstructure in the real material.
We have optimized the interlayer coupling in such a way that the significant features of the sensitive phonons are well described. The same route is followed in the present work for Sr2RuO4 to get a realistic representation of the modes and in particular of which cannot be described in the ionic shell-model taking additionally homogeneous electron gas screening into account [11].
Finally, we investigate the question if there is room for a phonon-plasmon scenario around the -axis for Sr2RuO4 which has been shown to be a realistic option in La2CuO4 [12]. Due to the much weaker electronic -dispersion obtained in our computations as compared to La2CuO4, i.e. a much stronger anisotropy of Sr2RuO4, the calculated free-plasmon frequencies along the -axis are about a factor of eight smaller in the collisionless regime. Damping, generated by interactions between the electrons as well as interband transitions which are on a much lower energy scale as for La2CuO4 very likely leads to overdamping of the plasmons propagating strictly along the -axis in Sr2RuO4. Thus, different from La2CuO4 coupled -axis phonon-plasmon modes should not be well defined collective excitations at least strictly along the direction and accordingly do not enter the list of possible players for pairing in contrast to La2CuO4.
The article is organized as follows. In section 2 the theory necessary to understand the calculated results is shortly reviewed. Section 3 presents the calculations. The modification of a LDA-based electronic bandstructure providing the basis of the single particle content of the irreducible polarization part of the density response function is developed. Furthermore, the phonon dispersion is calculated in adiabatic approximation for Sr2RuO4 and a comparative discussion with the situation in La2CuO4 is given. Finally, in a nonadiabatic calculation the possibility of a phonon-plasmon scenario is examined. A summary of the paper is given in section 4 and the conclusions are drawn.
2 Theory and modeling
In the following a brief survey of the theory and modeling is presented. A detailed description can be found in [10] and in particular in [13] where the calculation of the coupling parameters of the theory is presented.
The local part of the electronic charge response and the EPI is approximated in the spirit of the quasi-ion approach [7, 14] by an ab initio rigid ion model (RIM) taking into account covalent ion softening in terms of (static) effective ionic charges calculated from a tight-binding analysis. The tight-binding analysis supplies these charges as extracted from the orbital occupation numbers of the (tight-binding) orbital in question:
| (1) |
stands for the -component of the eigenvector of band at the wavevector in the first BZ; the summation in (1) runs over all occupied states and gives the number of the elementary cells in the (periodic) crystal.
In addition, scaling of the short-ranged part of certain pair potentials between the ions is performed to simulate further covalence effects in the calculation in such a way that the energy-minimized structure is as close as possible to the experimental one [15]. Structure optimization and energy minimization is very important for a reliable calculation of the phonon dynamics through the dynamical matrix. Taking just the experimental structure data as is done in many cases in the literature may lead to uncontrolled errors in the phonon calculations.
The RIM with the corrections just mentioned then serves as an unbiased reference system for the description of the HTSC’s and can be considered as a first approximation for the insulating state of these compounds. Starting with such an unprejudiced rigid reference system non-rigid electronic polarization processes are introduced in form of more or less localized electronic charge-fluctuations (CF’s) at the outer shells of the ions. Especially in the metallic state of the HTSC’s the latter dominate the nonlocal contribution of the electronic density response and the EPI and are particularly important in the CuO planes and the RuO plane. In addition, anisotropic dipole-fluctuations (DF’s) are admitted in our approach [13, 16], which prove to be specifically of interest for the ions in the ionic layers mediating the dielectric coupling and for the polar modes. Thus, the basic variable of our model is the ionic density which is given in the perturbed state by
| (2) |
is the density of the unperturbed ion, as used in the RIM, localized at the sublattice of the crystal and moving rigidly with the latter under displacement. The and describe the amplitudes and the form-factors of the CF’s and the last term in equation (2) represents the dipolar deformation of an ion with amplitude (dipole moment) and a radial density distribution . denotes the unit vector in the direction of . The are approximated by a spherical average of the orbital densities of the ionic shells calculated in LDA taking self-interaction effects (SIC) into account. The dipole density is obtained from a modified Sternheimer method in the framework of LDA-SIC [13]. All SIC-calculations are performed for the average spherical shell in the orbital-averaged form according to Perdew and Zunger [17]. For the correlation part of the energy per electron the parametrization given in [17] has been used.
The total energy of the crystal is obtained by assuming that the density can be approximated by a superposition of overlapping densities . The in equation (2) are also calculated within LDA-SIC taking environment effects, via a Watson sphere potential and the calculated static effective charges of the ions into account. The Watson sphere method is only used for the oxygen ions and the depth of the Watson sphere potential is set as the Madelung potential at the corresponding site. Such an approximation holds well in the HTSC’s [15, 18]. Finally, applying the pair-potential approximation we get for the total energy:
| (3) |
The energy depends on both the configuration of the ions and the electronic (charge) degrees of freedom (EDF) of the charge density, i.e. and in equation (2). are the energies of the single ions. , denote the elementary cells and , the corresponding sublattices. The second term in equation (3) is the interaction energy of the system, expressed in terms of anisotropic pair-interactions . Both and in general depend upon via in equation (2).
The pair potentials in equation (3) can be seperated into long-ranged Coulomb contributions and short-ranged terms, for details see e.g. Ref [13].
The dynamical matrix in harmonic approximation can be derived as
| (4) | |||||
The first term on the right hand side denotes the contribution from the RIM. , are the masses of the ions and is a wave vector from the first BZ.
The quantities and in equation (4) represent the Fourier transforms of the electronic coupling coefficients and are calculated from the energy in equation (3), i.e.
| (5) | |||||
| (6) |
denotes the EDF (CF and DF in the present model, see equation (2)) in an elementary cell. The coefficients describe the coupling between the EDF and the displaced ions (bare electron-phonon coupling), and the coefficients determine the interaction between the EDF. The phonon frequencies and the corresponding eigenvectors of the modes are obtained from the secular equation for the dynamical matrix in equation (4), i.e.
| (7) |
The Eqs. (4)-(7) are generally valid and, in particular, are independent of the specific model for the decomposition of the perturbed density in equation (2) and the pair approximation in equation (3) for the energy. The lenghty details of the calculation of the coupling coefficients and cannot be reviewed in this paper. They are presented in [13]. In this context we remark that the coupling matrix of the EDF-EDF interaction, whose inverse appears in equation (4) for the dynamical matrix, can be written in matrix notation as
| (8) |
is the inverse of the irreducible (proper) polarization part of the density response function (matrix) and contains the kinetic part to the interaction while embodies the Hartree and exchange-correlation contribution. needed for the dynamical matrix and the EPI is closely related to the (linear) density response function (matrix) and to the inverse dielectric function (matrix) , respectively.
Only very few attempts have been made to calculate the phonon dispersion and the EPI of the HTSC’s using the linear response method in form of density functional perturbation theory (DFPT) within LDA [19, 20, 21, 22]. These calculations correspond to calculating and in DFT-LDA and for the metallic state only. On the other hand, in our microscopic modeling DFT-LDA-SIC calculations are performed for the various densities in equation (2) in order to obtain the coupling coefficients and . Including SIC is particularly important for localized orbitals like Cu3d in the HTSC’s. Our theoretical results for the phonon dispersion [6, 8, 16], which compare well with the experiments, demonstrate that the approximative calculation of the coupling coefficients in our approach is sufficient, even for the localized Cu3d states. Written in matrix notation we get for the density response matrix the relation
| (9) |
The CF-CF submatrix of the matrix can approximatively be calculated for the metallic (but not for the undoped and underdoped) state of the HTSC’s from a TBA of a single particle electronic bandstructure. In this case the electronic polarizability in tight-binding representation reads:
| (10) | |||||
, and in equation (10) are the occupation numbers, the single-particle energies and the expansion coefficientes of the Bloch-functions in terms of tight-binding functions.
The self-consistent change of an EDF at an ion induced by a phonon mode with frequency and eigenvector can be derived in the form
| (11) | |||||
with the displacement of the ions
| (12) | |||||
The self-consistent response per unit displacement of the EDF in equation (11) is calculated in linear response theory as:
| (13) |
The generalization for the quantity in Eqs. (8) and (9) needed for the kinetic part of the charge response in the nonadiabatic regime, where dynamical screening effects must be considered, can be achieved by adding to the differences of the single-particle energies in the denominator of the expression for in equation (10). Other possible nonadiabatic contributions to related to dynamical exchange-correlation effects and the phonons themselves are beyond the scope of the present approach. Using equation (9) for the dielectric matrix, , and the frequency-dependent version of the irreducible polarization part, , according to equation (10), the free-plasmon dispersion is obtained from the condition,
| (14) |
The coupled-mode frequencies of the phonons and the plasmons must be determined self-consistently from the secular equation (7) for the dynamical matrix which now contains the frequency implicitly via in the response function . Such a nonadiabatic approach is necessary for a description of the interlayer phonons and the charge-response within a small region around the -axis as performed in [6, 12] and in the present paper for Sr2RuO4.
3 Results and discussion
3.1 Modification of the LDA-based bandstructure for Sr2RuO4 and phonons
We shortly recall the construction of a modified LDA-based model for La2CuO4 which better describes the real anisotropy of the HTSC’s that as a rule is not correctly represented in LDA being generally too isotropic. In our effort to obtain a reliable description of the phonons polarized and propagating along the -axis of the cuprates [12] we have shown that these modes are highly sensitive with respect to details of the -axis coupling and thus a very accurate representation of the electronic -dispersion is needed. Typical LDA based computations lead to an overestimation of the -dispersion and give imprecise results for the modes.
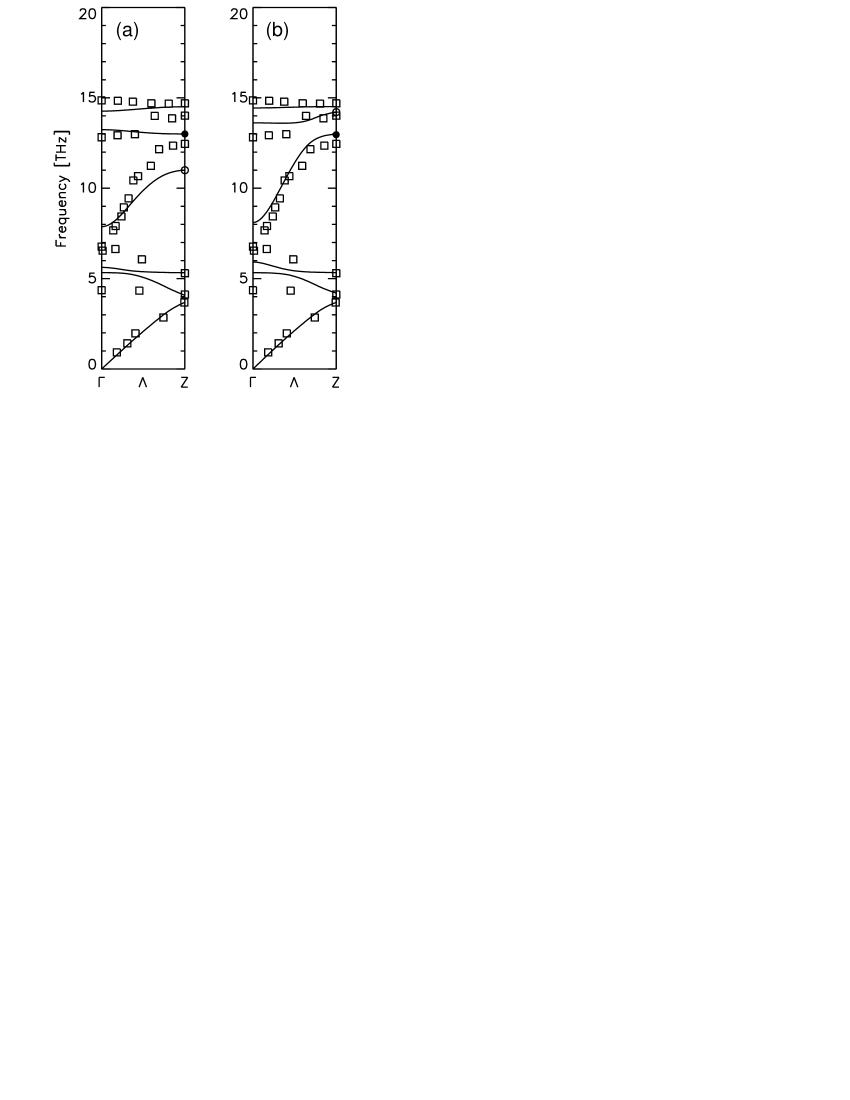
In figure 1 we illustrate the degree of inaccuracy for the phonons, in La2CuO4 as obtained in [12]. Figure 1(a) shows the result of an LDA-based tight-binding representation of the electronic bandstructure (31 band model, 31BM) and figure 1(b) gives the outcome of a modified bandstructure (M31BM) with reduced first neighbour -La parameters of the 31BM by 1/6 and of the first neighbour La-La parameters by 1/3. As seen from figure 1 this leads to a much better result for the phonon modes. The characteristic experimental features of the dispersion i.e. the step-like structure of the second highest branch and most significant the third highest branch with the steep dispersion towards the point are not well reflected by the calculation with the 31BM as input for the proper polarization part in equation (10). Using, however, the M31BM the calculated phonon dispersion is in good agreement with the experiment as can be seen in figure 1(b). The characteristic features are now well described.
We also find as a consequence of the increased anisotropy in the M31BM a rearrangement of the three point modes with the highest energy. While in the 31BM the strongly coupling mode is the second highest mode and the (ferro) mode the lowest one in the M31BM is the lowest and (ferro) the second highest of the three modes. Thus is the end point of the steep branch. During this mode rearrangement the frequency of stays nearly constant while that of (ferro) is strongly increased.
We have recalled these facts for La2CuO4 because for Sr2RuO4 a comparable high sensibility of the modes in dependence of the electronic -dispersion occurs and an analogous mode behaviour for and (ferro) results in response to a weaker -dispersion. Likewise as in La2CuO4 this sensitivity of certain -axis phonons is used to construct an accurate tight-binding description of the electronic bandstructure (BS) in Sr2RuO4.
As a first approximation for the BS we employ a tight-binding representation of the first principles linearized - augmented - plane-wave (LAPW) BS as obtained within the framework of DFT-LDA [23]. This analysis leads to a 27 band model (27BM) including Sr4d, Ru4d and O2p states.
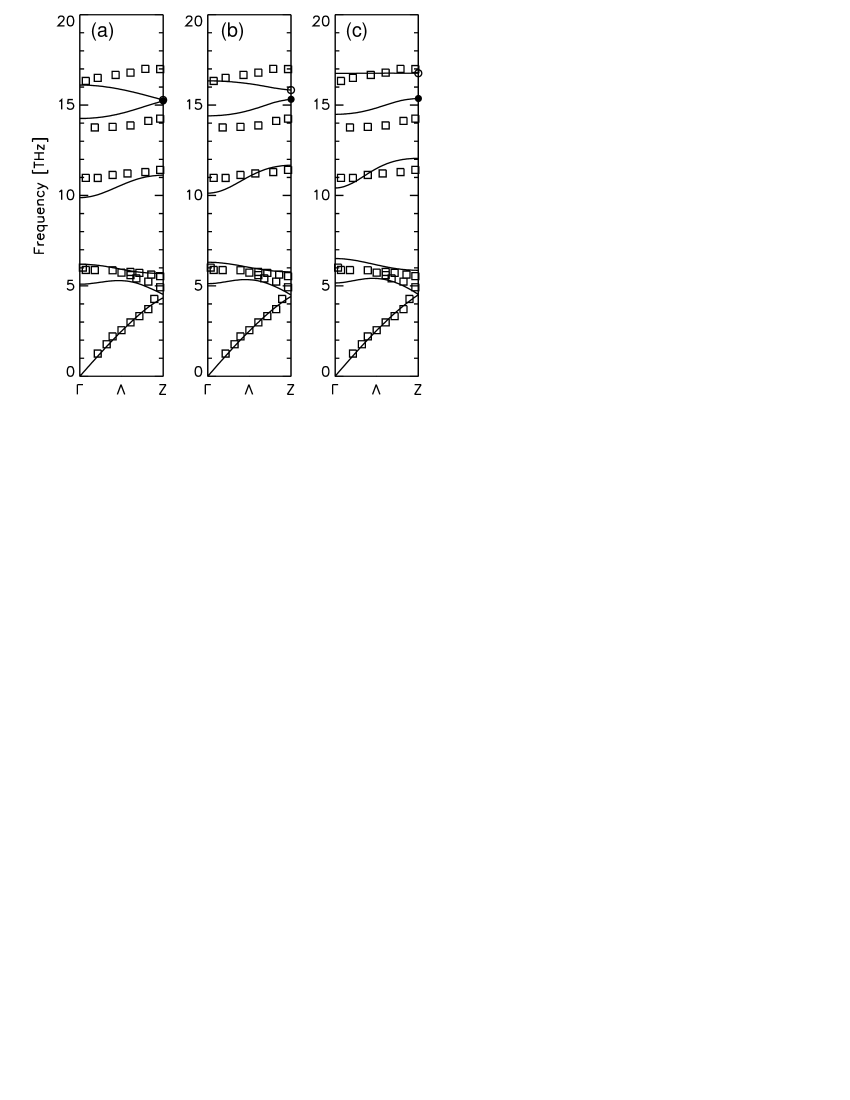
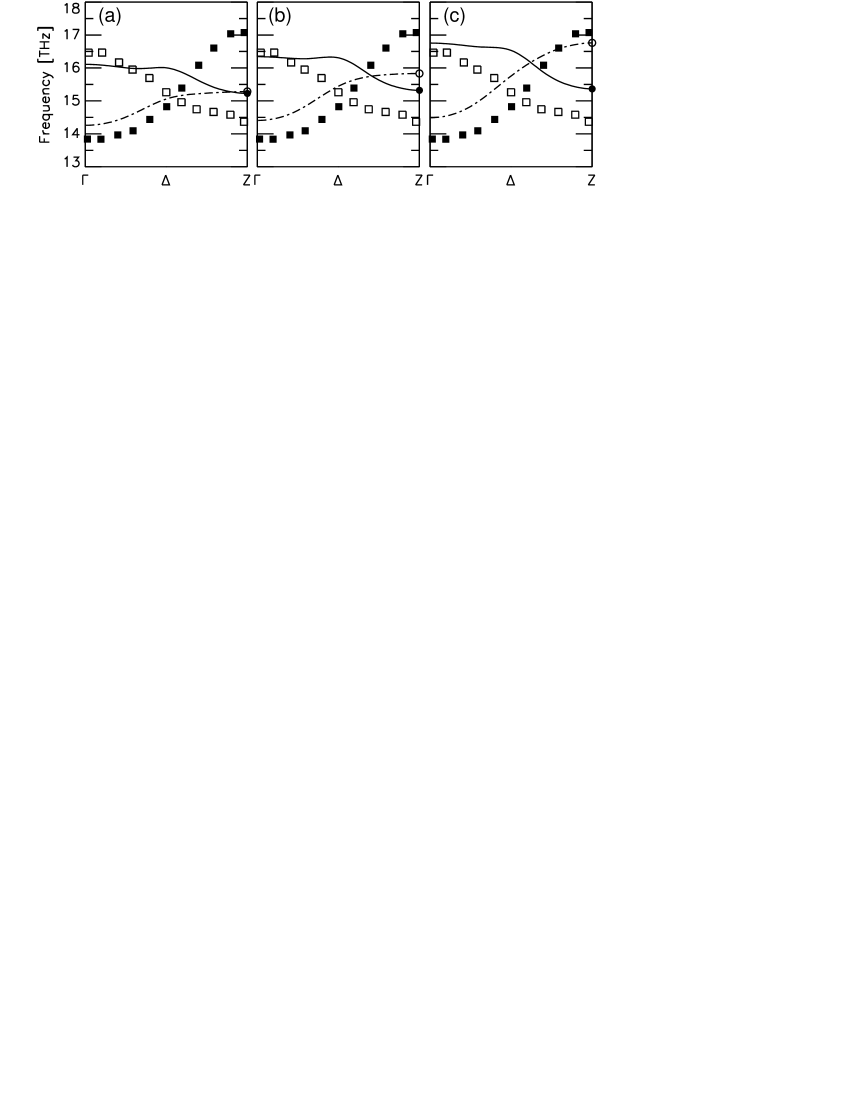
The associated calculated phonon dispersion for the modes of Sr2RuO4 along the direction is depicted in figure 2(a) and for the relevant and mode along the direction in figure 3(a) together with the experimental data points [11]. Figures 2(b), (c) and figures 3(b), (c), respectively, display our results for two modified 27 band models (M27BM1 and M27BM2) with the tight-binding parameters important for -axis is coupling (Oxy-Oz, Ru-Sr, Oxy-Sr, Ru-Oz) reduced by 1/2 and 1/5 with respect to the LDA-based 27BM. This leads as shown in figures 4(a)-(c) to a much stronger anisotropy as in the 27BM, i.e. to a strongly reduced -dispersion which is also much weaker than in La2CuO4 [12].
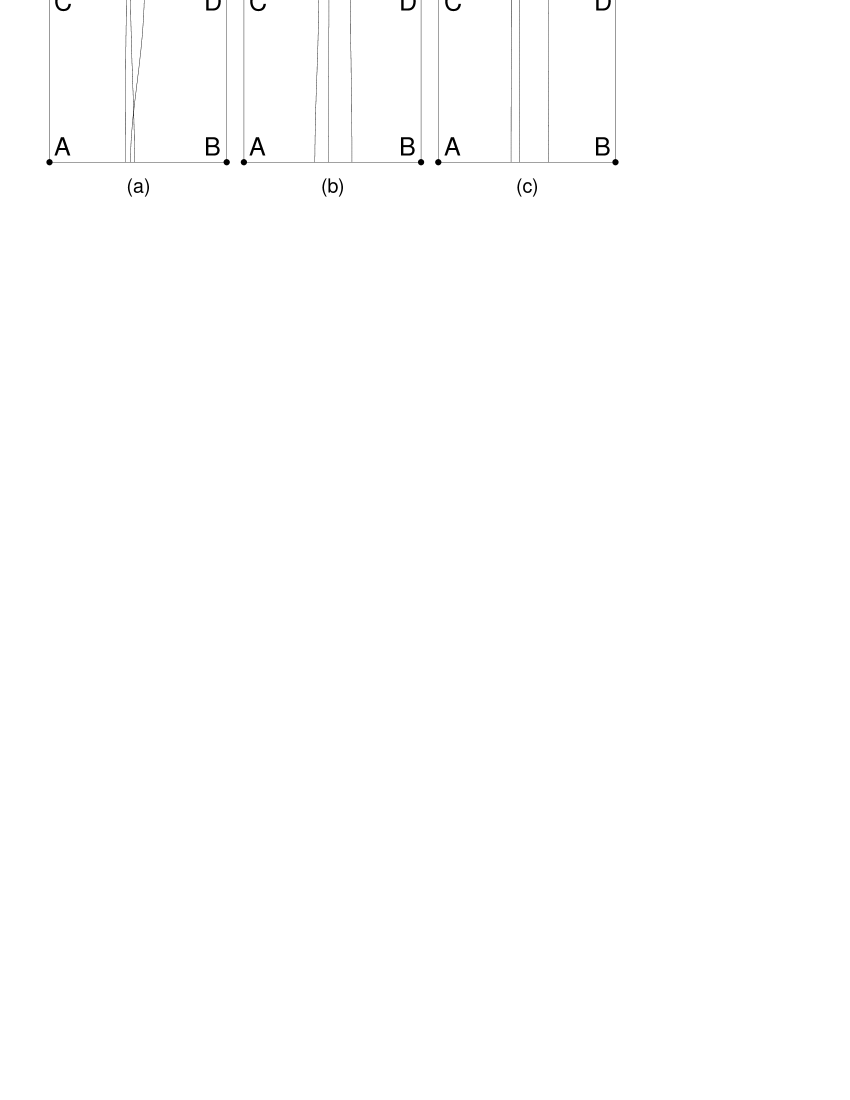
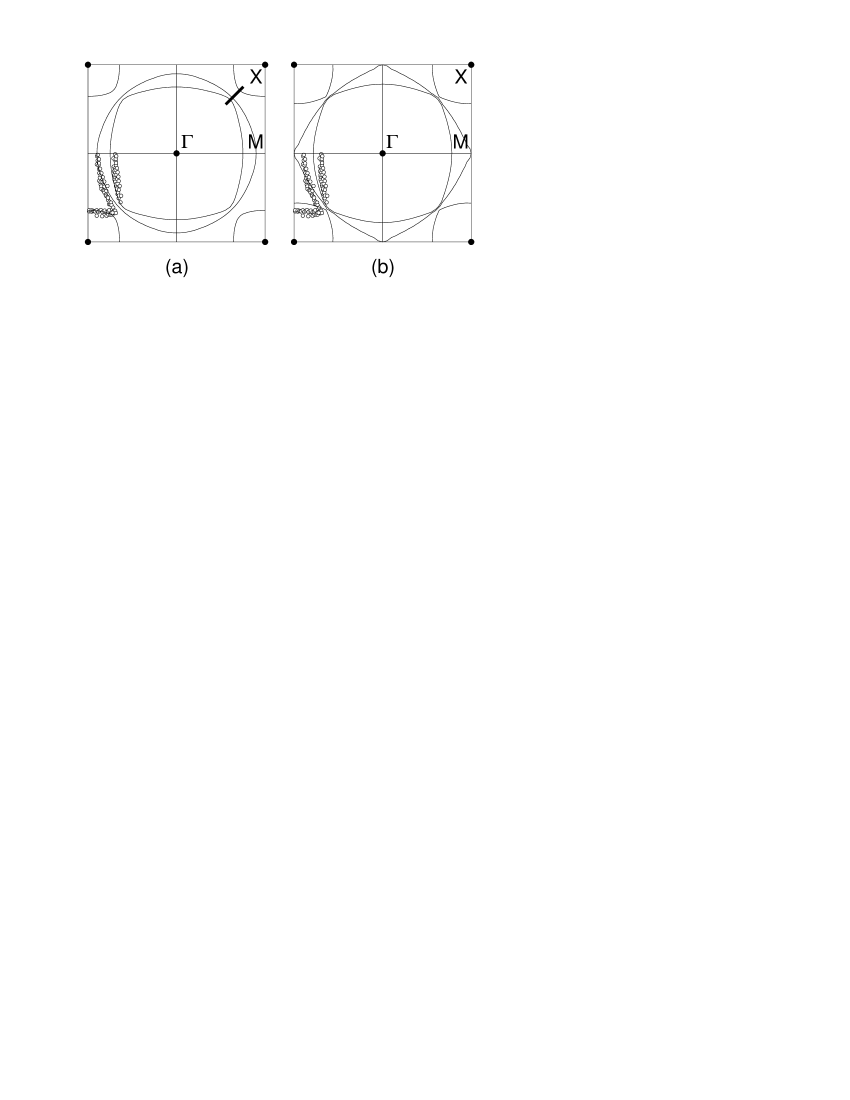
In figure 4 the reduction of the electronic -dispersion is shown along the cut of the Fermi surface (FS) highlighted in figure 5(a) when going from the 27BM to the most anisotropic M27BM2 via an intermediate -axis coupling in M27BM1. The best result for the phonon modes in figures 2 and 3, which are less well described in the 27BM, are obtained for the highly anisotropic M27BM2, i.e. a nearly two-dimensional BS reflected by an even considerably weaker -dispersion as in case of La2CuO4, see figure 6 and [12].
It is enlightening to point out that in context with the and branches in figure 3 an investigation of [11] exhibits that the dispersion cannot be described within a normal ionic shell model extended by homogeneous electron gas screening to simulate the metallic character of Sr2RuO4. Two specially adapted force constants between Ru-Oz and Ru-Oxy had to be introduced to mimic the observed dispersion. Of course these force constants do not have an intrinsic physical meaning. On the other hand, from our calculation we can conclude that on a microscopic level an accurate electronic dispersion along the -axis is essential to understand the observed mode behaviour.
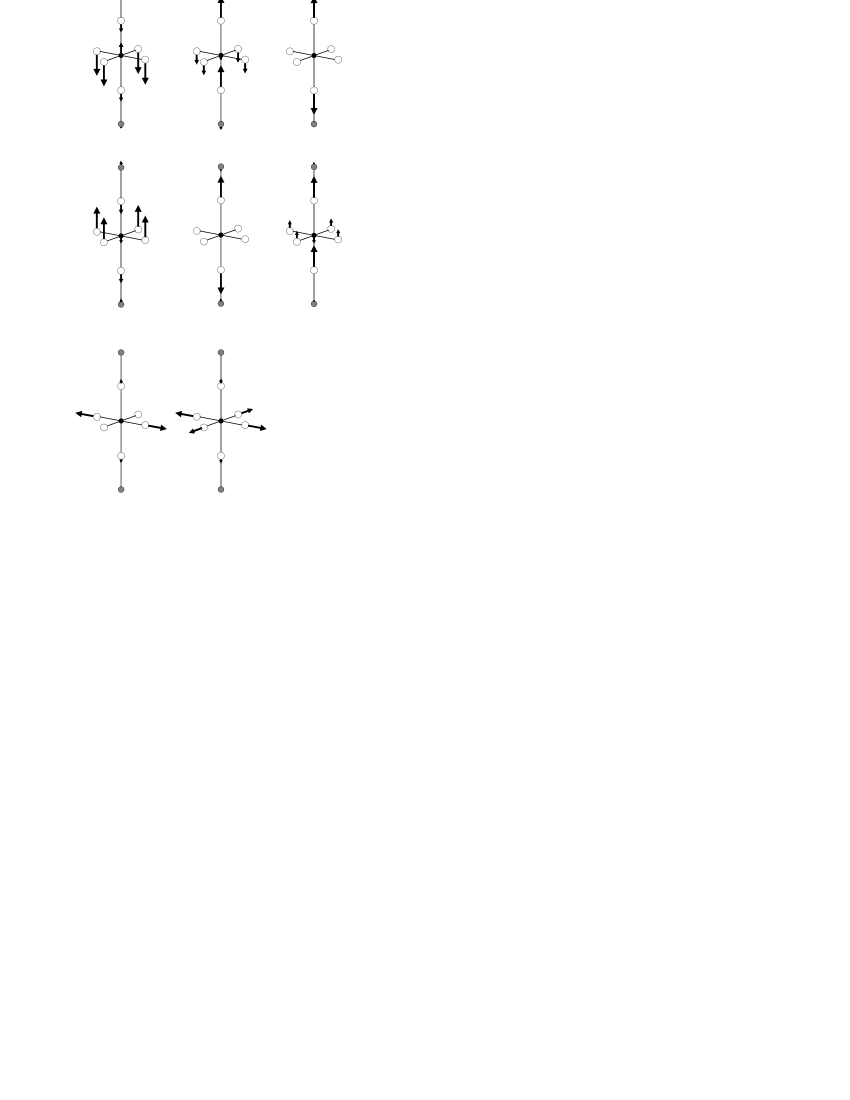
For a more detailed discussion of the rearrangement of the phonon modes in figures 2 and 3 as a result of a modification of the -dispersion of the BS it is useful to display in figure 7 the displacement patterns of some phonon modes relevant for our studies.
In the 27BM the frequency of is nearly degenerate with (ferro). We denote the latter mode as ”ferroelectric” because its displacement pattern looks similar to that of the ferro-like (ferro) mode at the -point, see figure 7. Here the oxygen anions vibrate coherently against the cations in the lattice and as a consequence the electric dipole moments generated by the motion add constructively. With decreasing -dispersion of the BS in M27BM1 and M27BM2 achieved by a reduction of the relevant tight-binding parameters mentioned above by 1/2 and 1/5, respectively, the frequency of (ferro) increases by about 2 THz while remains virtually unchanged. This highly sensible behaviour with regard to -axis coupling in Sr2RuO4 has also been demonstrated for La2CuO4 [12] where the frequency of (ferro) increases by more than 3 THz as can bee read off from figure 1.
-
O A(ferro) Ru4d Oxy2p Oz2p Sr4d Ru4d Oxy2p Oz2p Sr4d M27BM 26.98 7.62 0.02 0.49 0 0 3.22 0.34 27BM 27.34 6.43 0.63 3.57 0 0 9.19 4.69
The physical origin for the sensitivity derives from the fact that for symmetry reasons in case of (ferro) CF’s can be excited in the screening process only at the ions in the ionic layers, i.e. Oz, La in La2CuO4 and Oz, Sr in Sr2RuO4. The strength of these CF’s on the other hand is governed by the matrix elements of the proper polarization part in equation (10) of the corresponding out-of-plane ions and, thus, depends critically on the coupling along the -axis. Contrarily, the renormalization of is nearly exclusively given by the CF’s on the Ru4d and Oxy2p orbitals in the plane. For quantitative results compare with the CF’s listed in table 1. This explains the inertness of and the sensibility of (ferro) with respect to the change of the electronic -dispersion.
As a further example for the critical interrelation of -axis phonon dynamics and electronic -axis coupling we note that the steep branch connecting (ferro) with in La2CuO4 is missing in Sr2RuO4. In the latter case due to mode rearrangement (ferro) as the lowest of the three highest modes at is connected to that is the lowest of the three highest modes at and not to being the second highest mode.
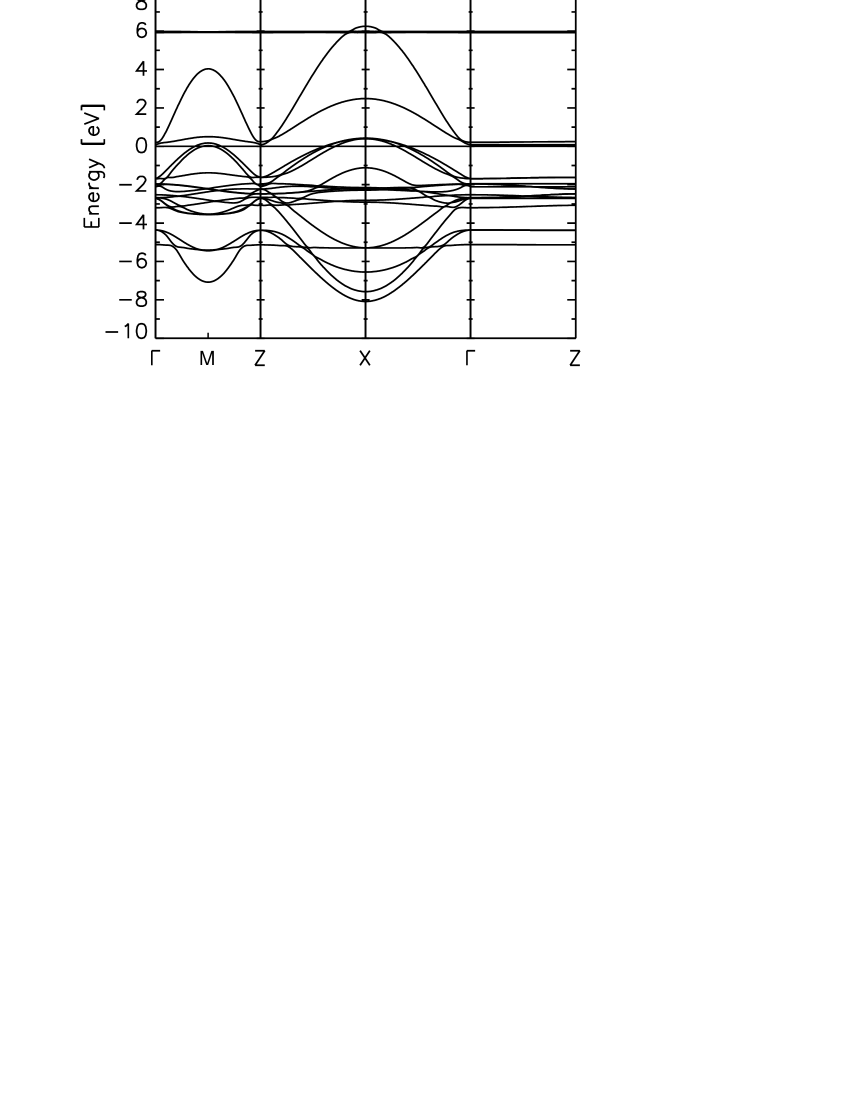
The BS underlying the M27BM2 is illustrated in figure 6. As already mentioned the dispersion of the bands along the () direction is extremely small, considerably smaller than for the 27BM and for the case of La2CuO4. Thus Sr2RuO4 is a nearly two-dimensional Fermi liquid. However, as our calculation in figures 2 and 3 have shown the remaining weak three-dimensionality is crucial to obtain a reliable description of certain -axis phonons and the -axis charge response in general.
Strong hybridization between Ru4d and Oxy2p states is evident from the BS in figure 6 because of the striking in-plane dispersion of the bands. Moreover, we find a similar shape of the partial density of states (PDOS) of the Ru4d and the Oxy2p orbitals around the Fermi energy . The states at are more strongly of Ru4d type with some admixture of Oxy2p. The contribution of Oz2p and Sr4d around is very small. In the M27BM2 we obtain for the PDOS at eV-1 , eV-1, eV-1 and eV-1.
There are qualitative differences concerning the origin of hybridization comparing Sr2RuO4 with La2CuO4. Hybridization in Sr2RuO4 is strongly favoured because the radial extent of the 4d wave functions in Ru is much larger than for the 3d wave functions in Cu. Concurrently this leads to a weaker influence of electron correlation effects, e.g. a smaller on-site Coulomb repulsion for Ru4d compared to Cu3d. In our calculations we find for (Cu3d) = 1.005 dRy and for (Ru4d) = 0.619 dRy. On the other hand, hybridization is promoted in La2CuO4 as compared to Sr2RuO4 because the energy levels of the copper and oxygen ions are close by in La2CuO4 but far off between ruthenium and oxygen in Sr2RuO4.
A further remarkable difference of the BS in Sr2RuO4 and La2CuO4 can be read off from figure 6 and the BS for La2CuO4 in [12]. In Sr2RuO4 up to three bands close to each other are crossing the Fermi level giving rise to a three-sheet FS while in La2CuO4 only one band is crossing and other bands are more far away. Thus we have a completely different situation as interband transitions are concerned which are on a much lower energy scale in Sr2RuO4 as in La2CuO4. So we find for with for at the point in case of Sr2RuO4 a minimum of 20.67 meV in the M27BM2 around , see also figure 6, while in La2CuO4 we obtain for the point at a minimum of 452.71 meV. This, of course, has important consequences for the contribution of the interband transitions to in equation (10) concerning magnitude as well as energy scale.
For example the low energy scale of the interband transitions in Sr2RuO4 can generate damping of possible plasmons already at very low energy. Such a damping already present in the collisionless regime together with additional damping due to interactions between the electrons very likely leads to overdamping of the very low lying plasmons in Sr2RuO4 along the -axis. The energy of the latter in the collisionless regime is only 5-6 meV along the direction as will be shown in section 3.3. Thus, the degree of the remaining weak three-dimensionality quantified by our computations is also very important for a possible existence of plasmons and coupled phonon-plasmon modes around the -axis. Such modes have been predicted for La2CuO4 in our recent calculations [12] which, however, is not so anisotropic as Sr2RuO4 and the plasmons along the -axis are at higher frequencies that overdamping can be avoided.
In figure 5(a) and (b), respectively, the calculated FS in the plane is shown for the M27BM2 and the 27BM, together with the experimental data points [24]. The FS consists of the sheets , , . The sheet is holelike and and are electronlike. The sheet is dominantly derived from the Ru4dxy orbitals, the and sheets are primarily related to the 4dxz and 4dyz orbitals of Ru which exhibit anticrossing behaviour along the zone diagonal. The large electronlike sheet passes right through the hybridization gap between the and sheets.
The experimental results are not well described by the 27BM in figure 5(b). In particular the crossing between the and sheet in the 27BM which is typical forLDA calculations is experimentally not reproduced. This is really a crossing and not an anticrossing as for the bands related to dxy and dxz/dyz oribitals have different symmetry and no mixing is allowed. On the other hand, our modified BS model M27BM2 in figure 5(a) is in good agreement with the experimental FS.
In order to obtain also a more global impression of the magnitude of the enhanced anisotropy in the M27BM2 as compared to the 27BM we compare some FS parameters being important for transport like the Drude plasma energy tensor and the Fermi velocity tensor. The Drude tensor ist defined as
| (15) |
and the Fermi velocity is given by
| (16) |
with
| (17) |
-
27BM 1045.94 65.50 6.63 0.88 15.97 7.53 M27BM2 1017.40 3.57 6.03 0.08 284.99 75.38 M31BM 648.60 25.25 2.99 0.11 25.69 27.18
The output of our calculation for the 27BM and the M27BM2 is given in table 2. As can be seen we obtain a large enhancement of the anisotropy ratio for the plasma frequencies and of the Fermi velocities by about a factor 18 and 10, respectively, in the M27BM2 as compared to the LDA-based 27BM.
3.2 Phonondynamics in Sr2RuO4 - Comparison with La2CuO4
In this section we investigate the phonon dynamics of Sr2RuO4 in the main symmetry directions , and and continue our discussion from section 3.1 of a comparison of important characteristica as found in our earlier calculations for La2CuO4.
For a definite investigation of the phonon renormalization induced by the nonlocal EPI effects of DF and CF type mediated by the second term in equation (4) a quantitative reference model for the calculation of the phonon dispersion not including the nonlocal screening effects but representing the important ionic component of binding in the material is needed. Such a model sketched in section 2 including approximately the local EPI effects is provided by the ab initio RIM extended via covalent ion softening and scaling of certain short-ranged pair potentials.

The result of the phonon dispersion along the main symmetry directions is shown for the RIM in figure 8 and compared with the experimental data from inelastic neutron scattering (INS) [11]. The static effective charges found for the model are Ru2.7+, O, O and Sr1.9+. In particular the charges of Ru and Oxy differ considerably from their nominal values Ru4+ and O2-. This is due to the strong hybridization of the Ru4d and Oxy2p states that reduces the amplitude of the static effective charges in a mixed ionic-covalent compound like Sr2RuO4 because of the charge transfer (CT) from the cations to the anions is not complete as in the entirely ionic case. Consistent with the result of the effective ionic charges is an enhanced covalent character of the Ru-Oxy plane with a dominant covalent scaling of the Ru-Oxy potential and a more ionic character of the Sr-Oz layer with an ionic scaling of the Sr-Oz potential as found in the calculations.
Altogether the RIM with these modifications yields good structural data for the energy-minimized configuration. In detail we get for the planar lattice constant , for the lattice constant along the -axis and for the internal position of the Oz and the Sr ion and . The experimental values at 15 K are , , , [25]. From these data we extract that the tetragonal distortion of the RuO6 octahedra is significantly smaller than for the CuO6 octahedra in La2CuO4. The ratio of the in-plane to out-of-plane distance of the oxygen is 0.9196 in Sr2RuO4 but 0.7706 in La2CuO4.
The phonon dispersion of the RIM is in reasonable agreement with the experiment as far as the branches with lower frequencies are concerned. This points to the importance of the ionic component of binding in this material. Large deviations are observed for the modes with higher frequencies. In particular the high-frequency OBSM , O and , see figure 7, are not well described. The corresponding frequencies are overestimated as compared with the full calculation including DF’s and CF’s by about 5.8 THz, 7.4 THz and 6.7 THz, respectively. This can be attributed according to our approach to the missing screening of the Coulomb interaction by DF’s and most importantly by CF’s.
Noticeable is the soft mode at the point and the very low frequency of the branch in the measurements (the notation for the irreducible representations characterizing the symmetry of the modes and is interchanged with the notation of [11]). This mode is associated with the rotation of RuO6 octahedra around the -axis. As indicated by our calculations the softness of the rotational mode can be considered as a precursor of a structural phase transition which in the meanwhile has been observed in the Ca2-xSrxRuO4 series [11]. From our calculation in the RIM this transition can be expected to be driven essentially by the strong component of the ionic forces in Sr2RuO4. Contrarily, Sr2RuO4 does not experience the tilt instability related to the branch at the point found in our calculations for La2CuO4. This instability correctly indicates the experimentally observed structural phase transition from the high-temperature tetragonal (HTT) to the low-temperature orthorhombic (LTO) structure. Also this transition is mainly brought about by the long-ranged ionic forces.
Substituting the smaller isovalent Ca ions for the Sr ions induces a misfit between the Ca and Ru ions and generates a close connection between the rotation of the RuO6 octahedra and the electronic and magnetic properties in the Ca2-xSrx RuO4 series [11]. Besides the softening of the rotational mode in the range around a similar structural transition occurs due to the softening of the RuO6 tilt mode [26]. In this context it is interesting that at in the paramagnetic phase of Ca1.5Sr0.5RuO4 the Fermi sheet gains a remarkable -dispersion and thus a more three-dimensional character than Sr2RuO4 [27]. This issue also emphasizes an interrelation between the electronic -dispersion and the RuO6 distortions.

In figure 9 we display the calculated results of the phonon dispersion admitting additionally to the RIM anisotropic DF’s. This leads to a better agreement of the dispersion curves with the inelastic neutron results. Checking these calculations against the RIM the width of the spectrum is reduced towards the experiment. The frequencies of the transverse and longitudinal optical modes polarized in the plane are decreased by the DF’s and thereby the largest LO-TO splitting is reduced at the -point from 8.8 THz in the RIM to 6.3 THz when dipolar polarization processes are included. At the same time the frequencies of the modes at and are lowered considerably by the DF’s in -direction and the large splitting of the (ferro) mode of 10.13 THz in the RIM is reduced to 8.85 THz.

The high-frequency OBSM , and are also decreased due to the screening by the DF’s but are still overestimated by about 3.9 THz, 5.1 THz and 4 THz as compared with the full calculation displayed in figure 10 including additionally CF’s. Thus, the softening of these modes compared with the RIM is of the order 2-3 THz and the remaining effect of the renormalization can be assigned to the CF’s on the Ru4d and Oxy2p orbitals.
-
Ru4d Ox2p Oy2p Oz2p Sr4d 38.252 0 4.472 -0.002 0 O 50.875 0 0 0.119 0.081 O 26.984 7.621 7.621 0.022 0.486 O 12.521 -3.714 -3.714 -2.224 -0.319
The quantitative results for the CF’s according to equation (11) are listed for the OBSM in table 3. The CF’s for are also given in the table which prove to be very different from those of despite the same local displacement pattern. As can be extracted from figure 7 for and the apex oxygens move locally in phase against or away from the RuO layers. Because of the weak screening along the -axis and the corresponding large strength of the nonlocal EPI we can expect these vibrations to induce CF’s in the RuO layers, see table 3 for the calculated results. However, the CF’s differ qualitatively between and , respectively, because for the -point vibrations the following sum rule can be derived for the CF’s [10],
| (18) |
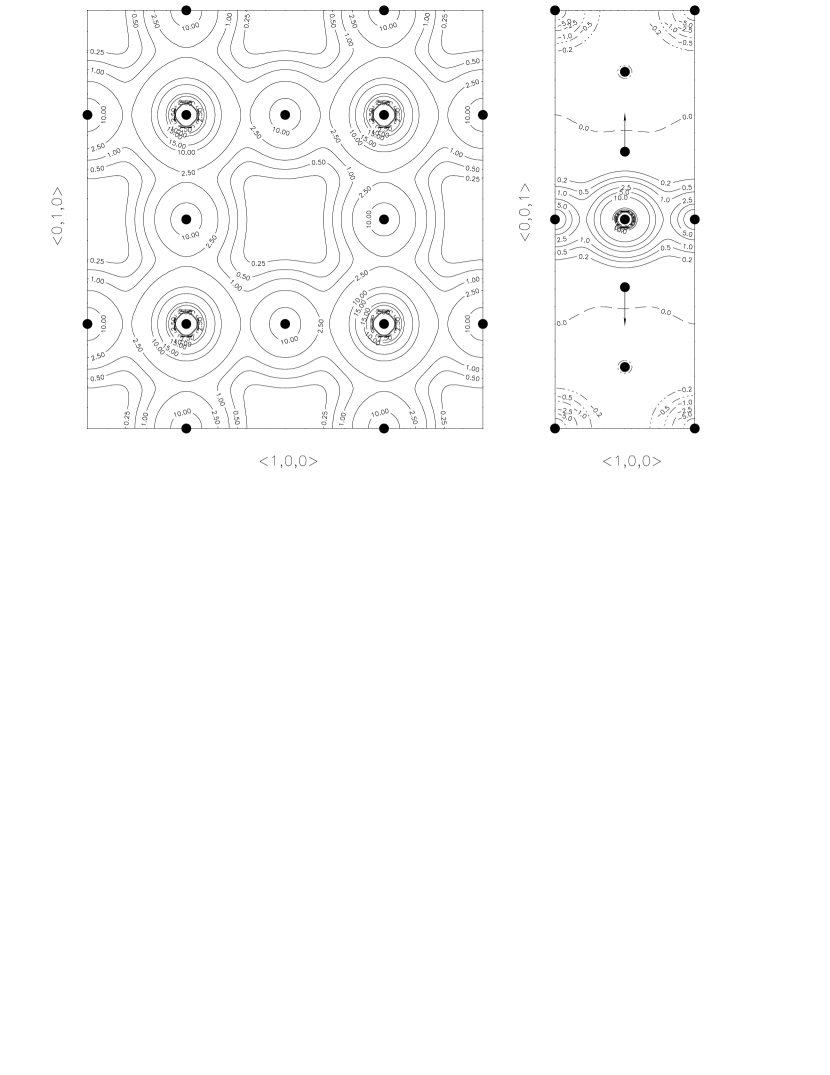
The sum over in equation (18) runs over the CF’s in an elementary cell of the crystal and denotes the various eigenmodes at . Physically equation (18) means that local charge neutrality of the elementary cell is maintained in the long-wavelength limit , i.e. the mode induced CT is organized within the cell such that from the outside the cell looks electrically neutral. Equation (18) puts a strong constraint on the possible CT in the cell and thus on the screening by CF’s. This restriction explains the small renormalization of the frequency of only 0.581 THz of in relation to where the renormalization due to CF’s is 4.046 THz. In [11] the pronounced softening and the broadening of is attributed to a strong coupling between this phonon and an interlayer charge transport. Such an interpretation is supported by our calculations for where the CF’s can be read off from table 3 and the CT is illustrated in figure 11 in terms of the nonlocal part of the displacement induced rearrangement of the charge density according to
| (19) |
The CF’s in equation (19) are obtained from equation (11) and the form-factors from equation (2).
In contrast to the constraint for expressed by equation (18) no such restriction must be satistfied in the metallic phase for . While in only an intracell CT is allowed summing up to zero, generates CF’s of the same sign in the cell (table 3). This finally leads to CF’s of alternating sign in consecutive RuO layers (cells), i.e. an interlayer (intercell) CT is set up, see also figure 11. The latter provides an effective screening mechanism of the Coulomb interaction and explains the strong renormalization of as compared with .
In the adiabatic approximation used in the calculations so far the interlayer CT is instantaneous. It has to be be replaced by a dynamic collective charge transfer in case a phonon-plasmon scenario would be realistic as for La2CuO4 in a nonadiabatic region nearby the -axis. The question if such a scenario is also likely for the more anisotropic Sr2RuO4 is discussed in section 3.3.
-
O 38.252 26.603 17.871 50.875 33.764 22.048 19.635 20.642 21.381 21.178 22.875 24.031
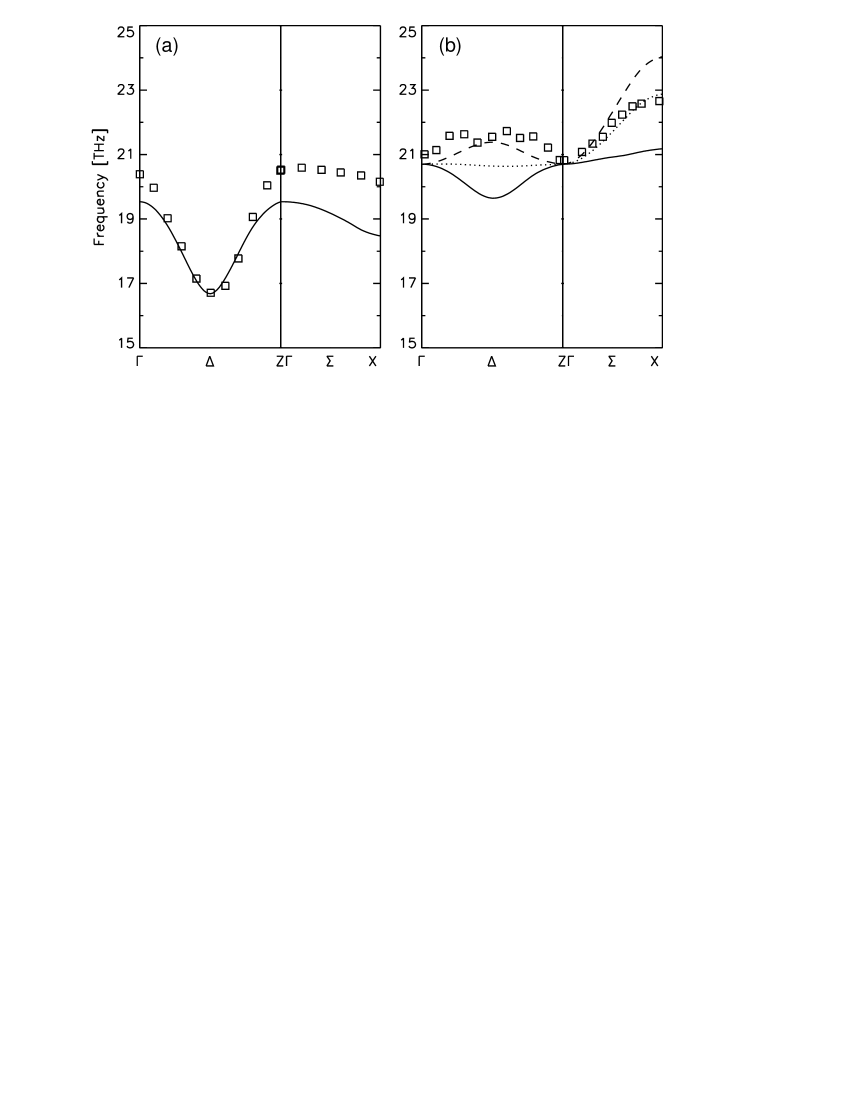
An important difference is found when considering the OBSM in the cuprates and in Sr2RuO4, respectively. The anomalous softening of the OBSM phononanomalies, see figure 12(a), in particular of the half breathing mode which is typical for La2CuO4 [8], and most probably generic for all the cuprate based HTSC’s [9], [28] is strongly reduced in our calculation as compared with La2CuO4. In the experiments the softening is completely absent, see figure 12(b). Our calculations show that there is a dominant microscopic reason for the vanishing of the OBSM anomalies in Sr2RuO4, namely the magnitude of the on-site Coulomb repulsion U(Ru4d) of the 4d orbitals of ruthenium. The latter is obviously underestimated in our ab-initio calculation based on the ionic form-factor . Compared with the calculated value for the on-site repulsion U(Cu3d)=1.005 dRy in La2CuO4 which leads to good results for the frequencies of the OBSM in this material, the calculated value for ruthenium, U(Ru4d) = 0.619 dRy, seems not so reliable because of the more incomplete 4d shell of Ru and the spherical average assumed in our computations for the orbital densities. So, we increased the value of the Ru4d on-site repulsion in two steps towards the calculated result for the Cu3d orbital for comparison. As a consequence the phonon anomalies completely vanish in these calculations in agreement with experiment as displayed in figure 12(b). Simultaneously by increasing U(Ru4d) the CF’s on the Ru4d orbitals that are a measure for the nonlocal electron-phonon coupling are strongly decreased as can be seen in table 4.

In [29] and [30] sharply peaked magnetic fluctuations at have been observed for Sr2RuO4. These fluctuations have been related to dynamical nesting properties between the flat and sheets of the FS, compare with figure 5(a). Braden et al. [11] have performed a search for Kohn anomalies in the phonon spectrum related to this nesting structure. Promising candidates would be the high frequency modes which are coupled to the Ru4d CF’s. However no signature for a Kohn anomaly is present in the experiments as well as in the calculation in figure 10. Another possibility discussed in [11] is the longitudinal acoustic branch where a small dip is observed just around , see figure 13. From our calculations it seems very unlikely that this dip is a nesting effect because our computations of the phonon dispersion shows that this feature is well described by a complex anticrossing between the three lowest branches with symmetry, as shown in figure 13. So we do not find in Sr2RuO4 any evidence for EPI driven by nesting of the FS.
3.3 Search for a phonon-plasmon scenario in Sr2RuO4
We investigate for Sr2RuO4 the possibility of a phonon-plasmon scenario along the -axis and in a small region around this axis by performing calculations of the coupled electron-phonon dynamics in the nonadiabatic regime. This is achieved approximatively by allowing the proper polarization part of the DRF to depend on the frequency of the perturbation. Different from static screening in the adiabatic approximation this leads to dynamical screening of the Coulomb interaction. A nonadiabatic treatment of the charge response and a related phonon-plasmon coupling has been shown recently to be a realistic option for La2CuO4 if the real anisotropy of the material is taken into account in the theory [12].
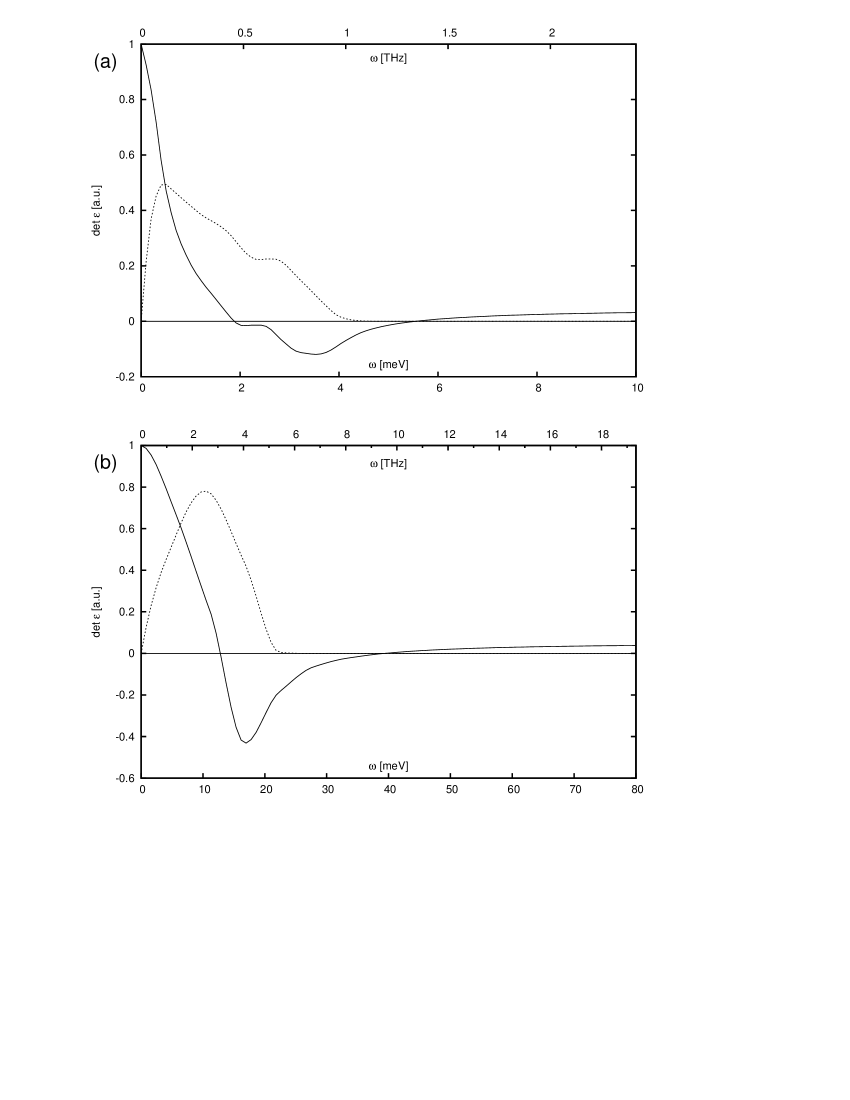
Due to the much weaker -dispersion of the electronic band-structure obtained in the computation for Sr2RuO4 as compared with La2CuO4 we can expect much lower plasmon frequencies along the -axis. This conjecture can be shown to be true for example by calculating at the point the free-plasmon frequency according to equation (14) and checking the result against La2CuO4, see figure 14. From the zero crossing of the real and the imaginary part of we get for Sr2RuO4 in the M27BM2 the very small value of meV (1.342 THz) while for La2CuO4 we have meV (9.509 THz) [12] which is by a factor of seven larger. This also expresses the much stronger anisotropy of Sr2RuO4 in relation to the cuprates.
In the analysis of the phonon-plasmon scenario we have assumed the collisionless regime, i.e. the quasiparticles (QP) do not scatter each other and damping is only possible via intraband electron-hole decay and low-lying interband transitions. However, in the cuprates and also in Sr2RuO4 QP scattering due to electron-electron interaction and other degrees of freedom is certainly important. This leads to damping and possibly overdamping of -axis plasmons at sufficiently low frequencies and so the latter may cease to be well defined collective excitations of the Fermi liquid.
In order to make an estimate of the range of frequencies where -axis plasmons should exist we examine the zero crossing of the real part of the well known dielectric function of an electron gas
| (20) |
is the high-frequency dielectric constant, the scattering rate of the QP’s along the -axis. Equating to zero we have the equation,
| (21) |
Using for the value given in [31] in the normal state of La2CuO4 and the calculated value for the high-frequency dielectric constant along the -axis [16] we obtain for THz. For smaller plasmon frequencies we have , i.e. the plasmon has a diffusive pole and hence the -axis plasmon is overdamped in the normal state. It should be remarked that larger values for would increase the critical value for beyond that the plasmon could exist. For example setting or we would have THz or 10.19 THz, respectively. Assuming a similar -axis scattering rate of the QP’s for Sr2RuO4 we regard THz as a reasonable limiting frequency beyond which plasmons most likely are not overdamped.
Thus, from our calculations of the plasmon along the -axis ( direction) displayed in figure 15(a) which are at very low frequencies around 1 THz we conclude that the latter are overdamped. On the other hand at larger plasmon frequencies which result in case the wavevector is not strictly parallel to the -axis, as shown for example in figure 15(b), the plasmon can acquire enough energy to resist overdamping and may exist as a collective excitation.
In figure 15(a) we identify instead of the six branches of the adiabatic approximation (compare with figure 2(c)) an additional branch due to phonon-plasmon coupling. The free-plasmon has frequencies around 1 THz and is nearly dispersionless along the direction. This is in contrast with the situation in La2CuO4 [12] where the free-plasmon has significant higher frequencies and increases from about 9.5 THz at the point to about 12.8 THz at . Thus, the plasmon is not overdamped along the -axis in La2CuO4 while the phonon-plasmon scenario calculated in the collisionless regime for Sr2RuO4 as displayed in figure 15(a) is not realistic.
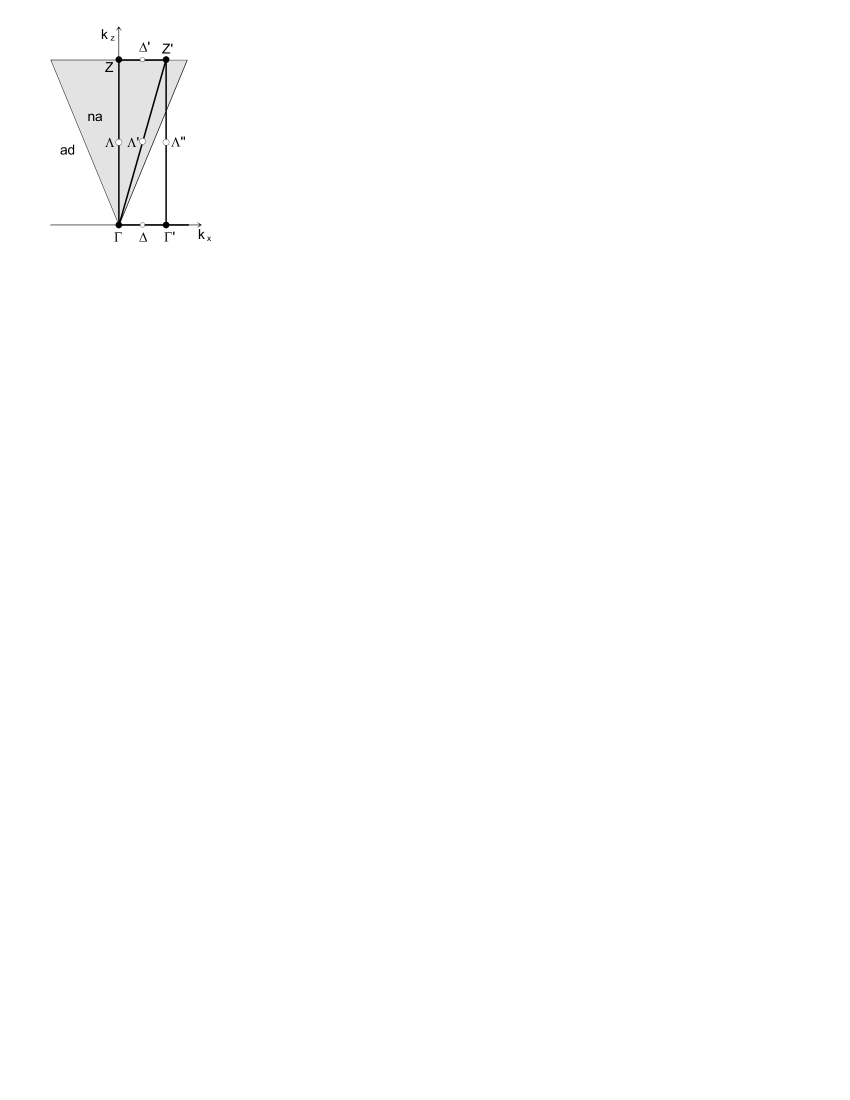
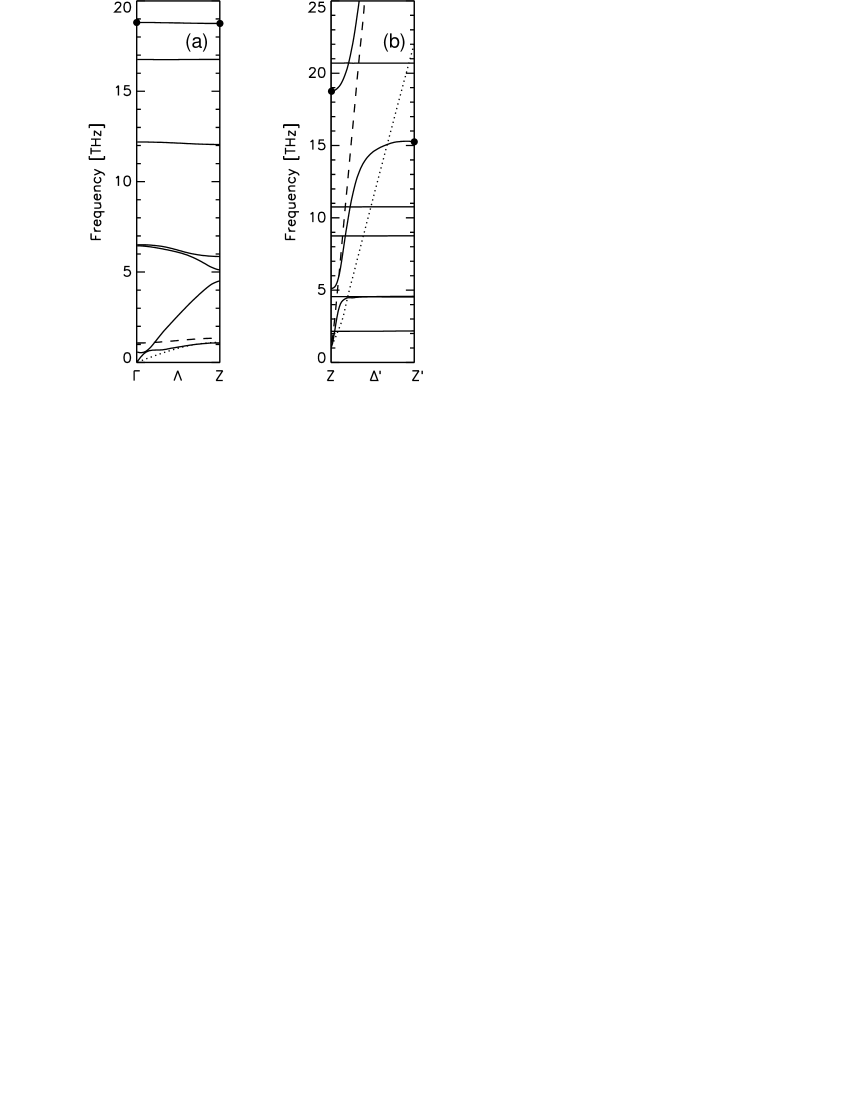
Analogous to the situation in La2CuO4 [6, 12] the calculated free-plasmon frequencies rapidly increase in proportion to the transverse component of the vector in a small nonadiabatic region of the charge response around the -axis. We have performed calculations along the and direction in this region, see figure 16, for different small -values to study a possible phonon-plasmon scenario in Sr2RuO4. We do not go into the details of these computations here but what is important concerning the question of overdamping is that for in case of the direction and for in the direction the free-plasmon frequency is larger than 7 THz, the estimated value for the phonon-plasmon scenario to exist. From the calculations we find that the longitudinal (ferro, na) mode at (figure 15(a)) is virtually unchanged at and so does exist around 19 THz. The same holds true for (na) at the point being practically the same as for in the direction. Similar as for La2CuO4 [12] with increasing (ferro, na) and (na) rapidly leave the spectrum to high frequencies.
In case of (na) this mode behaviour can also be extracted from figure 15(b) where we have presented our calculated results of the dispersion of the coupled phonon-plasmon modes along the direction from to for . The highest mode at is the (na) mode also seen in figure 15(a) as a black dot. The broken line is the dispersion of the free-plasmon branch calculated from equation (14) and the dotted line is the borderline for damping due to electron-hole decay investigated from for the bands crossing the Fermi level. From this figure the range of the region with a nonadiabatic charge response can be estimated. It is characterized by the steep branch which ultimately converges to the frequency of the adiabatic mode (black dot at ). Similar as in La2CuO4 this nonadiabatic region is very small and can be estimated from the figure at about . Unlike the case of La2CuO4 the phonon-plasmon dispersion in figure 15(b) should not exist in the full range of frequencies according to our estimate for overdamping below about 7 THz.
Parallel to the investigation of the mode in La2CuO4 [6, 12], the line-broadening of this mode observed by [11] in Sr2RuO4 can be understood from the calculated phonon-plasmon scenario. Experimentally there is a limited wave vector resolution in INS for the transverse direction perpendicular to the -axis which for the experiments in La2CuO4 is on the average [32]. Thus, the relevant frequency range sampled in the measurement for is over the steep branch beyond which the mode develops an -like displacement pattern. According to the calculations this sampling occurs for mode frequencies larger than 12.5 THz and leads to a corresponding broadening of the linewidth for observed in the experiment.
Because the region with a metallic adiabatic charge response outweights by a factor of roughly three the nonadiabatic region we can attribute to the mode an adiabatic frequency of about 15.3 THz. The branch starting at (na) in figure 15(b) has not been observed in the experiments so far because a very high -space solution transverse to the -axis would be needed to resolve the mode dispersion in the small nonadiabatic sector.
In [12] we have pointed out for La2CuO4 the relevance of a strongly coupling nonadiabatic mode. So it is interesting to see if such a large EPI also exists for (na) in Sr2RuO4. As a parameter for the strength of the EPI in a certain mode we have used in the past the orbital averaged changes of the selfconsistent crystal potential , [6, 12]. In case of La2CuO4 we obtain in units of meV and which should be compared with the considerably reduced strength and in Sr2RuO4.
Altogether, we conclude from our calculations for Sr2RuO4 that nonadiabatic EPI via phonon-plasmon coupling is not possible strictly along the -axis but most likely away from this axis in a very small region at higher free-plasmon frequencies. Moreover, the strength is significantly smaller as in La2CuO4.
We have argued above that the longitudinal ferroelectric (ferro, na) mode exists in the nonadiabatic sector around the point at about 19 THz. This nonadiabatic result helps to understand why -axis optical activity seen in the experiments [33] is possible despite the fact that Sr2RuO4 is in the metallic phase. In [33] three -polarized phonon structures at 6.04 THz, 10.88 THz and 14.51 THz have been detected which agree well with the calculated transverse modes in the M27BM2 at 5.16 THz , 10.42 THz and 14.49 THz. The by far largest oscillator strength is obtained for the mode at 10.88 THz and according to our calculation this is the ferroelectric mode (ferro). Consistent with the large oscillator strength of this mode in the experiment our nonadiabatic result for the longitudinal ferroelectric mode (ferro, na) predicts a very large splitting of about 9 THz. This splitting dominates the infrared response for polarization along the -axis. Further we find in the calculations two other longitudinal modes at 12.379 THz and 6.964 THz which define corresponding splittings with the transverse modes above.
From a theoretical point of view it is important to remark that optical activity in the metallic phase cannot be explained using the adiabatic approximation for a calculation of the phonon dispersion as is commonly done by applying static DFT for the metal [19, 20, 21, 22]. In such calculations there will be no LO-TO or splittings being a measure for the oscillator strength because the transverse effective charges vanish if the metallic phase is treated in adiabatic approximation and consequently the induced dipole moments defining the oscillator strength in the dielectric function (matrix) vanish too. Thus, there will be no optical activity in a metal by the phonons treated in adiabatic approximation which underlies static DFT.
4 Summary and conclusions
We have shown that for a reliable description of the -axis charge response in Sr2RuO4 and in particular the phonon dynamics along this axis a typical LDA-based model is too isotropic and must be modified to account for the much weaker interlayer coupling in the real material. Similar as in the cuprates studied earlier the large anisotropy in Sr2RuO4 is considerably underestimated in DFT-LDA calculations of the electronic BS.
From our investigations we conclude that an accurate representation of the very fainty -dispersion of the BS nevertheless is essential to understand the -axis polarized modes. While the LDA-based model (27BM) is insufficient a modified much more anisotropic model (M27BM2) is well suited.
We have examined the multi-sheet FS of Sr2RuO4 with the two models and found that the experimental results for the FS are not well described within the 27BM. On the other hand, the M27BM2 shows a good agreement with the measured FS. This model can be considered to represent the real anisotropy in Sr2RuO4 sufficiently well.
We have also calculated the magnitude of the strongly enhanced anisotropy in the M27BM2 compared with the 27BM more globally in terms of some Fermi surface parameters important for transport properties. Checking both models against each other we find an enhancement of about a factor 18 for the anisotropy ratio of the Drude plasma energy tensor and of about a factor of 10 for the Fermi velocity tensor. While the calculations demonstrate that Sr2RuO4 is a nearly two-dimensional Fermi liquid significantly more anisotropic than La2CuO4 the remaining very weak three-dimensionality is crucial to achieve a solid representation of the -axis charge response and of certain -axis phonons.
We have calculated in detail the phonon dispersion in Sr2RuO4 along the main symmetry directions in the BZ and compared the result with the dispersion of the HTSC La2CuO4 being structural isomorphic. A good overall agreement of the calculated results is found for Sr2RuO4 with the INS data. Comparing the results of the calculated phonon dynamics in the RIM with a model allowing additional DF’s and finally the full model including DF’s and CF’s the renormalization of certain modes which are strongly coupled via nonlocal EPI effects of DF- and CF-type has been analyzed in detail. In this context an important point of the comparison with La2CuO4 is that the anomalous softening of the high-frequency oxygen bond-stretching modes, being generic for the cuprate based HTSC’s, is strongly reduced or completely absent in Sr2RuO4 depending primarily on the magnitude of the on-site Coulomb repulsion of the Ru4d orbitals.
We have also investigated the possibility of a Kohn anomaly in the modes of Sr2RuO4 as discussed in the literature. In our calculations we do not find any evidence for such an anomaly driven by nesting of the FS. Instead, the dip in the lowest branch seen in the experiments is well explained in our computations by an anticrossing effect of the three lowest branches.
Finally, we have examined the question of a possible phonon-plasmon scenario in a small region of nonadiabatic charge response around the -axis which has been shown to be a realistic option in La2CuO4.
Due to the much weaker electronic -dispersion obtained for Sr2RuO4 the calculated free-plasmon frequencies along the -axis are about a factor of eight smaller in the collisionless regime than in La2CuO4. We have argued that damping generated by the interactions between the QP’s as well as interband transitions which are at much lower energy scale than in La2CuO4 leads to an overdamping of the plasmon strictly along the -axis in contrast to La2CuO4. However, a coupled phonon-plasmon scenario becomes likely also in Sr2RuO4 at higher free-plasmon frequencies. This occurs in case the wavevector is not strictly parallel to the -axis but has a small transverse component. We find that the strength of this nonlocal nonadiabatic coupling is significantly weaker than in La2CuO4.
Ultimately we have explained by our calculations of the nonadiabatic charge response the linewidth of the apex oxygen breathing mode at the point and why -axis optical activity as seen in the experiments is possible despite the fact that Sr2RuO4 is in the metallic phase.
References
References
- [1] Maeno Y et al. 1994 Nature 372 532
- [2] Bergemann C, MacKenzie AP, Julian SR, Forsythe D and Ohmichi E 2003 Adv. Phys. 52 639
- [3] Ho AF and Schofield AJ 2005 Phys. Rev. B 71 045101
- [4] Mackenzie AP, Maeno Y 2003 Rev. Mod. Phys. 75 657
- [5] Mao ZQ et al. 2003 Phys. Rev. B 63 144514
- [6] Falter C 2005 Phys. Status Solidi B 242 78
- [7] Bauer T and Falter C 2008 Phys. Rev. B 77 144503
- [8] Falter C, Bauer T, and Schnetgöke F 2006 Phys. Rev. B 73 224502
- [9] Pintschovius L 2005 Phys. Status Solidi B 242 30
- [10] Falter C, Klenner M and Ludwig W 1993 Phys. Rev. B 47 5390
- [11] Braden M, Reichardt W, Sidis Y and Maeno Y 2007 Phys. Rev. B 76 014505
- [12] Bauer T and Falter C 2009 cond-mat/0808.2765
- [13] Falter C, Klenner M, Hoffmann GA and Schnetgöke F 1999 Phys. Rev. B 60 12051
- [14] Falter C 1988 Phys. Rep. 164 1
- [15] Falter C, Klenner M and Hoffmann GA 1995 Phys. Rev. B 52 3702
- [16] Falter C and Schnetgöke F 2002 Phys. Rev. B 65 054510
- [17] Perdew JP and Zunger A 1981 Phys. Rev. B 23 5048
- [18] Krakauer H, Pickett WE and Cohen RE 1998 J. Supercond. 1 11
- [19] Savrasov SY and Andersen OK 1996 Phys. Rev. Lett. 77 4430
- [20] Wang CZ, Yu R and Krakauer H 1999 Phys. Rev. B 59 9278
- [21] Bohnen KP, Heid R and Krauss M 2003 Europhys. Lett. 64 104
- [22] Giustino F, Cohen ML and Louie SG 2008 Nature 452 975
- [23] Mazin II, Papaconstantopoulos DA and Singh DJ 2000 Phys. Rev. B 61 5223
- [24] Shen KM et al. 2007 Phys. Rev. Lett. 99 187001
- [25] Chmaissem O et al. 1998 Phys. Rev. B 57 5007
- [26] Moore RG et al. 2008 Phys. Rev. Lett. 100 066102
- [27] Uruma M et al. 2008 cond-mat/0711.2160 (unpublished)
- [28] Graf J, et al. 2008 Phys. Rev. Lett. 100 227002
- [29] Sidis J et al. 1999 Phys. Rev. Lett. 83 3320
- [30] Braden M et al. 2002 Phys. Rev. B 66 064522
- [31] Tamasaku K, Nakamura Y and Uchida S 1992 Phys. Rev. Lett. 92 1455
- [32] Pintschovius L, private communication
- [33] Katsufuji T, Kasai M and Tokura Y 1996 Phys. Rev. Lett. 76 126