Far-Infrared detection of neutral atomic oxygen
toward the Horsehead Nebula1
Abstract
We present the first detection of neutral atomic oxygen (– fine structure line at 63 m) toward the Horsehead photodissociation region (PDR). The cloud has been mapped with the Spitzer Space Telescope at far-IR (FIR) wavelengths using the Multiband Imaging Photometer for Spitzer (MIPS) in the spectral energy distribution (SED) mode. The [O i]63 m line peaks at the illuminated edge of the cloud at 0.1-0.5 (inward the gas becomes too cold and outward the gas density drops). The luminosity carried by the [O i]63 m line represents a significant fraction of the total FIR dust luminosity (/410-3). We analyze the dust continuum emission and the nonlocal O i excitation and radiative transfer in detail. The observations are reproduced with a gas density of 104 cm-3 and gas and dust temperatures of 100 K and 30 K. We conclude that the determination of the O i level populations and emergent line intensities at such “low” densities is a complex non-LTE problem. FIR radiative pumping, [O i]63 m subthermal emission, [O i]145 m suprathermal and even maser emission can occur and decrease the resulting [O i]63/145 intensity ratio. The Herschel Space Observatory, observing from 55 to 672 m, will allow us to exploit the diagnostic power of FIR fine structure lines with unprecedented resolution and sensitivity.
1 Introduction
Oxygen is the most abundant heavy element in the Universe. Due to its relatively high ionization potential, far-ultraviolet (FUV) photons (6 eV13.6 eV) do not ionize it and thus a large fraction of atomic oxygen can be expected in the photodissociated gas interface between the ionized and the molecular gas before chemical species such as CO, H2O or OH reach high abundances. The absorption of FUV photons by dust grains leads to the ejection of photoelectrons that heat the gas (e.g., Draine 1978) as well as to intense FIR dust continuum emission. The efficiency of this essential process can be estimated by comparing the luminosity of the main gas cooling lines (e.g., the FIR fine structure lines of C ii and O i) with the luminosity of the dust emission. Indeed, FIR lines from abundant gas reservoirs are key players in the energy balance of the regions they trace (from FUV illuminated interstellar clouds and protoplanetary disk surfaces to extragalactic starbursts).
The O i() fine structure triplet system is formed by the (ground–state), the (12/=228 K) and the (01/=99 K) levels. Radiative transitions between the – and – states lead to the widespread [O i]63 and 145 m line emission respectively. Observations and models of such lines are crucial diagnostics of a broad range of galactic and extragalactic environments (see Hollenbach & Tielens 1999 for a review).
In this Letter, we present the first detection of the [O i]63 m line toward the Horsehead PDR (400 pc, edge-on), one of the most famous FUV-induced chemical laboratories in the sky. We analyze the FIR line and continuum emission without strong simplifying assumptions in the excitation and radiative transfer treatment.
2 Observations and Data reduction
The Horsehead nebula was observed with the Multiband Imaging Photometer for Spitzer (MIPS) as part of our “SPECPDR” program (ID:20281; Joblin et al. 2005) on 2006 April 3 using the spectral energy distribution mode (hereafter MIPS/SED). MIPS/SED provided the capability of obtaining low–resolution spectra () in the FIR range (m) using a slit spectrometer and the MIPS 70 Ge:Ga detector array. The slit size has two detector pixels in width (20′′) and 12 pixels in length (2′). A reflective grating provides a spectral dispersion of 1.7 m pixel-1. We used the “spectral mapping” mode and covered the Horsehead with 14 pointings shifted by half the slit width in the direction perpendicular to the slit length. The exposure time was 10 s per pointing. The “chop distance” for the OFF positions was set to +3′ for each pointing. Both ON– and OFF–source areas are shown in Fig. 1.
We subtract the average OFF-source spectrum to every ON-source spectra. We first retrieved the BCD data (ver. s16.1.0) that we proceed with the mosaic_sed.pl script of MOPEX111http://ssc.spitzer.caltech.edu/postbcd/mopex.html to obtain the post-BCD level data (in intensity units of MJy sr-1). We apply a flat correction to the spatial dimension on the detector (i.e. detector columns relative gain correction) at the BCD level. We compute the flat response of the detector columns using the OFF positions. We have developed a pipeline that builds spectral cubes (two spatial dimensions and one spectral dimension) from the Post-BCD data. We work in the assumption that no spatial information is available in the slit width. Thus, the rows of the detector can be seen as images of the sky through the slit for sampled wavelengths between 55 and 97 m. For each wavelength, this image of the slit is reprojected into a spatial grid of the sky. The final cube then has pixels. The pixel size of the spatial grid is half of each detector pixel field–of–view, PFOV (9.8”/2 = 4.9”).
Nevertheless, due to dispersion,
the light that falls on a pixel comes from the entire slit
width, that is two times the pixel size, so that
the PFOV is rather . This leads to an overestimation
of the intensity of a factor 2 that we take into account here.
For extended sources, one also has to correct for the effect of the aperture
used for the photometric calibration with point sources. We then divide
the intensity by the 5 pixels aperture correction function (see MIPS Data Handbook).
The photometry of the resulting spectral cubes (for all sources in our program)
were checked by cross-calibrating them with MIPS 70 data when available.
It appears that the MIPS/SED gain is 30% higher than the MIPS 70 one.
On the basis that the photometer calibration is more reliable, we apply this 30% correction
to our MIPS/SED data and use the MIPS 70 absolute
calibration uncertainty of 7%.
3 Observational Results
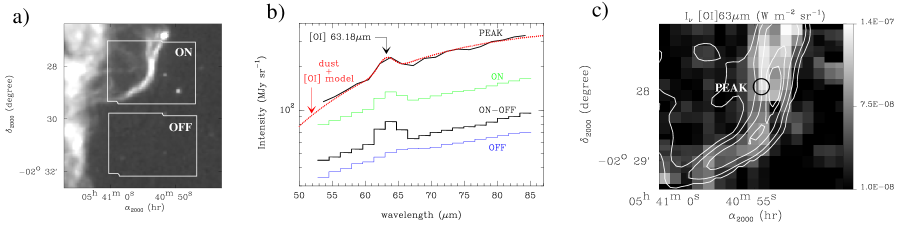
Figure 1 shows the ON– and OFF–source areas of our Spitzer observations plotted over the polycyclic aromatic hydrocarbon (PAH) mid–IR emission toward the Horsehead (Abergel et al. 2003). The PAH band emission traces the FUV illuminated edge of the cloud (Compiègne et al. 2007, 2008; Goicoechea et al. 2009). MIPS spectra averaged over the ON and OFF areas are shown as green and blue histograms (Fig. 1). The ON–OFF subtracted spectrum is shown as a black histogram. The [O i]63 m line is not present in the OFF spectrum, and therefore, the extended line emission can fully be attributed to the cloud.
In order to have an approximate view of the spatial location of the oxygen emission, Fig. 1 displays the [O i]63 m line intensity measured in each pixel of the data cube (gray scale). The ortho-H2 =0–0 (1) pure rotational line emission at 17 m, delineating the edge of the PDR, is shown as white contours. Overall, the [O i] emission peaks in the warm cloud layers (where H2 and PAH emission are also bright) directly exposed to the FUV radiation from Ori O9.5V star. Although the excitation requirements of the ortho-H2 =0–0 (1) (u/1015 K) and [O i]63 m (u/228 K) lines are different, the apparent shift between both line emission peaks in Fig. 1 may be marginal since MIPS/SED astrometry is not better than 5′′. Besides, cloud inclination variations (relative to the line of sight) from north to south, and thus differential line opacity effects, likely explain the brighter [O i]63 m emission observed toward the north of the filament.
The [O i]63 m line intensity toward the emission peak, as measured over the 15” full width at half maximum (FWHM) angular resolution of MIPS at 63 m (circle on Fig. 1), is =(1.040.14)10-7 W m-2 sr-1 (4 times brighter than the H2 =1–0 (1) fluorescent emission at 2.12 m; see Habart et al. 2005). The resulting MIPS spectrum is shown in Fig. 1 as “PEAK”. The [O i]63 m line is detected at a 10 level. The FIR thermal emission of dust raises from 155 MJy sr-1 (at 55 m) to 325 MJy sr-1 (at 85 m). The continuum peaks at longer wavelengths and thus the temperature of the grains emitting in the FIR () cannot be high (35 K), lower than the expected gas temperature (). Apart from this [O i]63 m bright emission toward the cloud edge, the MIPS data show a fainter level of widespread emission (4 times weaker) likely arising from the more diffuse cloud envelope, or halo, illuminated by the ambient FUV radiation field.
4 Discussion
4.1 Physical conditions in the Horsehead PDR
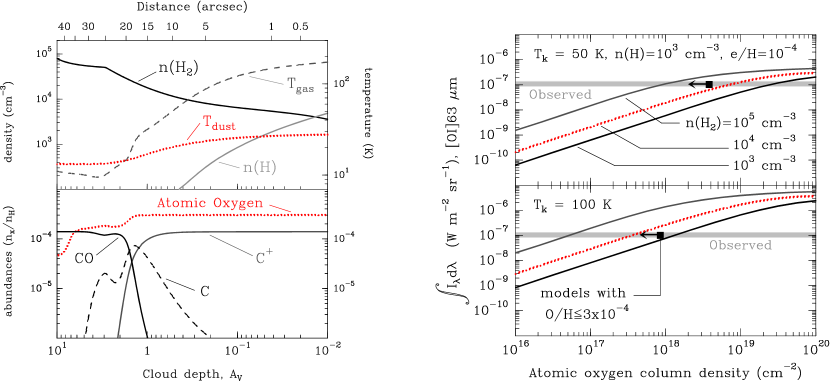
In order to guide our interpretation of the [O i]63m line toward the PEAK, Fig. 2 (left) shows the output of a photochemical model (Le Petit et al. 2006; Goicoechea & Le Bourlot 2007) adapted to the steep density gradient, (Habart et al. 2005, Goicoechea et al. 2009) and FUV illumination conditions in the Horsehead edge (100, where is the FUV flux in Habing units of the local interstellar value). We adopt an elemental oxygen abundance of 310-4 relative to H nuclei (Savage & Sembach 1996). Taking into account that the gas temperature rapidly decreases from the low density PDR (100 K; see also Pety et al. 2005; Habart et al. 2009) to the denser and shielded inner layers (20 K; Pety et al. 2007), we predict that the [O i]63m emission peak should occur at the surface of the molecular cloud between 0.1 and 0.5. Due to the relatively low FUV radiation field impinging the cloud, dust grains are not expected to attain large temperatures (30 K). However, H2 photodissociation is still important in the cloud edge and a significant fraction of hydrogen is predicted to reside in atomic form in the same layers where [O i]63 m is bright. At extinction depths greater than 1.5, carbon monoxide starts to be protected against photodissociation and the gas temperature falls sharply. The formation of CO (and other O-rich gas and ice species) decreases the abundance of atomic oxygen inward.
4.2 Nonlocal and Non-LTE Modeling
Observations of the [O i]63 m line and FIR continuum emission constrain the mean gas density and both the dust and gas temperatures toward the PDR. In this work, we use a nonlocal and non-LTE code that treats both the line and continuum radiative transfer and includes the radiative pumping of O i levels by absorption of FIR dust photons (see the Appendix in Goicoechea et al. 2006). Almost all studies solving the excitation of atomic fine structure levels simplify the problem by assuming a local treatment of the excitation calculation: LVG or single-zone escape probability methods (e.g., Röllig et al. 2007), where the source function (the line emissivity/absorption ratio) is assumed to be constant, and the radiative coupling between different cloud positions is neglected. The effects of dust opacity are also generally omitted (González García et al. 2008). Their applications to the interpretation of [O i]63,145 m lines have been widely used by a number of authors in the past (e.g., Tielens & Hollenbach 1985; van Dishoeck & Black 1986; Spaans et al. 1994; Poglitsch et al. 1995; Kaufman et al. 1999; Vastel et al. 2001; Liseau et al. 1999, 2006). Nevertheless, Elitzur & Asensio–Ramos (2006) recently compared the exact solutions provided by their nonlocal method with those given by the local approximation and concluded that, for gas densities around 103–104 cm-3, the error in the predicted [O i]63/145 line intensity ratio can be significant (i.e., comparable with the variation range of the ratio for different temperatures and densities). Indeed, these are the densities expected in the outer layers of the Horsehead nebula, i.e., below the critical densities of O i fine structure transitions (5105 cm-3 for O i (–)–H2 collisional222The collisional rate coefficients () used in this work are: O i collisions with ortho/para–H2 from Jaquet et al. (1992): note that for low energies (300-400 K), the and rates are slightly higher (e.g., by 10 at 100 K) when para-H2 is the perturber. Otherwise, rate coefficients are slightly higher for ortho-H2 collisions; O i–H collisions from Abrahamsson et al. (2007): at 100 K these excitation rate coefficients are a factor of 4 larger than those by Launay & Roueff (1977); O i–He collisions from Monteiro & Flower (1987); O i– collisions from Bell et al. (1998) and O i– collisions from Chambaud et al. (1980). de-excitation). Under these conditions, the determination of the level populations is a non-trivial problem and radiative and opacity effects (FIR pumping and line-trapping) can play a role. Besides, the [O i]63 m line becomes optically thick () for low column densities, (O i)1017 cm-2, and the [O i]145 m line can be suprathermal (Tk) or even inverted (0) and the emission amplified (0) by the maser effect (see also Liseau et al. 2006; Elitzur & Asensio–Ramos 2006).
4.3 FIR dust continuum emission
In order to constrain the dust temperature, the FIR dust luminosity and obtain an approximated value for the gas density in the [O i]63 m emitting region, we have first modeled the observed SED toward the PEAK position. We explicitly solve the continuum radiative transfer problem by taking a dust opacity proportional to (100/)β, where is the dust opacity at 100 m (per gas+dust mass column density) and is the dust spectral index. Assuming a line-of-sight depth of 0.1 pc (uncertain within a factor of 2, see constraints by Habart et al. 2005), the best models of the continuum shape and absolute intensity level are obtained for 30 K (in agreement with the PDR model prediction) and =(H)+2(H2)104 cm-3 (with 1.4 and 0.25 cm2 g-1; e.g., Li & Draine 2001). Integrating the resulting continuum intensity distribution from 40 to 500 m we obtain =2.510-5 W m-2 sr-1. The dust model is shown in Fig. 1 (red dashed curve). We determine that the line-of-sight extinction depth toward the PEAK is 1.5, consistent with the expected values of a cloud edge. The FIR dust continuum toward the region of bright [O i], H2, and PAH emission is optically thin, with 210-3.
4.4 O i excitation and radiative transfer
After modeling the FIR radiation field in the PDR we now solve the O i populations adding radiative pumping by FIR dust photons. We include collisional rate coefficients2 (cm3 s-1) of atomic oxygen with ortho– and para–H2, H, He, electrons, and protons. H2 and H collisions dominate, but it is important to include their rates (s-1) with the most realistic H and H2 density contributions. Note that, for example, collisional excitation can be neglected (to first order) if only O i–H2 collisions apply (Monteiro & Flower 1987), but it does contribute if collisions with H are included (Abrahamsson et al. 2007). We adopt an ortho-to-para–H2 ratio2 (OTP) of 3, although, at the and considered in this work, our results do not change by taking an OTP of 1 ([O i] lines become 2 brighter).
Figure 2 (right) displays a grid of nonlocal models showing the emergent intensity as a function of (O i) column density. The lower panel shows the predicted for =100 K (i.e., roughly the gas temperature in the outermost cloud layers) and varying H2 densities. Guided by our PDR model (Figure 2 (left)), and in order to modify only one physical parameter in the grid, we take a fixed (H) density of 103 cm-3 and a high ionization fraction: /=10-4 (see Goicoechea et al. 2009). Our calculations include thermal, turbulent, and opacity line broadening with a turbulent velocity dispersion of =0.225 km s-1 (FWHM). This value is inferred from heterodyne interferometric observations of the HCO radical toward the PDR (Gerin et al. 2009). The shaded regions show the observed [O i]63 m line intensity toward the PEAK position. For a line-of-sight depth of 0.1 pc and taking O i/H310-4 in the PDR (most oxygen in atomic form), our observations are reproduced with (H2)5103 cm-3 (consistent with the dust model) and (O i)8.51017 cm-2 (best model shown in Figure 1 (b)). The [O i]63 m opacity at line center is 6 (due to saturation the width of the line profile is opacity broadened, FWHM1.3 km s-1, i.e., broader than the linewidth of an optically thin line affected only by turbulent and thermal dispersion). The predicted [O i]63/145 line intensity ratio is 15. The required H2 density has to be multiplied (divided) by 4 if the gas temperature is a factor of 2 lower (higher); line opacities and [O i]63/145 intensity ratios change accordingly. Future observations of both [O i]63,145 m lines will help to better constrain the density and the atomic oxygen abundance gradient.
For =100 K, the [O i]63 m line emission is subthermal (Tk) which means that the level () is much less populated than in LTE (i.e., ). In fact we find that the – transition at 145 m is suprathermal (with ). This effect is produced by the larger radiative life time of the upper level compared to the lower level (by a factor of 5). Even more, the lack of significant - collisional de-excitation for O i–H2 collisions (neglecting those with H) can invert the level populations () leading to a [O i]145 m maser line emission. High temperatures (100 K for a pure H2 gas and 300 K for a pure H gas) together with relatively low opacities (or 105 cm-3) are required to obtain the level inversion, otherwise line–trapping in the [O i]63 m line increases the upper level population again. At such “low” gas densities () the local treatment of O i excitation overestimates (underestimates) the () level populations, leading to stronger (weaker) [O i]63 m (145 m) emission as long as 1. The error made increases with (O i) (see Elitzur & Asensio–Ramos 2006).
The FIR continuum toward the Horsehead is optically thin and radiative pumping does not play a significant role in the O i excitation (it reduces by 1 ). However, in more extreme sources (with opaque continuum emission), FIR pumping can reduce the of the O i - transition () and increase the level population ratio. For the physical conditions treated here, the [O i]63/145 ratio decreases by a factor of 2 if the dust emission becomes optically thick at 63 m. Overall, neglecting FIR pumping and using local approximations for the O i excitation overestimates the [O i]63/145 ratio.
4.5 Cooling rate and photoelectric heating efficiency
Once the non-LTE level populations have been accurately computed, one can determine the appropriate [O i]63 m cooling rate per volume unit, =– (where are the collisional excitation and de-excitation rates in s-1). This relation takes into account that only line photons following collisional excitation and escaping the cloud are responsible of the gas cooling. We compute 510-21 erg s-1 cm-3 toward the PEAK position.
Our observations and models are consistent with the [O i]63 m line arising from the outer layers (0.1 and 0.5) of the Horsehead PDR (100 and 104 cm-3) where the gas is warm (100 K) and not all available hydrogen has converted into H2 yet. Together with available [C ii]158 m observations ( W m-2 sr-1, from KAO at 55” resolution; Zhou et al. 1993), we find that the luminosity of the [C ii]158 m + [O i]63 m lines represents 1%-2% of the total FIR dust luminosity. This fraction corresponds to a high efficiency of the photoelectric heating mechanism. In fact, due to the relatively low FUV field but moderate gas density in the PDR, the Horsehead is a good source to investigate the grain populations that efficiently transform the incident FUV field into gas heating.
Herschel will allow us to map almost all relevant FIR cooling lines at much higher spectral and angular resolutions. Together with appropriate models of their excitation, it will then be possible to study the energy balance of interstellar clouds in greater detail.
References
- (1) Abergel, A., Teyssier, D., Bernard, J. P et al. 2003, A&A, 410, 577
- (2) Abrahamsson, E., Krems, R.V. & Dalgarno, A. 2007, ApJ, 654, 1171
- (3) Bell, K.L., Berrington, K.A., Thomas, M.R.J. 1998, MNRAS, 293, L83
- (4) Chambaud, G. et al. 1980, J.Phys.B, 13, 4205
- (5) Compiègne M. et al. 2007, A&A, 471, 205
- (6) Compiègne M. et al. 2008, A&A, 491, 797
- (7) Draine, B. T. 1978, ApJS, 36, 95
- (8) Elitzur, M. & Asensio–Ramos, A. 2006, MNRAS, 365, 779
- (9) Gerin, M., Goicoechea, J.R., Pety, J., & Hily-Blant, P. 2009, A&A, 494, 977
- (10) Goicoechea, J. R. & Le Bourlot, J. 2007, A&A, 467, 1
- (11) Goicoechea, J. R. et al. 2006, A&A, 456, 565
- (12) Goicoechea, J. R. et al. 2009, A&A, 498, 771
- (13) González García, M., Le Bourlot, J., Le Petit, F. & Roueff, E. 2008, A&A, 485, 127
- (14) Habart, E., Abergel, A., Walmsley, C. M., Teyssier, D. & Pety, J. 2005, A&A, 437, 177
- (15) Habart, E., Abergel A., Boulanger F. et al. 2009, A&A, submitted.
- (16) Hollenbach, D.J. & Tielens, A.G.G.M. 1999, Rev.Mod.Phys. 71, 173
- (17) Jaquet, R., Staemmler, V., Smith, M. D. & Flower, D. R. 1992, J. Phys. B, vol. 25, 285
- (18) Joblin, C., Abergel, A., Bernard, J.-P. et al. 2005, sptz.prop20281
- (19) Kaufman, M.J., Wolfire, M.G., Hollenbach, D.J., Luhman, M.L. 1999, ApJ, 527, 795
- (20) Launay, J. M. & Roueff, E. 1977, A&A, 56, 289
- (21) Le Petit, F., Nehmé, C, Le Bourlot, J. & Roueff, E. 2006, ApJS, 64, 506
- (22) Li, A. & Draine, B. T. 2001, ApJ, 554, 778
- (23) Liseau, R. et al. 1999, A&A, 344, 342
- (24) Liseau, R., Justtanont, K. & Tielens, A.G.G.M. 2006, A&A, 446, 561
- (25) Monteiro, T. S. & Flower, D. R. 1987, MNRAS, 228, 101
- (26) Pety, J., Goicoechea, J. R., Hily-Blant, P., Gerin, M. & Teyssier, D. 2007, A&A, 464, L41
- (27) Pety, J., et al. 2005, A&A, 435, 885
- (28) Poglitsch, A., Krabbe, A., Madden, S.C. et al. 1995, ApJ, 454, 293
- (29) Röllig, M., Abel, N. P., Bell, T. et al. 2007, A&A, 467, 187
- (30) Savage, B.D. & Sembach, K.R. 1996, ARA&A, 34, 279
- (31) Spaans, M., Tielens, A.G.G.M., van Dishoeck, E.F. & Bakes, E.L.O. 1994, ApJ, 437, 270
- (32) Tielens, A.G.G.M. & Hollenbach, D.J. 1985, ApJ, 291, 722
- (33) van Dishoeck, E. F. & Black, J. H. 1986, ApJS, 62, 109
- (34) Vastel, C., Spaans, M., Ceccarelli, C., Tielens, A. G. G. M., & Caux, E. 2001, A&A, 376, 1064
- (35) Zhou, S. et al. 1993, ApJ, 419, 190