111–222
Globular Cluster Ages from Main Sequence Fitting and Detached, Eclipsing Binaries: The Case of 47 Tuc
Abstract
Age constraints are most often placed on globular clusters by comparing their CMDs with theoretical isochrones. The recent discoveries of detached, eclipsing binaries in such systems by the Cluster AgeS Experiment (CASE) provide new insights into their ages and, at the same time, much needed tests of stellar evolution models. We describe efforts to model the properties of the detached, eclipsing binary V69 in 47 Tuc and compare age constraints derived from stellar evolution models of V69A and B with ages obtained from fitting isochrones to the cluster CMD. We determine, under reasonable assumptions of distance, reddening, and metallicity, the extent to which it is possible to simultaneously constrain the age and He content of 47 Tuc.
keywords:
binaries: eclipsing — globular clusters: individual: 47 Tuc — stars: evolution1 Background and Previous Results
47 Tuc is among the closest and most carefully studied globular clusters in the Galaxy. Table 1 lists the best available estimates of [Fe/H], [/Fe], distance, and reddening along with a representative sample of ages from recent studies.
| Parameter | Value | Source |
| [Fe/H] | –0.760.010.04 | Koch & McWilliam (2008) |
| –0.750.010.04 | McWilliam & Bernstein (2008) | |
| [/Fe] | 0.4 | Koch & McWilliam (2008) |
| 0.3 | McWilliam & Bernstein (2008) | |
| 13.350.08 | Thompson et al. (2009) | |
| E(B–V) | 0.03200.0004 | Schlegel et al. (1998) |
| Age (Gyr) | 10–13 | Salaris et al. (2007) |
| 11.3 | Gratton et al. (2003) | |
| 11.01.4 | Percival et al. (2002) | |
| 10.71.0 | Salaris & Weiss (2002) | |
| 11.50.8 | VandenBerg (2000) | |
| 12.51.5 | Liu & Chaboyer (2000) |
2 Stellar Evolution Models
The stellar evolution models utilized in this contribution were computed using the Dartmouth Stellar Evolution Program (DSEP; Dotter et al. 2007, 2008). The models include the effects of partially inhibited microscopic diffusion of He and metals (Chaboyer et al. 2001). The models were converted to the observational plane using PHOENIX synthetic spectra. Stellar evolution tracks and isochrones were computed for [Fe/H]= –0.8, –0.75, and –0.7; [/Fe]= 0, +0.2, and +0.4; and Y=0.24, 0.255, 0.27, 0.285, and 0.3. The color transformations include the effects of -enhancement but all assume Y0.25.
3 Age Constraints from the CMD
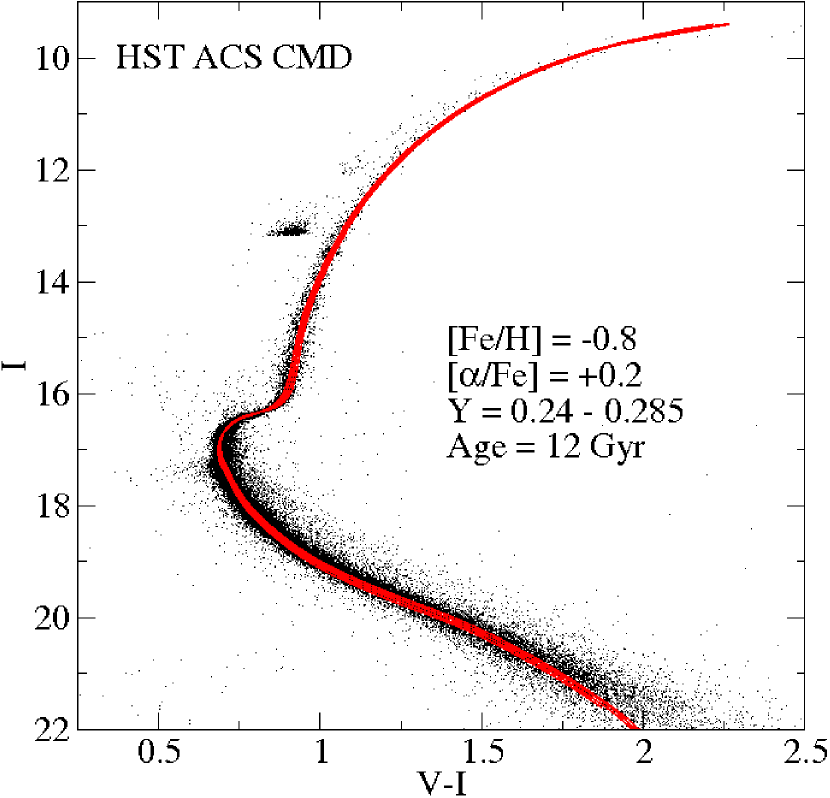
The analysis performed in this section uses the color-magnitude diagram (CMD) of 47 Tuc from the ACS Survey of Galactic Globular Clusters (Sarajedini et al. 2007; Anderson et al. 2008). The data have been culled (by removing stars with large photometric errors, see 7 of Anderson et al. 2008) in order to more clearly delineate the main sequence but the final CMD still contains 50,000 stars.
In order to simplify the analysis, the apparent distance modulus and reddening were fixed to those values listed in Table 1. Hence the only uncertainties in the ages derived from isochrone fitting are due to the inherent scatter in the data and the allowed range of metallicities.
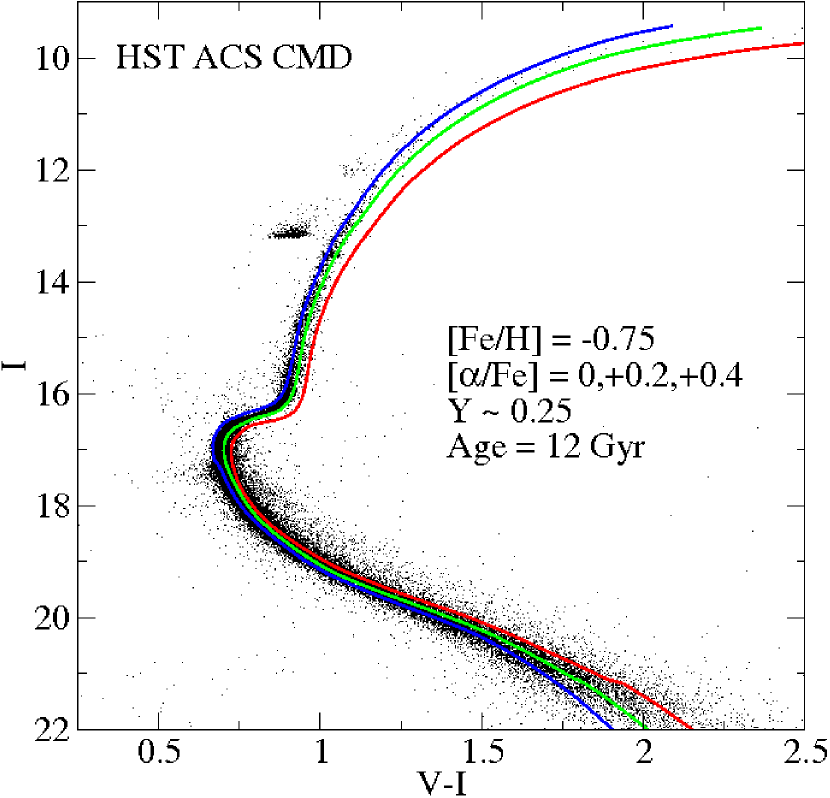
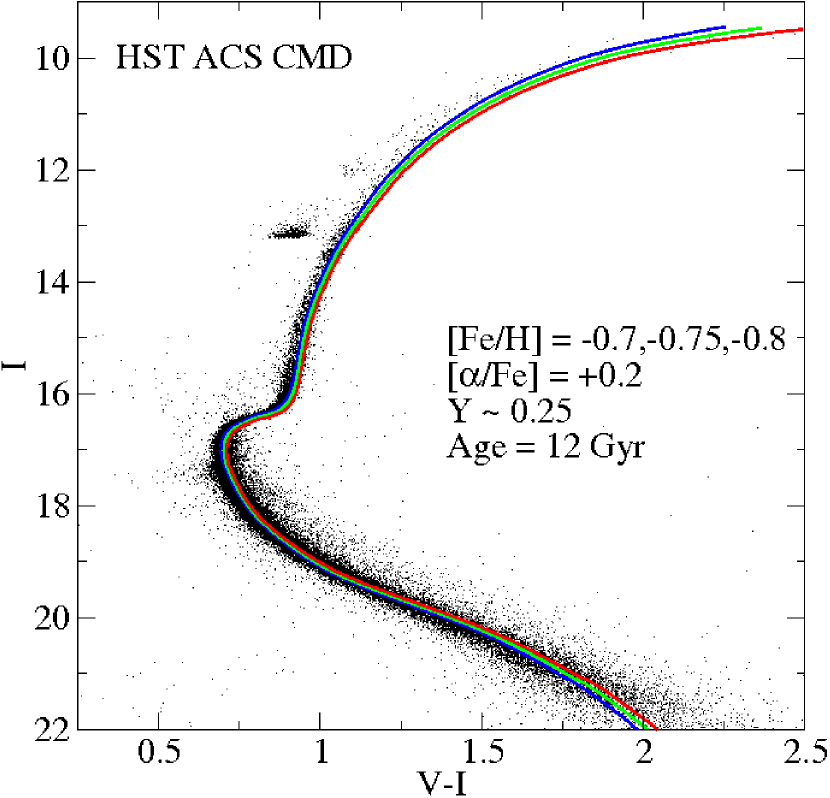
The basic results from fitting isochrones to the CMD are as follows: (i) the main sequence and red giant branch impose little or no constraint on Y variations at the 0.05 level (see Figure 1); (ii) the models favor a level of [/Fe] that is lower than the spectroscopic value (see Figure 2) and indeed appear to rule out [/Fe]=+0.4; and (iii) the range of possible [Fe/H] values listed in Table 1 all give acceptable fits to the CMD assuming the preferred value of [/Fe] is used (see Figure 3).
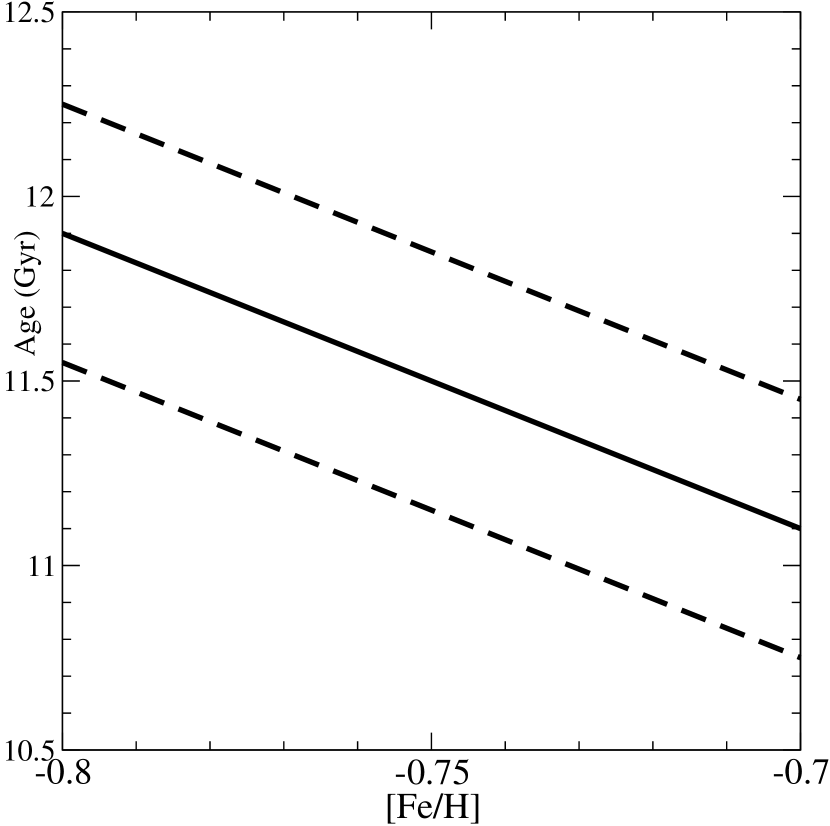
Figure 4 shows how age and [Fe/H] (assuming [/Fe]=+0.2 and Y0.25) are correlated. The solid line is the best fit value as a function of [Fe/H] and the dashed lines represent the error bars that arise only from the finite width of the subgiant branch. A value of Y=0.255 was adopted for the plot but any Y value within the assumed range would give a similar result. The isochrone fits to the CMD yield an age of 11.50.75 Gyr where the uncertainty due to the fitting procedure is 0.3 Gyr and the rest is due to 0.05 dex uncertainty in [Fe/H].
4 Age Constraints from the Binary V69
A careful analysis by Thompson et al. (2009) of spectroscopic radial velocity measurements and photometric light curves provides high precision estimates of the fundamental parameters of V69, see Table 2. While the masses and radii are measured to better than 1%, the luminosities are measured to no better than 10% at present (though additional near-infrared light curves will substantially improve this number).
| Parameter | Primary | Secondary |
|---|---|---|
| 0.87620.0048 | 0.85880.0060 | |
| 1.31480.0051 | 1.16160.0062 | |
| 1.940.21 | 1.530.17 |
In order to measure the age of 47 Tuc using V69, individual stellar evolution tracks were computed for six different masses: three for each star, encompassing the central value and quoted uncertainties in Table 2. These models were calculated for the same composition grid as the isochrones described in section 2. The mass-radius (M-R) and mass-luminosity (M-L) relations in the tracks were used to determine the range of age for which each track lay within the error bars for the corresponding parameter (R or L) of each component. We make two important general comments: (i) the ages derived from each relation are in excellent agreement between the two stars and (ii) the agreement between the two methods in a given star are quite sensitive to Y. For either star, the maximum Y value for which the M-R and M-L results overlap increases with [Fe/H].
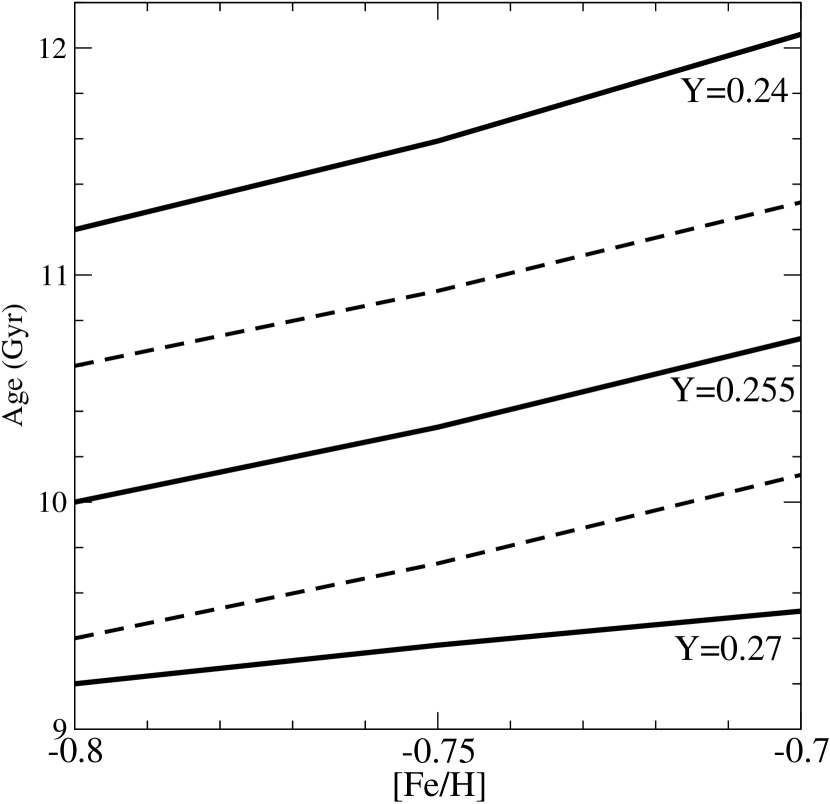
The results of the V69 age analysis are presented in the Figure 5. The solid lines indicate how the measured age varies with [Fe/H] for the Y value listed on the figure. The dashed lines above and below the line for Y=0.255 indicate the combined uncertainties in M, R, and L, with 0.5 Gyr due to the luminosity uncertainty alone. Figure 5 clearly shows that the age-[Fe/H] relation is complimentary to that of the CMD method (Figure 4). Of equal importance is the fact that since the masses of the stars are known, there is a significant sensitivity to the He abundance that is lacking in the CMD method.
5 Combined Constraints
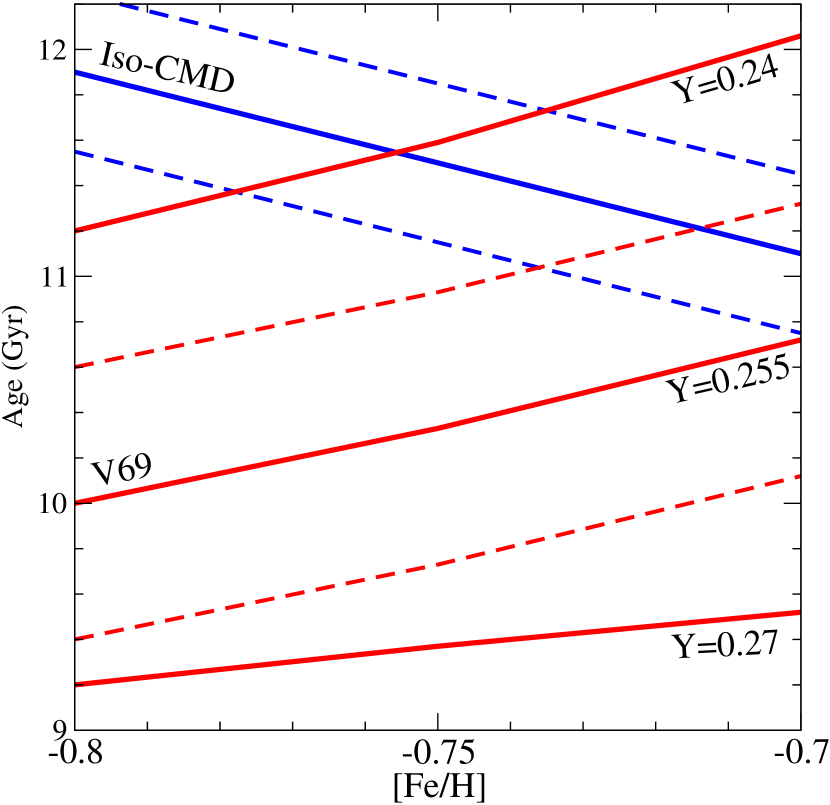
It was demonstrated in 3 that the CMD age-[Fe/H] relation (assuming that both the distance and reddening are well-constrained) is linear for –0.8 [Fe/H] –0.7 and that age decreases as [Fe/H] increases. Conversely, the result from 4 showed that while the age-[Fe/H] relation derived from V69 was also linear over the range of [Fe/H] considered, the age increased as [Fe/H] increased. Combining the two methods is therefore quite powerful because the slopes have opposite signs. The region where the two overlap has a finite size and gives preferred values for age, [Fe/H], and Y simultaneously, though ultimately the size of the overlap region is dominated by the uncertainties in both methods.
Figure 6 presents the results given in Figures 4 and 5 together so that the situation described in the preceding paragraph can be clearly seen. The figure indicates that the binary and CMD methods agree best if the He abundance is low (Y 0.24) while a value of Y 0.25 would have been more preferable given the constraints from WMAP and Big Bang nucleosynthesis, see Spergel et al. (2003).
If the bias towards [/Fe] = +0.2 derived from isochrone fits to the CMD in section 2 is relaxed and the spectroscopic value (+0.4) is adopted instead, then the combined results favor Y 0.25. However, it is difficult to reconcile the larger [/Fe] ratio given the precise reddening.
Further improvements to the distance and luminosity of V69 from near infrared light curves will significantly reduce the uncertainties and provide a much more stringent test of the stellar evolution models’ ability to simultaneously fit the components of V69 and yield an age consistent with the turnoff age. As such, the ongoing CASE project represents the most exacting test of stellar evolution models in globular clusters to date and is certain to provide invaluable insights into the ages–and other aspects–of such systems.
Acknowledgements.
Support for AD is provided by CITA and an NSERC grant to Don VandenBerg. Research of JK is supported by the Foundation for Polish Science through the grant MISTRZ. IBT is supported by NSF grant AST-0507325.References
- [Anderson et al. (2008)] Anderson, J. et al. 2008, AJ, 135, 2114
- [Chaboyer et al. (2001)] Chaboyer, B. et al. 2001, ApJ, 562, 521
- [Dotter et al. (2007)] Dotter, A. et al. 2007, AJ, 134, 376
- [Dotter et al. (2008)] Dotter, A. et al. 2008, ApJS, 178, 89
- [Gratton et al. (2003)] Gratton, R. G. et al. 2003, A&A, 408, 529
- [Koch & McWilliam (2008)] Koch, A. & McWilliam, A. 2008, AJ, 136, 518
- [Liu & Chaboyer (2000)] Liu, W. M. & Chaboyer, B. 2000, ApJ, 544, 818
- [McWilliam & Bernstein (2008)] McWilliam, A. & Bernstein, R. A. 2008, ApJ, 684, 362
- [Percival et al. (2002)] Percival, S. M. et al. 2002, ApJ, 573, 174
- [Salaris et al. (2007)] Salaris, M. et al. 2007, A&A, 476, 243
- [Salaris & Weiss (2002)] Salaris, M. & Weiss, A. 2002, A&A, 388, 492
- [Sarajedini et al. (2007)] Sarajedini, A. et al. 2007, AJ, 133, 1658
- [Schlegel et al. (1998)] Schlegel, D. J. et al. 1998, ApJ, 500, 525
- [Spergel et al. (2003)] Spergel, D. N. et al. 2003, ApJS, 148, 175
- [Thompson et al. (2009)] Thompson, I. B. et al. 2009, AJ, submitted
- [VandenBerg (2000)] VandenBerg, D. A. 2000, ApJS, 129, 315