Phase diagrams of (TM = Rh, Pd) single crystals
Abstract
Single crystalline (TM = Rh, Pd) series have been grown and characterized by structural, thermodynamic and transport measurements. These measurements show that the structural/magnetic phase transitions, found in pure at 134 K, are suppressed monotonically by the doping and that superconductivity can be stablized over a dome-like region. Temperature-composition () phase diagrams based on electrical transport and magnetization measurements are constructed and compared to those of the (TM = Co, Ni) series. Despite the generic difference between and shells and the specific, conspicuous differences in the changes to the unit cell parameters, the effects of Rh doping are exceptionally similar to the effects of Co doping and the effects of Pd doping are exceptionally similar to the effects of Ni doping. These data show that whereas the structural / antiferromagnetic phase transition temperatures can be parameterized by and the superconducting transition temperature can be parameterized by some combination of and , the number of extra electrons associated with the TM doping, the transition temperatures of and doped can not be simply parameterized by the changes in the unit cell dimensions or their ratios.
pacs:
74.10.+v; 74.62.Dh; 74.70.Dd; 75.30.KzI introduction
The discovery of superconductivity in F-doped LaFeAsO yy and K-doped Rotter compounds in the first half of 2008 has led to extensive experimental interest; has risen as high as 56 K for F doped RFeAsO systems zhaozx and as high as 38 K in K and Na doped systems (AE: Ba, Sr, Ca) Rotter . Soon after, superconductivity was also found in Co and Ni doped A1 ; Nidope and RFeAsO A2 . Recently, superconductivity was also found in and transition metal electron doped srru ; srpd ; srrh ; srir . Although electron doped systems have lower values (24 K) NiCo ; chu ; nmr ; wen , intensive studies have been made on them because doping is more homogeneous in these systems and the single crystals can be easily grown and reproduced. For example, several studies of system have resulted in remarkably similar data and conclusions NiCo ; chu ; nmr ; wen . In order to compare the effects of and electron doping in , and thus try to understand the conditions for the appearance of superconductivity in these systems, carefully constructed phase diagrams are needed. Elemental analysis, preferably of single crystal samples, should be used to determine the actual percentage of the dopant inside the lattice rather than the nominal doping level. Recently such a detailed study was made for Co doped NiCo ; chu ; nmr ; wen ; Dan ; Lester , as well as for Ni, Cu, and Cu/Co mixes threedoping . These data on , electron doped raised the question of whether the number of impurities, the band filling, and / or the unit cell dimensions were the physically salient variables. For this paper, (TM = Rh, Pd) series have been studied by the electrical transport, magnetization, specific heat and wave-length dispersive spectroscopy. We find that the phase diagrams for Co- and Rh-doping are virtually identical, as are the phase diagrams for Ni- and Pd-doping. By analysis of the relative changes in the unit cell parameters we can conclude that whereas and can still successfully be used to parameterize the structual / magentic and superconducting phase transitions in the systems, changes in the unit cell parameters, or their ratios, no longer can.
II experimental methods
Single crystals of (TM = Rh, Pd) were grown out of self flux using conventional high-temperature solution growth techniques NiCo ; canfield ; threedoping . FeAs, RhAs and PdAs powder were synthesized in the same manner as in NiCo . Small Ba chunks, FeAs/RhAs or FeAs/PdAs powder were mixed together according to the ratio Ba:TMAs = 1:4. The mixture was placed into an alumina crucible with a second ”catch” crucible containing quartz wool placed on top. Both crucibles were sealed in a quartz tube under a 1/3, partial atmosphere, of Ar gas. The sealed quartz tube was heated up to 1180 ∘C over 12 hours, held at 1180 ∘C for 5 hours, and then cooled to 1050 ∘C over 36 hours. Once the furnace reached 1050 ∘C, the excess FeAs/RhAs or FeAs/PdAs liquid was decanted from the plate like single crystals.
Powder x-ray diffraction measurements, with a Si standard, were performed using a Rigaku Miniflex diffractometer with Cu radiation at room temperature. Diffraction patterns were taken on ground single crystals from each batch. No detectable impurities were found in these compounds. The unit cell parameters were refined by ”UnitCell” software. Error bars were taken as twice the standard deviation, , which was obtained from the refinements by the ”Unitcell” software. Elemental analysis of the samples was performed using wavelength dispersive x-ray spectroscopy (WDS) in the electron probe microanalyzer of a JEOL JXA-8200 electron-microprobe. Magnetization and temperature-dependent AC electrical resistance data (f=16Hz, I=3mA) were collected in a Quantum Design (QD) Magnetic Properties Measurement System (MPMS) using LR700 resistance bridge for the latter. Electrical contact was made to the sample using Epotek H20E silver epoxy to attach Pt wires in a four-probe configuration. Heat capacity data were collected using a QD Physical Properties Measurement System (PPMS) using the relaxation technique.
III results
Summaries of the WDS measurement data are shown in Table I for both and . For each batch, up to 5 pieces of samples were measured. The table shows the number of locations measured, the average of the values measured at these locations, and two times the standard deviation of the values measured on these locations, which is taken as the error bar in this paper. We can see that the error bars are 10% of the average values. The average value, , obtained from wavelength dispersive x-ray spectroscopy (WDS) measurement will be used for all the compounds in this paper rather than nominal . It is worth noting that separate measurements of on the resistivity bars gave values within the error bars for all the measured batches.
| N | 16 | 16 | 18 | 15 | 20 | 34 | 33 | 20 |
|---|---|---|---|---|---|---|---|---|
| 0.012 | 0.026 | 0.039 | 0.057 | 0.076 | 0.096 | 0.131 | 0.171 | |
| 0.001 | 0.001 | 0.002 | 0.003 | 0.004 | 0.006 | 0.005 | 0.002 | |
| N | 18 | 8 | 52 | 6 | 6 | 12 | 14 | 52 |
| 0.012 | 0.021 | 0.027 | 0.030 | 0.043 | 0.053 | 0.067 | 0.077 | |
| 0.001 | 0.002 | 0.003 | 0.002 | 0.001 | 0.002 | 0.002 | 0.005 | |
Fig. 1 presents the normalized electrical resistivity data of the series from base temperature, 2 K, to 300 K. Normalized resistivity, instead of resistivity, is plotted because of the tendancy of these samples to exfoliate or partially crack NiCo ; tanatar1 ; tanatar2 . The resistive anomaly at 134 K for pure is associated with the structural/magnetic phase transitions ba122 . As in the case of Co, Ni and Cu substitutions NiCo ; threedoping , as is increased the temperature of the resistive anomaly is suppressed monotonically and the shape of the feature changes from a sharp decrease in pure to a broadened increase in doped samples. It is no longer detectable for . For , superconductivity becomes detectable, with K inferred from the sharp drop in the resistivity data. For , superconducting temperature has a maximum value of 24 K with a width K. With even higher , is suppressed.
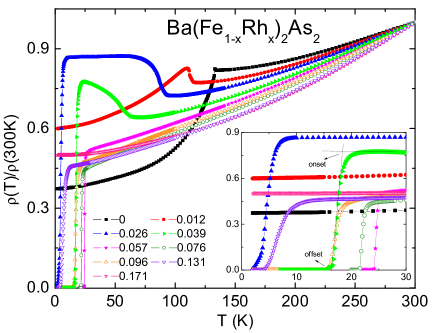
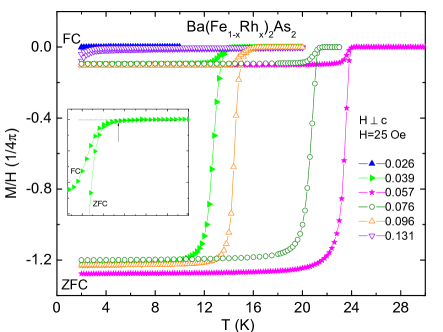
Fig. 2 shows the data for the series taken at 25 Oe with perpendicular to the crystallographic -axis. A clear diamagnetic signal can be seen in both field-cooled(FC) and zero-field-cooled(ZFC) data. Because of the low values for and , which are on the low- and high- extremes of the superconductivity dome respectively, we only observe the onset of the diamagnetic signal and no large drop below the superconducting temperature is seen down to our base temperature of 2 K. However, for all the other concentrations, the large superconducting, shielding fraction and the sharp drop below are consistent with the existence of bulk superconductivity. Compared to the low field data for NiCo , the superconducting fraction associated with the series have very similar values as of series.
The temperature dependent heat capacity data for is shown in Fig. 3. This concentration has the maximum value in this series. The heat capacity anomaly is relatively sharp and consistent with the superconducting phase transition we observed in both resistivity and low field magnetization data. The large arrow in the inset shows the onset of superconductivity and = 23.2 K. A way to estimate is also shown in the inset; 700 mJ/mole K. Assuming the BCS weak coupling approximation 1.43 and 100% superconducting volume, the value for can be estimated to be about 20 mJ/mole K2, which is comparable to the value estimated in the same manner for sergey .
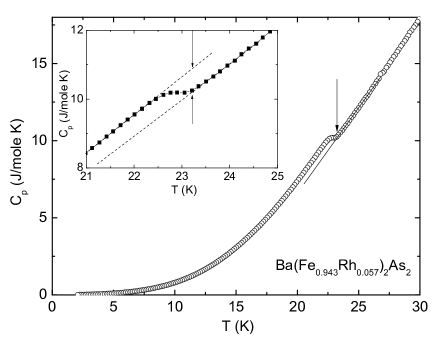
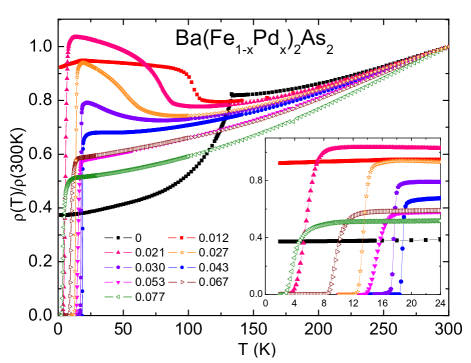
Fig. 4 shows the normalized electrical resistivity data for the series from base temperature, 2 K, to 300 K. A systematic behavior, similar to the series, is seen: the temperature of the resistive anomaly associated with the structural / antiferromagnetic phase transitions is suppressed monotonically with Pd doping and the shape of the anomaly changes from a sharp decrease to a broadened increase in resistivity upon cooling. For , the resistive anomaly can still be clearly seen and superconductivity is detected with K. For , the temperature of the resistive anomaly is further reduced and it is only inferred from a minimum in the resistivity above the superconducting transition. For , the resistive anomaly is completely suppressed and has its highest value of about 19 K and a width of K. With higher values, is suppressed.
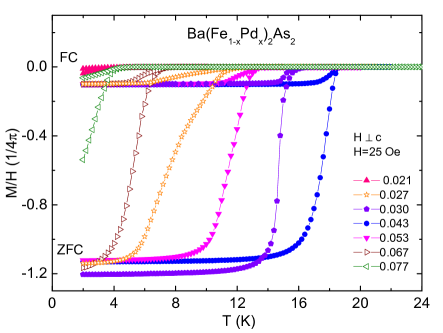
The low field data for the series (FC and ZFC) are shown in Fig. 5. They were taken at 25 Oe with perpendicular to the crystallographic -axis. The broader feature seen in the magnetization for implies a larger inhomogeneity associated with this sample. Indeed, the WDS data for does show local maximum in values. Despite the broader drop of the magnetization, the large superconducting fraction is comparable to the rest of the Pd- doped series as well as to the Co-, Ni- and Rh- doped results, all of which are consistent with bulk superconductivity. Again, only a small diamagnetic signal was observed at base temperature for due to the low for this concentration.
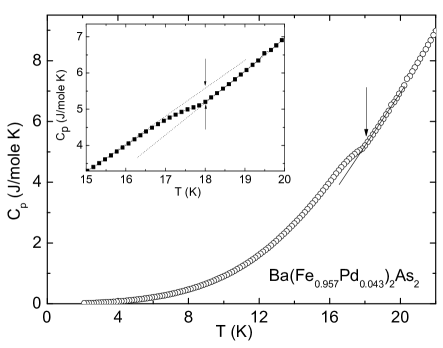
Fig. 6 shows the temperature dependent heat capacity data for , which manifests the highest value in this series. The heat capacity anomaly at can be clearly seen, although it is broader than the one found for (Fig. 3). The arrows show the onset of superconductivity at K, and the estimated is shown in the inset; 410 mJ/mole K. Using the BCS weak coupling approximation = 1.43 and assuming 100% superconducting volume in this sample, for is estimated to be about 16 mJ/mole K2.
IV discussion
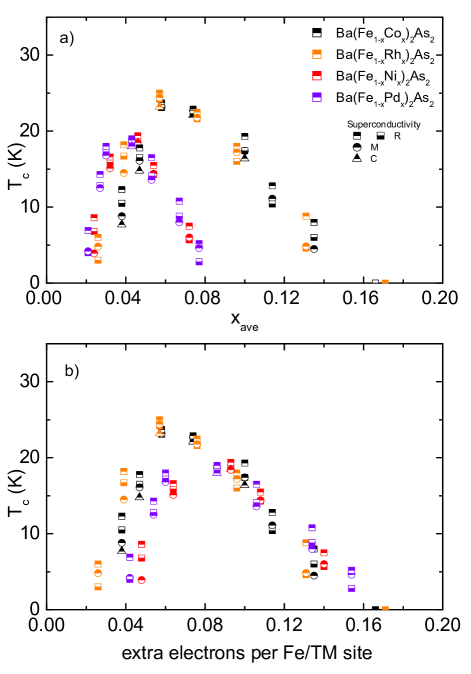
The data presented in Figs. 1 - 6 are summarized in the two, , phase diagrams shown in Fig. 7. In this paper, the temperature of structrural/magnetic phase transitions are inferred from the derivative of the temperature dependent resistivity data which shows a split feature for finite values of NiCo . Onset and offset criteria, which are shown in the inset of Fig. 1, are used to determine from the resistivity data. The criterion which is shown in the inset of Fig. 2 is used to determine from the magnetization data. The arrows in Fig. 3 show the criterion used to infer from heat capacity data. We can see good agreement between resistivity, magnetization and heat capacity measurements. So as to allow comparison with the isoelectronic, electron doped compounds, data for (TM = Co, Ni) NiCo ; threedoping are also shown.
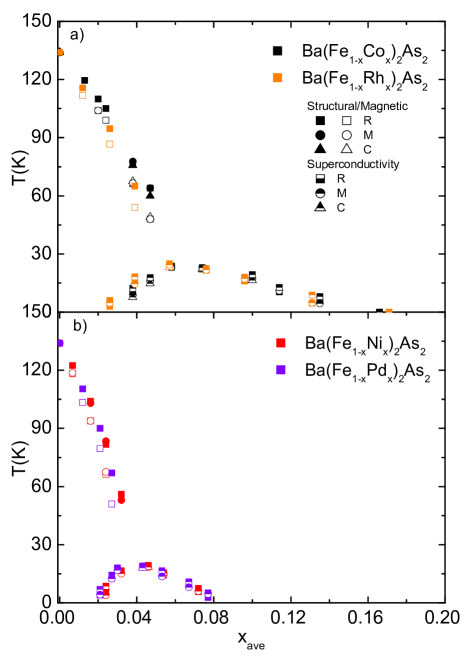
The upper panel presents the phase diagrams of Rh and Co doped and the lower panel presents the phase diagrams of Pd and Ni doped . It can be seen in both panels that the higher temperature structural/magnetic phase transitions are suppressed monotonically in a similar manner/rate for all series. Superconductivity is found in both tetragonal and orthorhombic phase NiCo ; chu ; nmr ; wen , and is stabilized in a dome-like region for all series. Superconductivity is found over a wider range of Co or Rh doping with a maximum around 24 K, and a narrower range of Ni or Pd doping with a maximum around 19 K.
The complete phase diagram of Rh doped including both structural/magnetic phase transition and superconductivity shows incredible similarity as the phase diagram of Co doped and the complete phase diagram of Pd doped shows incredible similarity as the phase diagram of Ni doped . For each of the pairs, the phase diagrams show exceptionally similar behavior on the rate of the suppression of structural/magnetic phase transitions, the range of superconducting domes and the maximum . It is worth mentioning again that to see this, the actual values are vital.
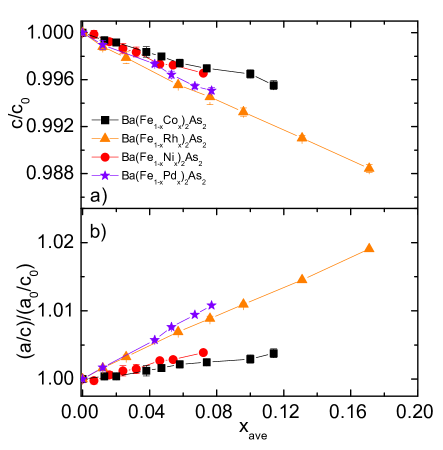
In our previous work threedoping , we compared the transition temperatures as a function of , and as a function of the number of extra conduction electrons, , added by the dopant per Fe/TM site for Co, Ni, Cu and Co/Cu doped (for the case of Co , for the case of Ni , for the case of Cu ). We conclude that whereas the suppression of the structural/antiferromagnetic transitions was parameterized by the number of TM dopant ions (or, equivalently, changes in the -axis) the superconducting dome was parameterized by the number of electrons added by doping (or, equivalently, changes in the values of the ratio), and exists over a limited range of -values (or band filling). Unfortunately we could not experimentally separate the effects of and from changes in and , respectively threedoping . However, with current, electron doped data, we can actually distinguish between and on one hand and , on the other. Fig. 8 shows the unit cell parameters normalized by the lattice parameters of pure . To compare the unit cell parameters, the data for Co or Ni doped NiCo ; threedoping are also plotted in Fig.8. The lattice parameter decreases with all dopings and the ratio of increases with all dopings. But in both cases there is a clear difference between the - and - data sets. Unlike in our previous work threedoping , where for electron doping series and can be scaled with , can be scaled with the number of extra electron added per Fe/TM site, when electron doped data are taken into account, changes in and are no longer equivalent to and . This means that if we want to parameterize the effects of - and -TM doping on the transitions temperatures of , whereas the upper, structural and magnetic phase transitions can be parameterized by and the superconducting dome can be parameterized by , they are no longer well parameterized by either or . As discussed in threedoping , it is still possible that some other parameter, such as bonding angles associated with the As position, offer better or alternate parameterization of these transition temperatures, but these are not currently known.
The parameterization scheme outlined above is based on the premise that a single parameter may be controlling the variation of the upper, structural and magnetic transition temperatures () and a second one may be controlling the superconductivity. There is another scheme that should be discussed in the context of our growing data set: that there may be a single parameter that controls the behavior of the system when and there is another single parameter when is fully suppressed. The potential appeal of this scheme can be seen in Fig. 9, where is plotted as a function of and for comparison. As discussed above and in reference threedoping , there is excellent agreement of the values when plotted as a function of when is fully suppressed. On the other hand there is arguably better agreement of the values when they are plotted as a function of for . As pointed out in ref threedoping the behavior on the side of the dome may be associated with the need to bring the upper transition to low enough temperature to allow the superconductivity to turn on. The importance of reducing may be associated with reducing the degree of orthorhombic splitting, the size of the ordered moment in the AF phase, and / or changing the magnetic excitation spectrum.
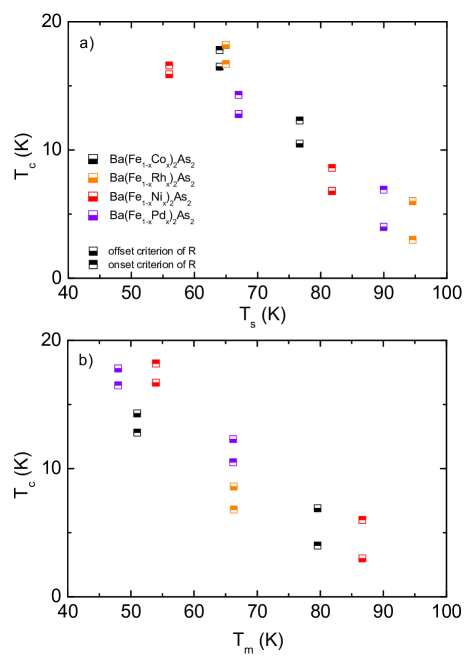
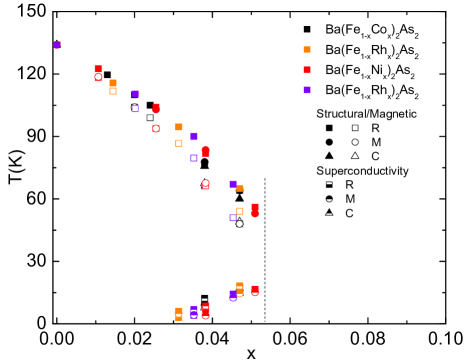
Given that only roughly scales with it is worth while examining the correlation between , and more directly. Fig. 10 plots as a function of the structural, as well as the magnetic, transition temperature (given that they are split by the time superconductivity is stabilized) NiCo ; Lester ; Dan . Both plots show a clear correlation. A more graphic way of examining the correlation between and is to create a composite diagram for the data by adjusting the scales for the Ni, Rh, and Pd data so as to collapse the and phase lines onto the Co data set. This is plotted in Fig. 11. As we can see, a clear consequence of this is to bring collapse the data onto a single phase line as well.
V conclusion
Single crystalline (TM = Rh, Pd) samples have been grown and characterized by microscopic, thermodynamic and transport measurements. phase diagrams were constructed for both the Rh- and Pd-doping series and, remarkably, they are virtually indistinguishable from the phase diagrams assembled for their -shell counterpart, Co- and Ni-doped, series. Given that the variations of the unit cell parameters are distinctly different for the and dopants, these data clearly show that whereas the amount of dopant, , and the change in electron count, , do a fair job of parameterizing the structural / magnetic and superconducting phase transitions temperatures, respectively, the variation of the c-axis lattice parameter and the variation of the ratio of the parameters no longer do.
Whereas the structural and magnetic phase transitions are fairly well parameterized by and, for , is parameterized by very well, the data for appears to depend on the degree of suppression of (and therefore may depend more on than on ). The fact that the behavior of in response to doping appears to change in the vicinity of the disappearance of is consistent with recent studies of the phase diagram for estelle as well as earlier work on K-doped kphase . In every case appears to reach its maximum value (varying from TM-, to K-, to P-doped P ) when is suppressed below .
Acknowledgments
Work at the Ames Laboratory was supported by the Department of Energy, Basic Energy Sciences under Contract No. DE-AC02-07CH11358. We would like to thank M. Tanatar, C. Martin, E. Colombier, E. D. Mun, M. E. Tillman, S. Kim, X. Lin for help and useful discussions.
References
- (1) Y. Kamihara, T. Watanabe, M. Hirano, and H. Hosono, J. Am. Chem. Soc. 130, 3296 (2008)
- (2) M. Rotter, M. Tegel, and D. Johrendt , Phys. Rev. Lett. 101, 107006 (2008)
- (3) Zhi-An Ren, Wei Lu, Jie Yang, Wei Yi, Xiao-Li Shen, Zheng-Cai Li, Guang-Can Che, Xiao-Li Dong, Li-Ling Sun, Fang Zhou, Zhong-Xian Zhao, Chin. Phys. Lett. 25, 2215 (2008)
- (4) Athena S. Sefat, Rongying Jin, Michael A. McGuire, Brian C. Sales, David J. Singh, and David Mandrus, Phys. Rev. Lett. 101, 117004 (2008)
- (5) L.J. Li, Y.K. Luo, Q.B. Wang, H. Chen, Z. Ren, Q. Tao, Y.K. Li, X. Lin, M. He, Z.W. Zhu, G.H. Cao and Z.A Xu , New Journal of Physics 11, 025008 (2009)
- (6) Athena S. Sefat, Ashfia Huq, Michael A. McGuire, Rongying Jin, Brian C. Sales, David Mandrus, Lachlan M. D. Cranswick, Peter W. Stephens, and Kevin H. Stone, Phys. Rev. B 78, 104505 (2008)
- (7) S. Paulraj, Shilpam Sharma, A. Bharathi, A. T. Satya, Sharat Chandra, Y. Hariharan, C. S. Sundar, unpublished, arXiv:0902.2728 (2009)
- (8) Fei Han, Xiyu Zhu, Peng Cheng, Bing Shen, Hai-Hu Wen, unpublished, arXiv:0903.1028 (2009)
- (9) Xiyu Zhu, Fei Han Peng Cheng, Bing Shen, Hai-Hu Wen, unpublished, arXiv:0903.0323 (2009)
- (10) Fei Han, Xiyu Zhu, Ying Jia, Lei Fang, Peng Cheng, Huiqian Luo, Bing Shen, Hai-Hu Wen, unpublished, arXiv:0902.3957 (2009)
- (11) N. Ni, M. E. Tillman, J.-Q. Yan, A. Kracher, S. T. Hannahs, S. L. Bud’ko, and P. C. Canfield, Phys. Rev. B 78, 214515 (2008)
- (12) Jiun-Haw Chu, James G. Analytis, Chris Kucharczyk, and Ian R. Fisher, Phys. Rev. B 79, 014506 (2009)
- (13) F.L. Ning, K. Ahilan, T. Imai, A. S. Sefat, R. Jin, M. A. McGuire, B. C. Sales, D. Mandrus, J. Phys. Soc. Jpn. 78, 013711 (2009)
- (14) Lei Fang, Huiqian Luo, Peng Cheng, Zhaosheng Wang, Ying Jia, Gang Mu, Bing Shen, I. I. Mazin, Lei Shan, Cong Ren, Hai-Hu Wen, unpublished, arXiv:0903.2418 (2009)
- (15) C. Lester, Jiun-Haw Chu, J. G. Analytis, S. Capelli, A. S. Erickson, C. L. Condron, M. F. Toney, I. R. Fisher, S.M. Hayden, Phys. Rev. B 79, 134528 (2009)
- (16) D. K. Pratt, W. Tian, A. Kreyssig, J. L. Zarestky, S. Nandi, N. Ni, S. L. Bud’ko, P. C. Canfield, A. I. Goldman, R. J. McQueeney, unpublished, arXiv:0903.2833 (2009)
- (17) P. C. Canfield, S. L. Bud’ko, N. Ni, J. Q. Yan, A. Kracher, unpublished, arXiv: 0904.3134 (2009)
- (18) P. C. Canfield and Z. Fisk, Philos. Mag. B 65, 1117 (1992)
- (19) M. A. Tanatar, N. Ni, C. Martin, R. T. Gordon, H. Kim, V. G. Kogan, G. D. Samolyuk, S. L. Bud ko, P. C. Canfield, and R. Prozorov, Phys. Rev. B 79, 094507 (2009)
- (20) M. A. Tanatar, N. Ni, G. D. Samolyuk, S. L. Bud’ko, P. C. Canfield, R. Prozorov, Phys. Rev. B 79, 134528 (2009)
- (21) Marianne Rotter, Marcus Tegel, Dirk Johrendt, Inga Schellenberg, Wilfried Hermes, and Rainer Pttgen, Phys. Rev. B 78, 020503 (2008)
- (22) S. L. Bud’ko, N. Ni, S. Nandi, G. M. Schmiedeshoff, and P. C. Canfield, Phys. Rev. B 79, 054525 (2009)
- (23) E. Colombier, S. L. Bud’ko, N. Ni, P. C. Canfield, unpublished, arXiv:0904.4488 (2009)
- (24) Rotter. Marianne, Pangerl. Michael, Tegel. Marcus, Johrendt. Dirk, Angew. Chem. Int. Ed. 47, 7949 (2008)
- (25) Shuai Jiang, Cao Wang, Zhi Ren, Yongkang Luo, Guanghan Cao, Zhu’an Xu, unplublished, arXiv: 0901.3227 (2009)