Modelling galaxy clustering: Is new physics needed in galaxy formation models?
Abstract
The clustering amplitude of galaxies depends on their intrinsic luminosity. We compare the properties of publicly available galaxy formation models with clustering measurements from the two-degree field galaxy redshift survey. The model predictions show the same qualitative behaviour as the data but fail to match the observations at the level of accuracy at which current measurements can be made. We demonstrate that this is due to the model producing too many satellite galaxies in massive haloes. We implement simple models to describe two new processes, satellite-satellite mergers and the tidal dissolution of satellites to investigate their impact on the predicted clustering. We find that both processes need to be included in order to produce a model which matches the observations.
keywords:
galaxy clusteringLuminosity dependence of galaxy clustering
1 Introduction
The clustering of galaxies encodes information about the values of the cosmological parameters and also about the physical processes behind the formation and evolution of galaxies. In the cold dark matter (CDM) hierarchical structure formation theory, galaxies grow inside dark matter haloes (White & Frenk 1991; Cole 1991). The formation of structure in the dark matter is governed by gravity and can be modelled accurately using N-body simulations (e.g. Springel, Frenk & White 2006). However, the fate of baryonic material is much more complicated as it involves a range of often complex and nonlinear physical processes. The efficiency of galaxy formation is expected to depend on the mass of the host dark matter halo (e.g. Eke et al. 2004; Baugh 2006). Modelling the dependence of galaxy clustering on intrinsic properties such as luminosity offers a route to establish how such properties depend upon the mass of the host halo and hence to improve our understanding of galaxy formation.
Recent advances in astronomical instrumentation have produced a wealth of information on galaxy clustering. The enormous volume and number of galaxies in the two-degree field Galaxy Redshift Survey (2dFGRS; Colless et al. 2001) and the Sloan Digital Sky Survey (SDSS York et al. 2000) have made possible accurate measurements of clustering for samples of galaxies defined by various intrinsic properties (Norberg et al. 2001, 2002; Zehavi et al. 2002, 2005; Madgwick et al. 2003; Li et al. 2006). The variation of clustering strength with luminosity tells us how galaxies populate haloes and hence about the physics of galaxy formation. Any discrepancy between the observational measurements of clustering and theoretical predictions points to the need to improve the models, either by refining existing ingredients or adding new ones.
The dependence of galaxy clustering on luminosity has been measured accurately in the local universe (Norberg et al. 2001, 2002, 2009, in preparation; Zehavi et al. 2002, 2005; Li et al. 2006). Over the period spanned by these studies, galaxy formation models have evolved significantly, particularly in the treatment of bright galaxies (see, for example, Benson et al. 2003). The majority of current models invoke some form of heating of the hot gas atmosphere to prevent gas cooling in massive haloes, in order to reproduce the bright end of the galaxy luminosity function. This has implications for the correlation between galaxy luminosity and host dark matter halo mass, which has, in turn, an impact on the clustering of galaxies.
Li et al. (2006) compared the semi-analytical galaxy formation models of Kang et al. (2005) and Croton et al. (2006), two early models with AGN feedback, against measurements of clustering from the SDSS. Qualitatively, the models displayed similar behaviour to the real data, but did not match the clustering measurements in detail. For example, Li et al. show that as the luminosity varies the predictions of the Croton et al. model change in clustering amplitude by a similar amount to the observations. The brightest galaxies are the most strongly clustered in the model. However, the clustering strength displays a minimum around before increasing again for fainter galaxies. The luminosity dependence in the SDSS data, on the other hand, is monotonic. Li et al. speculated that the models predict too many galaxies in massive haloes. They demonstrated that the clustering predictions could be improved, but not fully reconciled with the data, by removing satellite galaxies by hand.
In this paper, we extend this comparison to the 2dFGRS clustering measurements and test the latest galaxy formation models. By using the blue selected 2dFGRS, we widen the range of physics tested to include the processes which influence recent star formation. We compare models produced by different groups which allows us to probe different implementations of the physics. We reach similar conclusions to those of Li et al. and investigate physical ways to achieve the required reduction in the number of satellites.
The structure of this paper is as follows. We briefly introduce the three semi-analytic models we discuss in Section 2. In Section 3, we compare the two point correlation function results for the 2dFGRS with the theoretical predictions. In Section 4, we explore the mechanisms that drive clustering, particularly the galaxy luminosity – host halo mass relation and give a step-by-step illustration of how the number of galaxies as a function of halo mass (the Halo Occupation Distribution) is connected to the clustering amplitude. We empirically determine the HOD which reproduces the observed luminosity dependence of clustering in Section 5. We implement simple models for two new physical processes in Section 6, to see if we can modify the existing models to match the observed clustering. Finally, in Section 7, we give a summary and conclusions.
2 Galaxy formation models
To make predictions for the clustering of galaxies, we need a theoretical tool which can populate large cosmological volumes with galaxies. Furthermore, it is essential that we have well developed predictions for the properties of the model galaxies, in order that we can extract samples which match different observational selection criteria. Gas dynamic simulations currently struggle to meet both of these requirements. Such calculations demand high resolution which limits the accessible computational volume. Also, the level of sophistication of the model predictions in gas simulations is not always sufficient to make direct contact with observational quantities. Semi-analytical models, on the other hand, meet both of the above requirements and are therefore well suited to clustering studies (for an overview of this approach see Baugh 2006).
In the first half of this paper we consider predictions for galaxy clustering from three semi-analytical models, those of Bower et al. (2006), de Lucia & Blaizot (2007) and Font et al. (2008). These models are publicly available from the Millennium Galaxy Archive111 http://galaxy-catalogue.dur.ac.uk:8080/Millennium/. In the second part, we consider modifications to the Bower et al. model. We shall also refer to the Bower et al. and Font et al. models as the Durham models (and as Bower06 and Font08 respectively in figure labels) and to the de Lucia & Blaizot model as the Munich model (and as DeLucia07 in plots).
The three models listed above are set in the context of structure formation in a cold dark matter universe as modelled by the Millennium Simulation of Springel et al. (2005). The starting point is the merger histories of dark matter haloes, which are extracted from the simulation (note both groups have independent algorithms for constructing merger histories; see Springel et al. 2005 and Harker et al. 2006 for further details). The models follow a common range of processes which involve the baryonic component of the universe: gas cooling, star formation, reheating of cold gas by supernovae, chemical evolution of gas reservoirs, heating of the hot gas halo by AGN and galaxy mergers. The implementation of these processes differs in detail between the models and we refer the reader to the original references for a full description. Moreover, when setting the model parameters, different emphasis was placed on the reproduction of particular observational datasets. Here we simply remark on some key features of the models.
Bower et al. (2006) use the model of Malbon et al. (2007) to describe the growth of supermassive black holes through galaxy mergers, and the accretion of cold and hot gas. The latter process is the key to matching the sharpness of the break in the local optically selected galaxy luminosity function. The energy released by the accretion of hot gas onto the black hole is assumed to match the luminosity which would have been released by gas cooling, thereby suppressing the formation of bright galaxies (see Croton et al. 2006). The Font et al. (2008) model is a development of the Bower et al. model. Firstly, in the Font et al. model the stellar yield in all modes of star formation is twice that adopted in the Bower et al. model. This shifts the locus of the red and blue sequences in the colour magnitude relation into better agreement with local data from the Sloan survey (see Gonzalez et al. 2008 for a comparison of the predicted colour distributions with SDSS observations). Secondly, in the Font et al. model the stripping of the hot gas from newly accreted satellite galaxies is not assumed to be 100% efficient. This is different from the assumption commonly made in semi-analytical models and is motivated by the results of recent gas dynamics simulations carried out by McCarthy et al. (2008). This means that in the Font et al. model galaxies can continue to accrete cold gas even after they have been subsumed into a more massive halo. This results in an improved match to the observed colour distribution of satellite galaxies (Gonzalez et al. 2008). Both the Bower et al. and Font et al. models give very good matches to the stellar mass function over the full redshift range for which observational estimates are available.
The De Lucia & Blaizot (2007) model is a development of the semi-analytical models of Springel et al. (2001), De Lucia et al. (2004) and Croton et al. (2006). Luminosity and colour dependent clustering were discussed in Springel et al. (2005) and Croton et al. (2006); the De Lucia & Blaizot model gives similar clustering predictions to those from these earlier models.
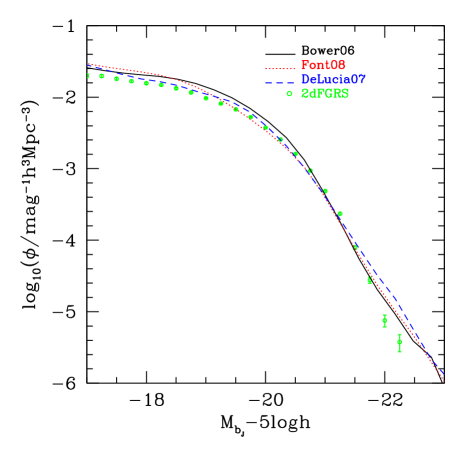
The parameters of the models are set to give a reasonable reproduction of the present day galaxy luminosity function, as shown by Fig. 1. In this paper we give ourselves the freedom to adjust the luminosities of the model galaxies, whilst maintaining the ranking of galaxy luminosity, to force an exact match to the 2dFGRS luminosity function measured by Norberg et al. (2002a). This small adjustment allows us to rule out abundance differences as a possible source of variations between the clustering predictions of different models. We apply the same methodology to the modified versions of the Bower et al. model discussed in the second part of the paper.
3 Predictions for luminosity dependent clustering
In this section we compare the predictions of the three galaxy formation models (Bower et al. 2006; De Lucia & Blaizot 2007; Font et al. 2008) with measurements of clustering made from the final two-degree field galaxy redshift survey (Norberg et al. 2009b). The observational data are presented in the form of the projected correlation function, . This statistic is estimated from the two point correlation function binned in pair separation parallel and perpendicular to the line of sight, :
| (1) |
When redshift is used to infer the radial distance to a galaxy, gravitationally induced peculiar motions on top of the Hubble flow cause a distortion to the inferred clustering signal. In principle, the projected correlation function is unaffected by the contribution from peculiar velocities. In practice, the integration in Eq. 1 has to be truncated at a finite value of as the clustering signal on larger scales becomes noisy. Norberg et al. (2009a) show that this truncation has a negligible effect on the form of the projected correlation function on scales below Mpc.
The observational measurements we use in this paper are from the final 2dFGRS. Previous results for the luminosity dependence of galaxy clustering were presented by Norberg et al. (2001,2002). These papers analysed an intermediate version of the 2dFGRS which consisted of around 160 000 unique, high quality galaxy redshifts. In the final version of the dataset used by Norberg et al. (2009) there are more than 220 000 galaxy redshifts. The solid angle of high spectroscopic completeness regions has also increased, by a larger factor than the change in the total number of redshifts. Hence a more accurate measurement of the clustering in different volume limited samples is now possible. The estimation of errors on the clustering measured for the different samples has also been revisited (Norberg et al. 2008). An internal estimate of the error is made using the bootstrap resampling technique. This has the advantage over the mock catalogues used previously that the change in clustering strength with luminosity is taken into account. The 2dFGRS is selected in the blue band. This is more sensitive to recent episodes of star formation in galaxies than the red band selection used in the SDSS.
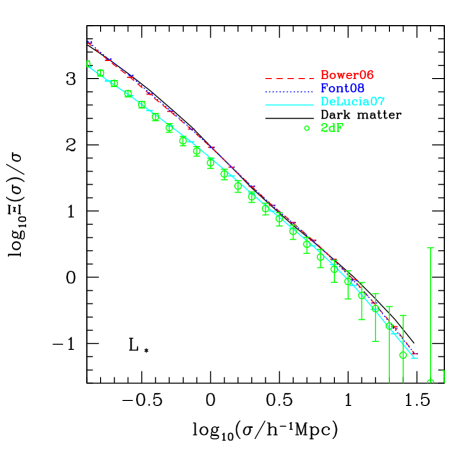
We first examine the clustering of galaxies. Fig. 2 compares the model predictions and the 2dFGRS measurement for the projected correlation function of galaxies, along with the projected correlation function of the dark matter in the Millennium Simulation. On large scales, Mpc, the models have a similar shape to the observations, but different amplitudes. The Durham models (Bower et al. and Font et al.) have a higher clustering amplitude than the data, but are similar to the dark matter. On small scales, Mpc, the Durham models are significantly above the 2dFGRS measurement. The De Lucia & Blaizot prediction is a remarkably good match to the clustering data over the full range of scales plotted. As we will see in the next section, the clustering predictions can be broken down into contributions from the most massive galaxy in each halo, referred to as the central galaxy, and satellite galaxies. The form of the projected correlation function on small scales is driven by the number of satellites in massive haloes. One interpretation of the comparison in Fig. 2 is that massive haloes in the Durham models contain more satellites relative to low mass haloes than in the Munich model. This would also account for the small difference between the predicted clustering amplitudes on large scales.
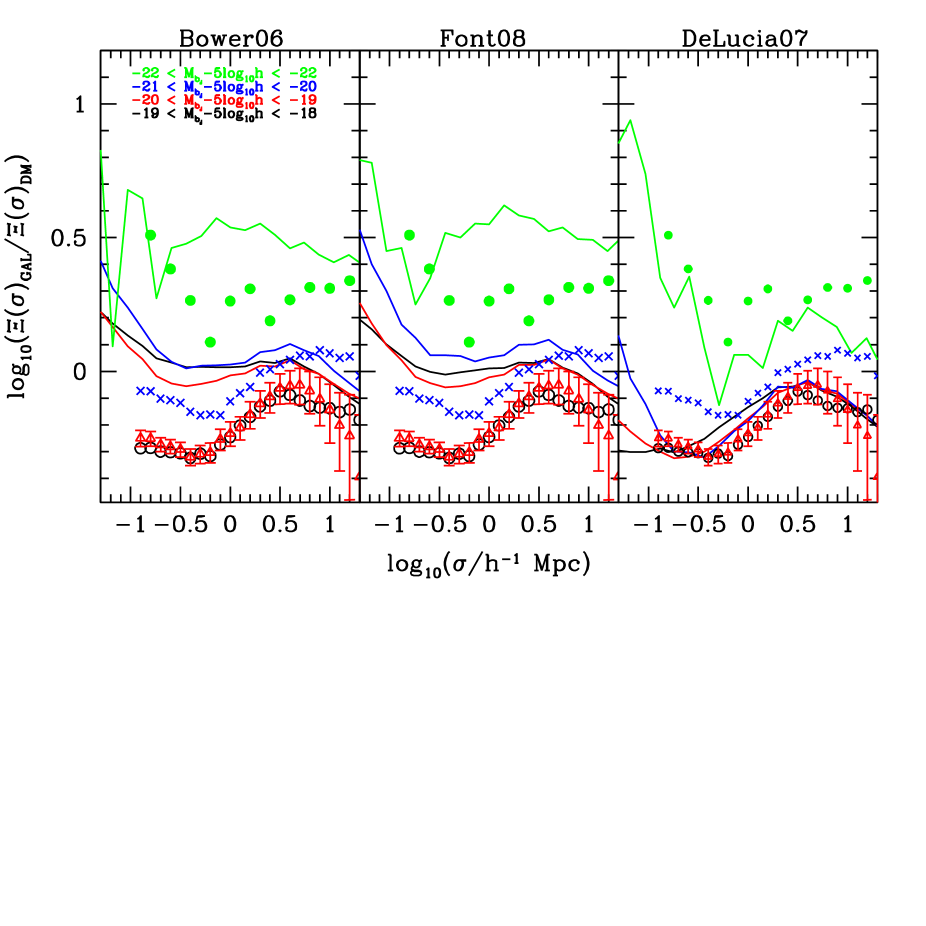
Over a range of just over two decades in projected pair separation, Fig. 2 shows that the clustering amplitude changes by four and a half orders of magnitude. In order to see more clearly the changes in the clustering amplitude with varying galaxy luminosity, in Fig. 3 we divide the galaxy correlation functions by the dark matter correlation function. If the Millennium Simulation dark matter was indeed a match to the real Universe, then the ratio plotted in Fig. 3 would be the logarithm of the square of the bias, albeit quantified in terms of projected clustering. The departure of this ratio from a constant value would then indicate the presence of a scale-dependent bias. However, it is of course possible that the Millennium Simulation is not quite representative of reality, with recent studies suggesting a lower value of the fluctuation amplitude (Sanchez et al. 2009; Li & White 2009). Nevertheless, the Millennium dark matter serves as a useful benchmark, even if these caveats limit the interpretation of the ratio.
The Durham models overpredict the clustering displayed by the brightest 2dFGRS galaxy sample, whereas the Munich model predicts weaker clustering for this sample. The Durham models overpredict the clustering displayed by the remaining, fainter luminosity samples. The Munich model comes closest to reproducing the trends seen in the data. As we commented earlier, the Munich model gives a very good match to the clustering measured for the sample. The amplitude of clustering in the magnitude bins either side of the sample hardly changes in the De Lucia & Blaizot model. The largest disagreement between that model and the 2dFGRS measurements occurs for the sample.
The correlation function ratios plotted in Fig. 3 show strong scale dependence. On the largest scales plotted, this could indicate that the clustering of dark matter in the Millennium cosmology is not the same as in the real Universe, as we remarked upon above. However, the 2dFGRS measurements become noisy on the scales on which one would expect the bias to approach a constant value (e.g. Coles 1993). On small scales there is a range of shapes and amplitudes, indicating a wide variety of satellite fractions in the different galaxy samples. Apart from the brightest sample, the Durham models show a higher clustering amplitude on small scales than the Munich model and also a higher amplitude than the observations. This suggests that there are too many satellite galaxies in haloes in the Durham models, a conclusion which we confirm in the next section.
4 What drives galaxy clustering?
In this section, we look at the clustering predictions in more detail to identify which galaxies determine the shape and amplitude of the correlation function. This will allow us to identify which model galaxies are responsible for the disagreement found with observational measurements in the previous section, and hence will motivate approaches to altering the model predictions for these objects.
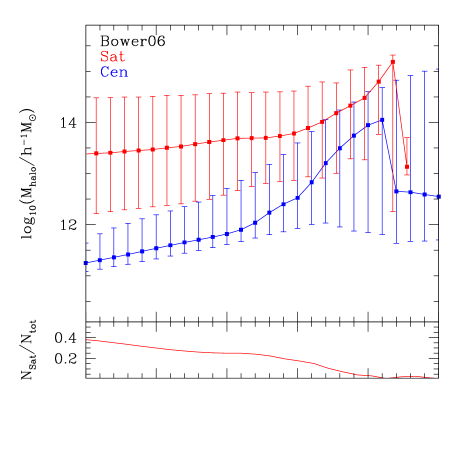
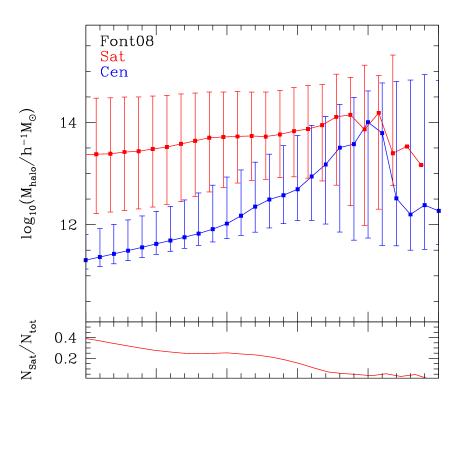
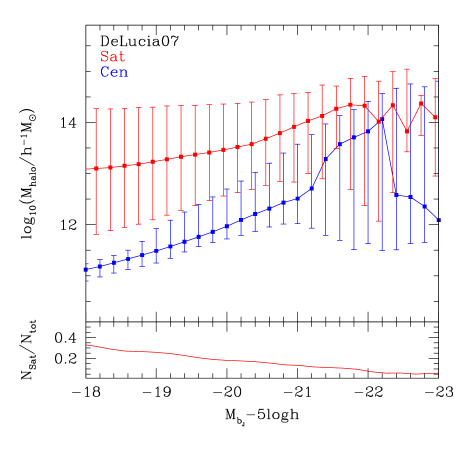
The clustering of dark matter haloes depends on their mass. Haloes which are more massive than the characteristic mass scale at a particular redshift (roughly the location of the break in the halo mass function) will be much more strongly clustered than the overall dark matter (Cole & Kaiser 1989; Mo & White 1996). We start by plotting the relation between galaxy luminosity and the mass of the host dark matter halo in Fig. 4. The main panel in each plot shows the median host halo mass and 10-90 percentile range of the distribution as a function of luminosity, for satellite and central galaxies separately. The sub-panel shows the fraction of galaxies that are satellites at each magnitude.
Overall, the host halo mass – galaxy luminosity relations for the different models share the same qualitative behaviour. There is a trend of increasing host mass with increasing central galaxy luminosity which steepens around . A magnitude brighter than this, the median host halo mass drops in each case. The scatter in host mass is small at the faintest luminosities plotted (around a factor of 2 in the de Lucia & Blaizot model), and increases with luminosity. For the brightest galaxies shown in Fig. 4, the 10-90 percentile range covers more than 2 orders of magnitude in halo mass. The median host mass of satellite galaxies does not increase with luminosity as quickly as it does for the centrals (an order of magnitude increase in host mass over the magnitude range , compared with two orders of magnitude for the centrals). The 10-90 percentile range is very broad for faint and intermediate luminosity satellites ( orders of magnitude) and shrinks only for the brightest satellites.
The quantitative differences between the models in Fig. 4 explain the differences in the predictions for luminosity dependent clustering evident in Fig. 3. Firstly, the median host mass relations for the central and satellite galaxies in the de Lucia & Blaizot model are lower than those in the Bower et al. and Font et al. models. This means that the overall amplitude of clustering is lower in the de Lucia & Blaizot model as seen in Fig. 3. Secondly, the scatter in the mass – luminosity relation for centrals is substantially smaller in the Munich model than it is in the Durham models, particularly for fainter galaxies. This means that the halo mass – luminosity relation is better defined in the Munich model compared with the Durham models, which explains the somewhat stronger trend of luminosity dependent clustering displayed in the Munich model.
The difference in the width of the distribution for the central galaxies could be driven by the choice of time over which gas is allowed to cool in a halo. In the Munich model, gas is allowed to cool over a dynamical time. In the Durham models, the cooling time depends upon the merger history of the individual trees. For haloes of a given mass, there will therefore be a range of cooling times in the Durham models, but a fixed cooling time in the Munich model.
The subpanels in each part of Fig. 4 show the fraction of satellite galaxies as a function of luminosity. For all the models, the fraction declines to brighter magnitudes. Due to the wide range of halo masses occupied by satellites, and the strong dependence of bias or clustering strength on halo mass, it is possible for satellites to make an important contribution to the overall clustering signal, even if they are outnumbered by centrals. We investigate this point in more detail next in this section. than in the Munich models. Furthermore, there is a plateau in the satellite The fraction of satellites in the Durham models is somewhat higher fraction for intermediate luminosities in the Durham model which is not present in the Munich models. This suggests that we should focus on reducing the number of satellite galaxies in order to improve the Durham model predictions for luminosity dependent clustering.
An alternative way to present the information contained in the host mass – luminosity plot is the halo occupation distribution (HOD; for a review see Cooray & Sheth 2002). The HOD gives the mean number of galaxies as a function of dark matter halo mass, divided into the contribution from central and satellite galaxies. The HOD has the advantage over the host halo mass – galaxy luminosity plot that it can be more directly related to galaxy clustering (e.g. Benson et al. 2000; Berlind et al. 2003).
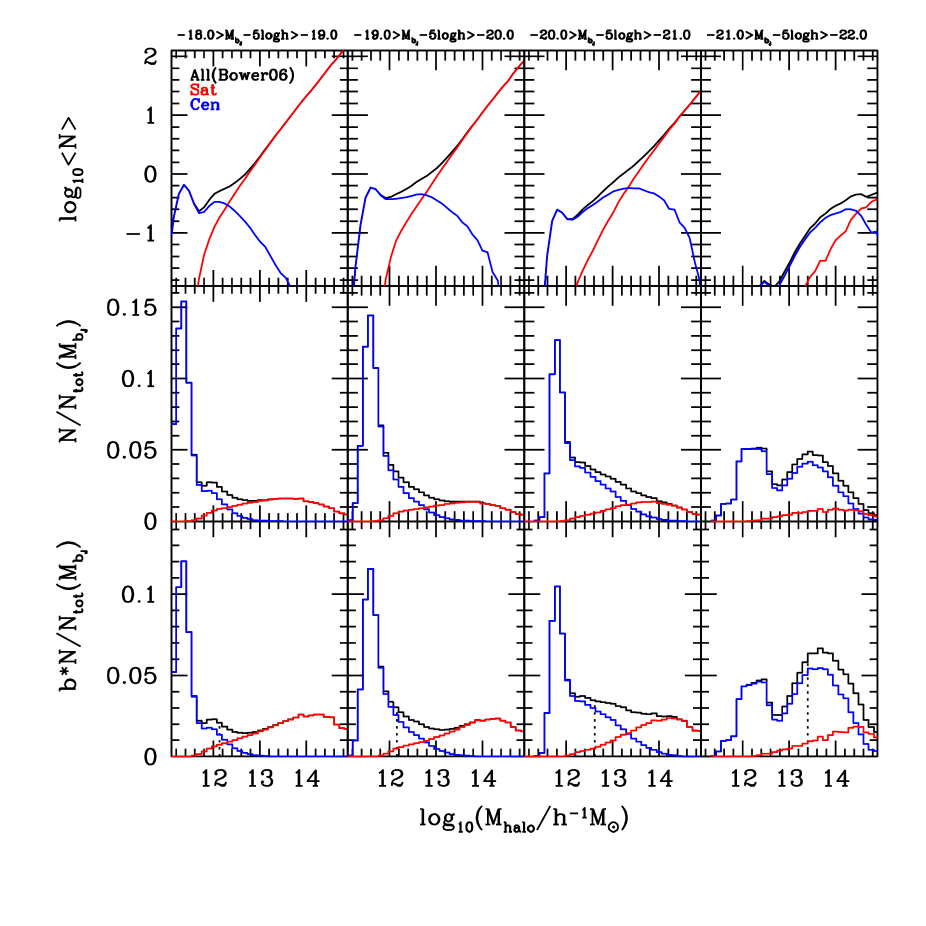
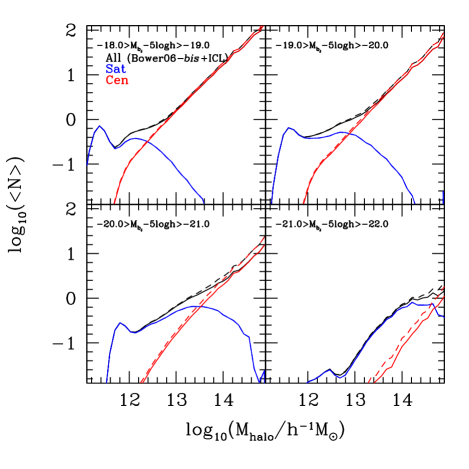
The HOD for the Bower et al. model is shown in the top row of Fig. 5, in which each column shows the HOD for galaxies in a different bin in absolute magnitude. The bins are one magnitude wide, whereas in the majority of cases in the literature, cumulative bins are used. The generic form adopted for the HOD is a step function for central galaxies, which makes the transition from 0 to 1 galaxies per halo at some halo mass threshold, which is determined by the galaxy selection (e.g. Zehavi et al. 2002). More gradual forms for the transition from 0 to 1 galaxy per halo have been discussed (Zheng et al. 2005). The HOD for satellites is assumed to be a power-law with slope ; the mean number of satellites per halo reaches unity at a somewhat higher halo mass than that at which the mean number of central galaxies first approaches unity. The satellite galaxy HOD for the Bower et al. model agrees with the standard HOD paradigm. The central galaxy HOD, on the other hand, has a richer structure. The downturn seen at high masses is due to the adoption of a differential, finite width magnitude bin. With increasing halo mass, the central galaxies eventually become too bright to be included in a particular magnitude bin. For all the luminosity bins plotted, the HOD of central galaxies does not reach unity, in contradiction to one of the primary assumptions in HOD modelling. The central HOD rises to a peak just below unity, before showing a dip with increasing halo mass. This feature is due to AGN heating which suppresses gas cooling above at the present day in this model. This spike has a similar appearance in the Font et al. model, even though the “switch-on” of AGN heating feedback is handled in a more gradual way in this case.
The HOD does not tell us the full story about galaxy clustering, but is only the first step. The next relevenat consideration is the abundance of dark matter haloes. The number density of haloes declines exponentially with increasing mass beyond the characteristic mass (see for example Jenkins et al. 2001). The HOD weighted by the halo mass function is shown in the second row of Fig. 5. Note that we have now switched to a linear scale on the y-axis. The contribution of satellite galaxies is now much less important than the impression gained from the HOD plot. Next, in the bottom row of Fig. 5 we plot, as a function of halo mass, the HOD multiplied by the halo mass function and the bias factor. Again, a linear scale is used for the y-axis. The area under the black curve in this case gives the effective bias of the galaxy sample. The satellites make a larger contribution to the effective bias than they do to the number density. This is because the satellites are preferentially found in high mass haloes which have large bias factors.
5 An empirical solution to the problem of luminosity dependent clustering
In this section we find an empirical solution to the problem of matching the observed luminosity dependence of clustering. We do this by changing the HOD of the Bower et al. model by hand. We could equally well have chosen to use the Font et al. model and would have reached similar conclusions. We saw in the previous section that the HOD for central galaxies has a complicated shape which is not well described by the standard HOD parametrizations. This is, in part, due to the physics invoked in the models and to the use of differential rather than cumulative luminosity bins. The satellite galaxy HOD, on the other hand, has a more straightforward power law form, , where is the host halo mass. Moreover, we saw in the previous section that the Durham models have more satellite galaxies than the Munich model and that this could be the reason behind their poorer match to the observed clustering. Here, we establish how the satellite HOD must be changed in order to match the 2dFGRS results better. This will help guide an investigation into changing the physics of the galaxy formation model which is carried out in the next section.
The satellite HOD for the Bower et al. model plotted in Fig. 5 has a power law form with slope in each of the luminosity bins. We note that the same slope is generally found for other galaxy selections, such as luminous red galaxies (Almeida et al. 2008; Wake et al. 2008).
The starting point to make a realization of galaxy clustering is the DHalo222http://galaxy-catalogue.dur.ac.uk:8080/Millennium/ catalogue of dark matter halo masses and positions constructed from the Millennium simulation (Harker et al. 2006). This is the halo catalogue used in the GALFORM model and is somewhat different from the list of haloes generated by the friends-of-friends group finding algorithm. The DHalo catalogue is constructed with reference to the merger histories of the dark matter haloes. In the case of a friends-of-friends merger history, it is possible, occasionally, for the mass of a halo to decrease with increasing time. This happens, for example, when two haloes are either extremely close or overlap to some extent at one timestep, but move apart and are identified as separate haloes at a subsequent output time. The DHalo algorithm “looks ahead” to check if haloes merged by the group finder at one output time stay merged at the next two outputs.
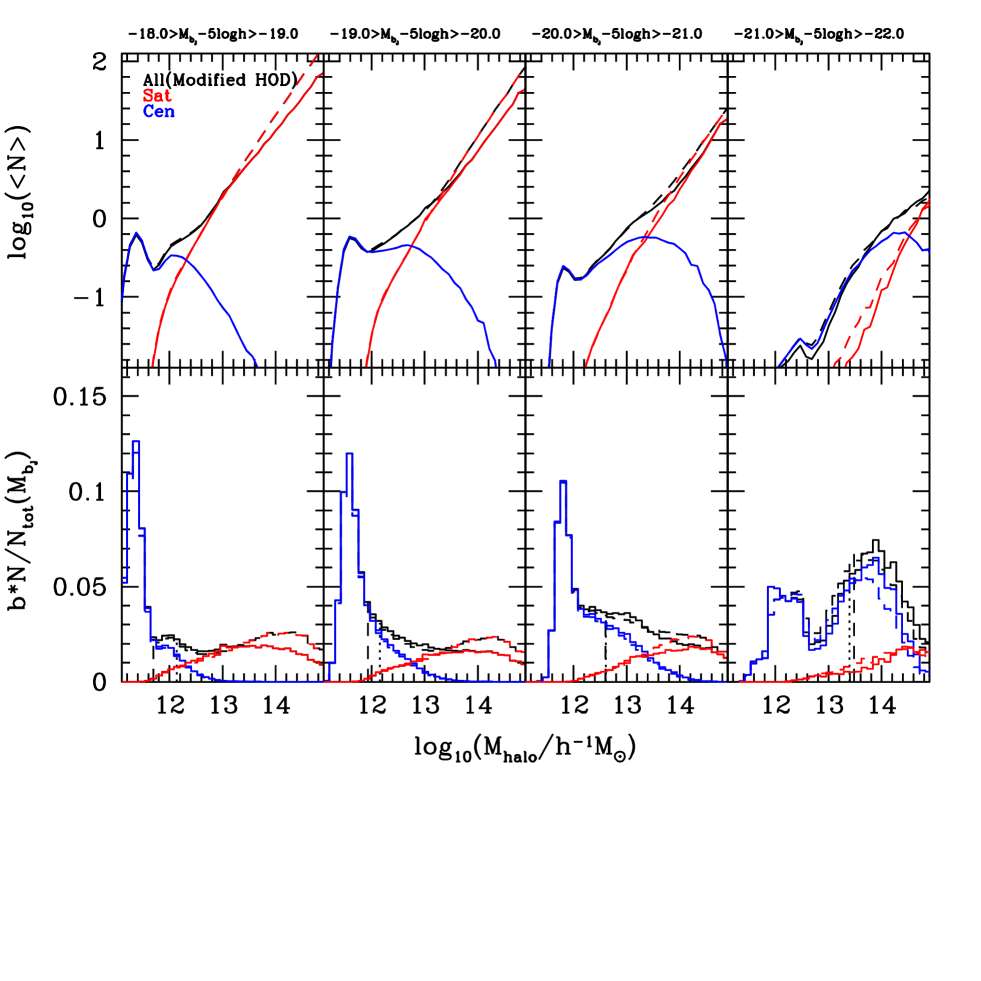
Keeping the same mass at which the mean number of satellites per halo reaches unity as predicted by the fiducial Bower et al. model, we allow the slope of the satellite HOD to vary for each magnitude bin in order to obtain a better match to the 2dFGRS clustering data. The number of galaxies as a function of halo mass is assumed to have a Poisson distribution for . For halo masses for which the HOD predicts , a fraction of haloes is populated with a satellite galaxy at random: i.e. if the random number chosen from a uniform distribution between zero and one, , then the halo is assigned a satellite, otherwise it has no satellite. We have tested that this procedure can reproduce the clustering in the Bower et al. model when the Bower et al. HOD is used.
The modified HOD derived as described above is shown by the solid lines in Fig. 6. The HOD of the original Bower et al. model is shown by the dashed lines in this plot. In the three faintest luminosity bins, the slope of the modified satellite HOD is shallower than the original i.e. , corresponding to a reduction in the number of satellites in massive haloes. The change in slope is largest in the faintest bin. In the brightest luminosity bin, the trend is reversed and there are slightly more satellites in massive haloes in the modified HOD. By reducing the number of satellites in high mass haloes, two effects are generated in the correlation function. The effective asymptotic bias of the sample is reduced, due to a smaller two-halo clustering term. Also, the one-halo term is suppressed, reducing clustering on small scales, as there are fewer pairs of galaxies within massive haloes. By contrast with the modified HOD, as we remarked upon above, the HOD of the Bower et al. model exhibits the same value of the slope of the satellites in each luminosity bin.
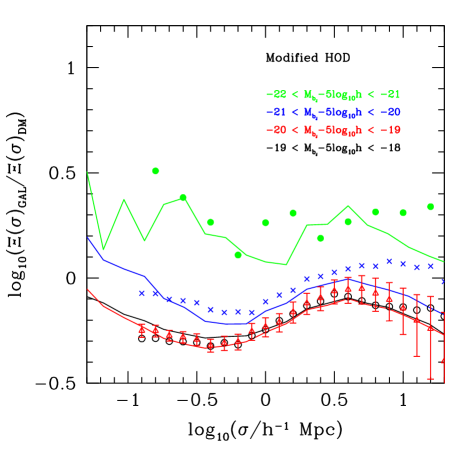
Fig. 7 shows that the trend of clustering strength with luminosity displayed by the modified HOD matches that of the 2dFGRS data. Furthermore, the improved level of agreement is seen on both large and small scales. The matching of the asymptotic bias on large scales and the shape of the correlation function on small scales is convincing evidence in support of the modified HOD having the correct number of satellite galaxies in haloes of different masses. The challenge now is to see if the semi-analytical model can reproduce the form of the modified HOD, either by further exploration of the model parameter space or by adding new physical processes.
6 Implications for satellite galaxies in galaxy formation models
In the previous section we demonstrated that the clustering properties of the Bower et al. model can be significantly improved if the number of satellite galaxies in massive haloes is reduced. This was achieved by changing the HOD of the Bower et al. model by hand. The clustering predictions subsequently changed on all scales (in HOD terminology, both the one and two halo contributions were changed) to improve the match with the 2dFGRS measurements, which can only be achieved by changing the number of satellites. In this section we try to reproduce the modified HOD in a physical, rather than empirical, way by using the GALFORM model.
The first approach we tried was to run variants of the Bower et al. model in which selected parameters were perturbed from their fiducial values. In particular, we varied parameters which we thought would have an impact on the relation between galaxy luminosity and host halo mass, as plotted in Fig. 4. These included the strength of supernova feedback, the degree of suppression of gas cooling in massive haloes due to AGN heating and the timescale for galaxy mergers. In the case of each of these variant models, we rescaled the model galaxy luminosities to agree exactly with the observational estimate of the luminosity function from Norberg et al. (2009). The clustering predictions in the variants were different to those of the original Bower et al. model. However, none was able to match the observed clustering. Intriguingly, the slope of the satellite HOD was in all of the models, that is none of the parameter variations was able to change the slope of the satellite HOD in the way suggested by the modified HOD.
The second approach we tried was to change the timescale for galaxies to merge due to dynamical friction. GALFORM uses a modified version of the timescale given by the dynamical friction formula of Chandrasekhar (1943; see eqn. 4.16 of Cole et al. 2000). We experimented with adjusting this timescale by allowing an extra scaling based on the ratio of the host halo mass to the mass of the satellite, . To solve the problem of too many satellites we needed to reduce the merger timescale for . Recent numerical studies of satellite mergers found that the Chandrasekhar formula needs to be revised but in the opposite sense, i.e. with a somewhat longer merger timescale for objects with (Jiang et al. 2008, 2009). Hence this approach, although viable, was abandoned as requiring an unrealistic change to the prescription for calculating the timescale for galaxy mergers.
In this section, we explore the incorporation of two physical processes into the GALFORM semi-analytical model: the tidal disruption or stripping of mass from satellite galaxies and mergers between satellites. The implementations presented here are exploratory and are meant to give an indication of the likely impact of the new physics on the model predictions. If the changes turn out to be promising, the intention is that this should motivate future, fully self-consistent revisions to the GALFORM machinery.
6.1 The dissolution of satellite galaxies
Galaxy clusters contain a diffuse background of light, the intracluster light (ICL), which is not associated with any particular galaxy (e.g. Welch & Sastry 1971). The ICL is thought to result from the disruption of small galaxies and the stripping of stars from larger ones. The measurement of the intracluster light is challenging. Current estimates put the ICL in the range of 5-30% of the total cluster light (Zibetti et al. 2005; Krick & Bernstein 2007; Zibetti 2008).
A number of physical processes could be responsible for the removal of stars from satellite galaxies e.g. tides produced by the cluster potential and successive high speed fly-by encounters between cluster members (Richstone 1976; Aguilar & White 1985). A full treatment of these effects would require a dynamical simulation (e.g. Moore et al. 1996; Gnedin 2003). Attempts have been made to implement analytic descriptions of the phenomena modelled in the simulations into galaxy formation models (e.g. Taylor & Babul 2001; Benson et al. 2004; Yang et al. 2009).
In general, standard semi-analytical galaxy formation codes ignore the tidal disruption of satellite galaxies. A recent exception is the calculation of Henriques, Bertone & Thomas (2008). These authors post-processed the output of the Munich group’s semi-analytical model to remove galaxies that they believed should have been tidally disrupted. Galaxies are associated with the dark matter halo in which they first formed as a central galaxy. When this halo merges with a more massive halo, it becomes a satellite halo or substructure, and is stripped of mass through dynamical effects. Eventually, the substructure may fall below the resolution limit of the N-body simulation (in this case the Millennium Simulation). Henriques et al. removed satellites whose host dark matter substructure had dissolved, and added these to the ICL. They found that by adopting this procedure, the model predictions agreed better with the slope of the faint end of the luminosity function and the colour distribution of galaxies. However, this algorithm depends on the resolution of the N-body simulation, which governs when subhalos are destroyed. Moreover, the softening length adopted in the simulation exceeds the scale size of all but the very brightest galaxies. Hence, it is not clear that any of the more condensed baryonic material would have been stripped from the model galaxies, even when the host dark matter halo has been shredded.
Here we adopt a simpler approach which is independent of the resolution of the N-body simulation. We assume that the degree of disruption of a satellite galaxy depends on the ratio of the mass of the main dark matter halo to the mass of the satellite halo at infall, :
| (2) |
where is the original luminosity of the satellite galaxy predicted by the galaxy formation model, is the new luminosity intended to take into account stripping of mass from the satellite and is an adjustable parameter. We chose this scaling of disrupted luminosity fraction because the galaxy merger timescale essentially scales with the mass ratio ; objects with large values of will spend longer orbiting within the host dark matter halo and are therefore more susceptible to dynamical disruption. Our satellite disruption prescription involves post-processing the output of the galaxy formation model, to reduce the luminosity of satellite galaxies according to Eq. 2. One clear shortcoming of our approach is that we do not take into account the time when the satellite galaxy actually fell into the more massive halo. With our prescription, a satellite could suffer a large luminosity reduction immediately after falling into a larger structure. On the other hand, we ignore any stripping which may have occurred at earlier stages in the merger history. Hence it is not clear whether our simple model for the disruption of satellites is likely to be an over or underestimate of the actual effect.
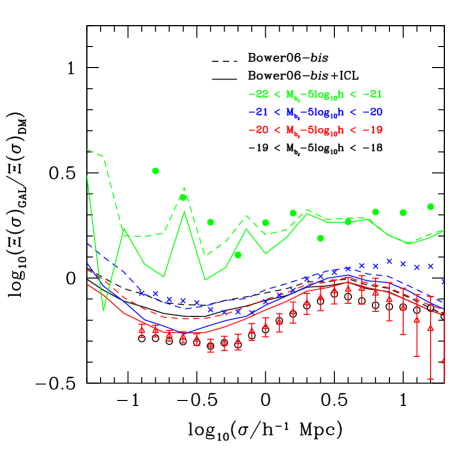
The Millennium Archive does not list the satellite galaxy dark halo mass for the Bower et al. model. Hence, it was necessary for us to re-run the Bower et al. model in order to extract the information required to apply the model described by Eq. 2. We present the results of rerunning the Bower et al. model, labelled Bower06-it bis, without applying any dynamical disruption, in Fig. 8 in which we show the HOD and in Fig. 9, where we compare the predicted clustering with the 2dFGRS measurements. A comparison of the results presented in these plots with the equivalent results for the version of the Bower et al. model available from the Millennium Archive (Figs. 5 and 3 respectively) shows a subtle but appreciable change in the model predictions. The re-run version of the Bower et al., which we refer to as Bower06-bis, is actually in better agreement with the 2dFGRS clustering results than the Millennium Archive version. The main reason for these differences are small improvements in the model. There has been substantial code development in the three years since the Bower et al. model was originally placed in the Millennium Archive, to incorporate new physical ingredients and to improve the implementation of other processes. Also, improvements have been made to the construction of the dark matter halo merger histories from the Millennium (J. Helly, private communication). The re-run Bower et al. model is available in the Millennium archive as Bower06-bis. As we shall see, the changes to the clustering predictions arising from the implementation of new physical processes are, in any case, larger than those between Bower et al. and Bower06-bis.
The HOD resulting from applying the satellite disruption model of Eq. 2 is compared with the Bower06-bis model in Fig. 8. The free parameter in the stripping model was set to to produce the best match to the clustering measurements, as plotted in Fig. 9. As expected, Fig. 8 shows that there are fewer satellites in the model with disrupted satellites. The effect appears largest in the brightest luminosity bin. This is primarily due to the imposed change in the shape of the luminosity function, rather than to a shift in the typical value of for each galaxy sample. In the brightest bin, since the abundance of galaxies drops exponentially with luminosity, more galaxies are shifted out of the bin in the faintwards direction, after applying the disruption recipe, than are shifted into that bin from brighter luminosities. The change in the HOD generated by applying the satellite disruption model falls short of the target suggested by the modified HOD derived in the previous section. In the intracluster light model, the slope of the satellite HOD is essentially unchanged and the biggest variation in the number of satellites is found in the brightest luminosity bin rather than the faintest. The resulting clustering predictions do not change in the desried way, as shown by Fig. 9. Rather than altering the luminosity dependence of clustering, the main effect of disrupting satellites is to reduce the clustering amplitude in all the luminosity bins.
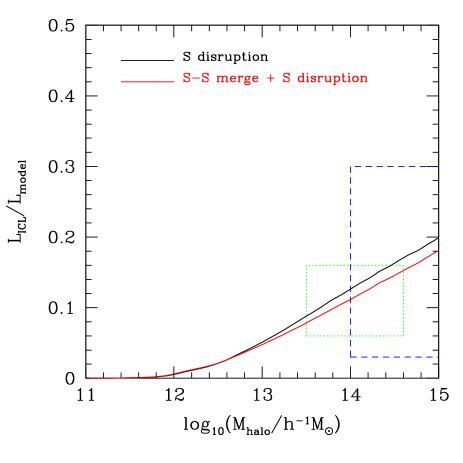
We close this section by showing the model prediction for the fraction of the total light in a cluster that is in the form of a diffuse intergalactic background. Fig. 10 shows that the satellite disruption model removes at most 20% of the total cluster light from galaxies, in excellent agreement with the observational estimate from Zibetti (2008). This agreement is encouraging as the parameter in the satellite disruption model was set without reference to the constraint on the background light, but was chosen to improve the match to the observed clustering.
6.2 Mergers between satellite galaxies
Semi-analytical models typically only consider the merger of satellites with the central galaxy in a halo. In general, a timescale is calculated analytically for the orbit of the satellite to decay due to dynamical friction. If this timescale is shorter than the lifetime of the host dark matter halo, then the satellite is assumed to merge with the central galaxy. When a halo merges with a larger structure, the galaxies in the smaller halo are assumed to become satellite galaxies orbiting the new central galaxy. The satellites retain no memory of the fact that they were once members of a common halo. New dynamical friction timescales are calculated for each satellite.
With the advent of ultra-high resolution N-body simulations, there is now convincing evidence that this simple picture is incomplete (Springel et al. 2008; Angulo et al. 2008; Wetzel, Cohn & White 2009). The simulations reveal that, following a merger, the subhaloes of the lower mass halo often remain as a distinct unit, orbiting coherently in the new main subhalo. Indeed, several levels of subhalo hierarchy have been uncovered. By tracing the evolution of the subhaloes in these simulations, their ultimate fate can be determined. A large fraction of the high mass subhaloes which undergo a merger coalesce with the main subhalo of the new halo. However, the probability of a merger with a subhalo other than the main subhalo increases with decreasing subhalo mass. At , Angulo et al. (2008) found that subhaloes with 1% or less of the total mass of the main subhalo were as likely to merge with another subhalo as with the main subhalo. Rather than merging with a random subhalo, the merger is with another subhalo which shared a common parent halo. A merger which started before this parent halo was subsumed by the main halo is being completed inside the new halo.
We added satellite-satellite mergers to GALFORM by modifying the prescription for galaxy mergers. Guided by the results obtained by Angulo et al. for the Millennium Simulation, we modified the calculation of the galaxy merger timescale. Depending on the mass ratio, , and the redshift, we allowed a fraction of satellite galaxies to be considered for satellite-satellite mergers (see figure 5 of Angulo et al.). We did this by considering the last but one level of the halo merger history i.e. the progenitor haloes of the present day halo. For a selected satellite in the progenitor halo, we asked if there would be sufficient time for this object to have merged with the central galaxy in the progenitor by the present day, rather than by the end of the lifetime of the progenitor. This is equivalent to allowing the merger to continue in the substructure after it becomes part of the larger halo. If there is sufficient time, then we merge the satellite with the central galaxy of the progenitor at the end of the progenitor’s lifetime. This means that the merger happens sooner than it would do in practice. If there is a burst of star formation associated with the merger, then this burst will also happen earlier than it should have done. However, in the Bower et al. model there is relatively little star formation in bursts at low redshift. Our scheme does, however, reproduce the number of satellite-satellite mergers implied by the subhalo mergers in the Millennium Simulation.
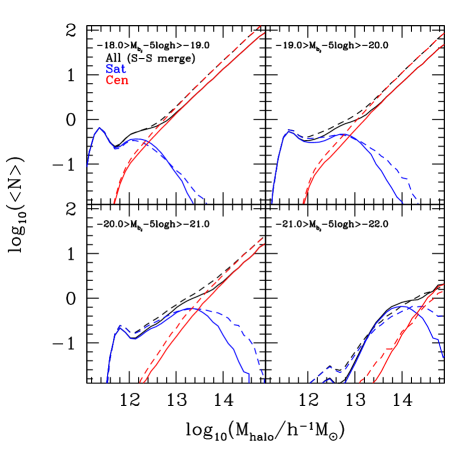
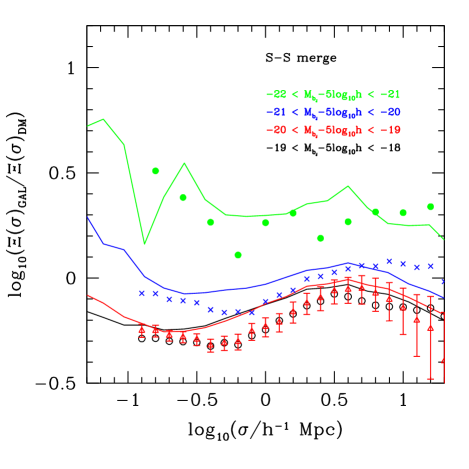
By allowing satellite-satellite mergers, we are able qualitatively to reproduce the changes suggested by the empirically determined modified HOD, as shown in Fig. 11. There are two main reasons for the change in the HOD. Firstly, satellite-satellite mergers reduce the number of satellite galaxies in the model. Secondly, the number of low luminosity satellite galaxies in high mass haloes is reduced because these objects can merge with other satellites; the remnant is also a satellite but it is, of course, brighter than its progenitors. The HOD for central galaxies also changes, with the central galaxies in more massive haloes becoming brighter (and hence moving into a brighter luminosity bin). This is because satellites which have experienced satellite-satellite mergers are more massive than they would have otherwise been and therefore have a shorter dynamical friction timescale. The clustering predictions for the model with satellite-satellite mergers are shown in Fig. 12. The model now matches the sequence of luminosity dependent clustering measured in the 2dFGRS, albeit with slightly higher clustering amplitudes overall.
6.3 The kitchen sink model
In the previous two subsections we have seen that the satellite disruption and satellite-satellite merger models have appealing features. The satellite disruption model can change the overall amplitude of the clustering for different luminosity samples, whereas the satellite-satellite merger model can reproduce the observed trend of clustering strength with luminosity if not the precise amplitude. In isolation, neither model offers a fully satisfactory solution to the problem of matching the luminosity dependent clustering seen in the 2dFGRS. It seems desirable therefore to implement both effects in tandem. We do this by generating a model which incorporates satellite-satellite mergers and post-processing the resulting satellite luminosities using the disruption model of Eq. 2.
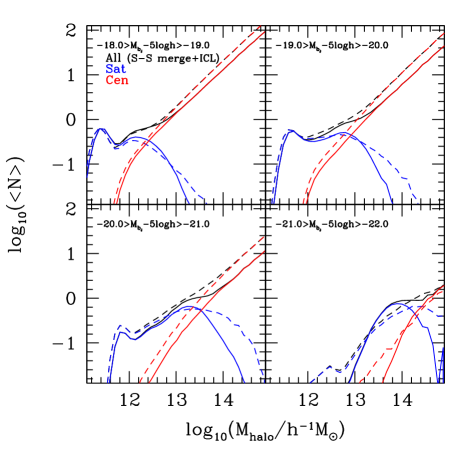
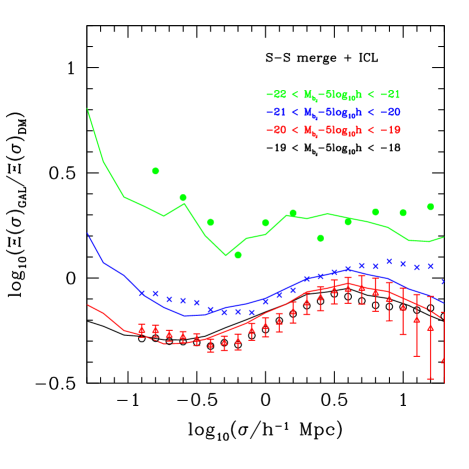
Fig. 14 shows the projected correlation functions predicted by the hybrid model. The model predictions are now in remarkably good agreement with the 2dFGRS measurements. The model matches the amplitude of clustering, the trend and strength of the luminosity dependence of clustering and the shape of the correlation functions. The HOD of this model matches the form of the reference empirical HOD as shown in Fig. 13. The slope of the satellite HOD in the hybrid model is influenced by satellite-satellite mergers, whereas its amplitude is determined by satellite disruption.
Fig. 10 shows how the predicted intracluster light in the hybrid model with satellite disruption and satellite-satellite mergers compares with the Bower06-bis model. Again, the amount by which the plotted halo luminosity ratio deviates from unity shows the fraction of the total light is not attached to galaxies. The fraction of intracluster light depends on halo mass and is in very good agreement with the observational estimates by Zibetti (2008).
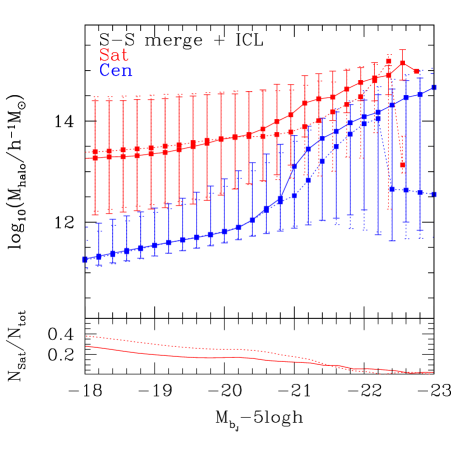
Fig. 15 shows the relation between host halo mass and galaxy luminosity in the hybrid model. Compared with the Bower et al. and Font et al. models, there is relatively little difference in the median halo mass for either satellite or central galaxies; the changes in the median mass are of the order of 0.1dex. However, the host halo masses of satellite galaxies are large and thus these haloes are highly biased. A small change in the typical host mass will therefore produce an appreciable change in the predicted bias. The key difference is in the fraction of galaxies that are satellites as a function of magnitude, shown in the lower panel of Fig. 15. The number of satellites in the hybrid model is down by almost a factor of two from that in the original Durham models.
7 Summary and Conclusions
The dependence of galaxy clustering on luminosity has been measured with high accuracy in the local Universe by the 2dFGRS and SDSS (Norberg et al. 2001, 2002; Zehavi et al. 2002, 2005; Jing & Borner 2004; Li et al. 2006). We have shown that the current “best bet” publicly available galaxy formation models only match the observational results in a qualitative sense. These models fail to match the trend of clustering strength with luminosity. We have demonstrated that the reason for the discrepancy is that the models predict too many satellites in massive haloes. Li et al. (2007) reached a similar conclusion comparing the clustering of galaxies in the red selected SDSS with the semi-analytical models of Kang et al. (2005) and Croton et al. (2006).
Li et al. (2007) showed that the match to the observed clustering could be improved if of the satellite galaxies were removed from the catalogues generated from the semi-analytical models. Li et al. did this by hand without any reference to the mass of the host dark matter halo. This is equivalent to changing the normalization of the halo occupation distribution for satellites, without altering the slope. In this paper, we first changed the HOD of satellites by hand and found that the agreement with the observed clustering could be improved by changing the slope of the satellite HOD. For galaxy samples close to , satellites have to be preferentially removed from more massive dark matter haloes.
Out of the semi-analytical models we considered in this paper, the de Lucia & Blaizot (2007) model came closest to reproducing the observational clustering measurements. This was also the model with the smallest number of satellites. However, it is not clear to what extent this feature is due to approximations used in the model (e.g. the adoption of the dynamical time as the time over which gas is allowed to cool). In any case, even this model fails to reproduce the full dependence of clustering on luminosity.
We next tried to remove satellite galaxies from massive haloes in the Durham semi-analytical models by perturbing the values of the parameters which control certain processes, such as supernova feedback, the suppression of gas cooling by AGN heating and galaxy mergers. When running a variant model, the predicted luminosity function often changes. To ensure that changes in the clustering predictions were robust to the requirement that a model should reproduce the observed galaxy luminosity function, we rescaled the model luminosity functions to agree exactly with the observations. We were unable to find an improved model within the existing framework, which suggests that additional physical processes which mostly affect satellite galaxies need to be considered.
The Durham models have recently been revised as regards the treatment of gas cooling in satellites (Font et al. 2008). Satellite galaxies can now retain some fraction of the hot halo associated with them at infall. The precise fraction depends upon the orbit of the satellite. This improvement of the gas cooling treatment alters the colours of faint satellites in groups and clusters. The galaxies we consider in this paper are brighter by comparison and there is little change in the clustering predictions of the Font et al. model compared with those from its predecessor, the Bower et al. (2006) model.
In this paper, we considered two processes which are not currently included in most galaxy formation models: mergers between satellite galaxies and the tidal disruption of satellites. The first of these processes is motivated by recent high resolution simulations of the formation of dark matter haloes which show that hierarchies of substructures persist (Diemand et al. 2008; Springel et al. 2008). Mergers which started in a progenitor halo can run to completion in the descendant halo. The disruption of satellites has been modelled analytically in the Durham model in a study of the heating of the Milky Way’s disk (Benson et al. 2004). Here, we applied a simple prescription to remove luminosity from satellites based on the ratio of the host halo mass to the mass of the halo in which the satellite formed, which is related to the timescale for the satellite’s orbit to decay through dynamical friction. Applying the model for the disruption of satellites changes the overall amplitude of clustering without improving the trend of clustering strength with luminosity. Including mergers between satellites, on the other hand, does alter the predictions for the luminosity dependence of clustering. By applying both extensions together, we are able to obtain a significantly improved match to the 2dFGRS measurements (Norberg et al. 2009). The hybrid model matches the observational constraints on the amount of intracluster light.
The differences between the clustering predictions of current galaxy formation models and observations are small. However, the differences can be measured robustly and will become even more apparent when larger surveys become available. These discrepancies limit the usefulness of the models in the construction of mock catalogues needed for the exploitation of future galaxy surveys and suggest the need for new physical processes to be incorporated into the models. The revisions to the galaxy formation models we propose in this paper are simplistic and are merely intended to highlight promising areas where the models need to be developed in the future, in a self consistent way.
Acknowledgments
HSK acknowledges support from the Korean Government’s Overseas Scholarship. CSF acknowledges a Royal Society Wolfson Research Merit Award. This work was supported in part by a grant from the Science and Technology Facilities Council. We acknowledge helpful conversations with Peder Norberg, Enrique Gaztañaga and Darren Croton; we also thank Peder Norberg for supplying data in electronic form in advance of publication.
References
- [1] Aguilar L.A., White S.D.M., 1985, ApJ, 295, 374
- [2] Almeida C., Baugh C. M., Wake D. A., Lacey C. G., Benson A. J., Bower R. G., Pimbblet K., 2008, MNRAS, 386, 2145
- [3] Angulo R.E., Lacey C.G., Baugh C.M., Frenk C.S., 2008, arXiv0810.2177
- [4] Baugh C. M., 2006, Reports on Progress in Physics, 69, 3101
- [5] Benson A. J., Cole, S., Frenk C. S., Baugh C. M., Lacey C. G. 2000, MNRAS, 311, 739
- [6] Benson A. J., Bower R. G., Frenk C. S., Lacey C. G., Baugh C. M., Cole S., 2003, ApJ, 599, 38
- [7] Benson A. J., Lacey C. G., Frenk C. S., Baugh C. M., Cole S., 2004, MNRAS, 351, 1215
- [8] Berlind A. A., Weinberg D. H., 2002, ApJ, 575, 587
- [9] Berlind A. A., Weinberg D. H., Benson A. J., Baugh C. M., Cole S., Dav R., Frenk C. S., Jenkins A., et al., 2003, ApJ, 539, 1
- [10] Bower R. G., Benson A. J., Malbon R., Helly J. C., Frenk C. S., Baugh C. M., Cole S., Lacey C. G., 2006, MNRAS, 370, 645
- [11] Chandrasekhar S., 1943, ApJ, 97, 255
- [12] Cole S. 1991, ApJ, 367, 45
- [13] Cole S., Lacey C. G., Baugh C. M., Frenk C. S., 2000, MNRAS, 319, 168
- [14] Cole S., Norberg P., Baugh C. M., Frenk C. S., Bland-Hawthorn J., Bridges T., Cannon R., Colless M., et al., 2001, MNRAS, 326, 255
- [15] Cole S., Percival W. J., Peacock J. A., Norberg P., Baugh C. M., Frenk C. S., Baldry I., Bland-Hawthorn J., et al., 2005, MNRAS, 362, 505
- [16] Cole S., Kaiser N., 1989, MNRAS, 237, 1127
- [17] Coles P., 1993, MNRAS, 262, 1065
- [18] Colless M., Dalton G., Maddox S., Sutherland W., Norberg P., Cole S., Bland-Hawthorn J., Bridges T., et al., 2001, MNRAS, 328, 1039
- [19] Cooray A., Sheth R., 2002, Physics Reports, 372, 1
- [20] Croton D. J., Springel V., White S. D. M. et al., 2006, MNRAS, 365, 11
- [21] De Lucia G., Kauffmann G., White S. D. M., 2004, MNRAS, 349, 1101
- [22] De Lucia G., Springel V., White S. D. M., Croton D. J., Kauffmann G, 2006, MNRAS, 366, 499
- [23] De Lucia G., Blaizot J., 2007, MNRAS, 375, 2
- [24] Diemand J., Kuhlen M., Madau P., 2008, ApJ, 679, 1680
- [25] Eke V. R., Frenk C.S., Baugh C.M., Cole S., Norberg P., Peacock J.A., Baldry I., Bland-Hawthorn J., et al., 2004, MNRAS, 355, 769
- [26] Font A. S., Bower R. G., McCarthy I. G., Benson A. J., Frenk C. S., Helly J. C., Lacey C. G., Baugh C. M., et al., 2008, MNRAS, 389, 1619
- [27] Gnedin O. Y., 2003, ApJ, 589, 752
- [28] Gonzalez J. E., Lacey C. G., Baugh C. M., Frenk C. S., Benson A. J., 2008, Astro-ph (arXiv:0812.4399)
- [29] Harker G., Cole S., Helly J., Frenk C. S., Jenkins A., 2006, MNRAS, 367, 1039
- [30] Henriques B. M., Bertone S., Thomas P. A., 2008, MNRAS, 383, 1649
- [31] Jenkins A., Frenk C.S., White S.D.M., Colberg J.M., Cole S., Evrard A.E., Couchman H.M.P., Yoshida N., 2001, MNRAS, 321, 372
- [32] Jiang C. Y., Jing Y. P., Faltenbacher A., Lin W. P., Li C., 2008, ApJ, 675, 1095
- [33] Jiang C. Y., Jing Y.P., Lin W.P., 2009, arXiv0902.3734
- [34] Jing Y. P., Borner G., 2004, ApJ, 617, 782
- [35] Kang X., Jing, Y. P., Mo H. J., Borner G., 2005, ApJ, 631, 21
- [36] Krick J. E., Bernstein R. A., 2007, AJ, 134, 466
- [37] Li C., Kauffmann G., Jing Y.P., White S.D.M., Borner G., Cheng F.Z., 2006, MNRAS, 368, 21
- [38] Li G. L., Mao S., Jing Y. P., Lin W. P., Oguri M., 2007, MNRAS, 378, 496
- [39] Li C., White S. M. D., 2009, Astro-ph (arXiv:0901.0706)
- [40] Madgwick D. S., Hawkins Ed., Lahav O., Maddox S., Norberg P., Reacock J. A., Baldry I. K., Baugh C. M., et al., 2003, MNRAS, 344, 847
- [41] Malbon R. K., Baugh C. M., Frenk C. S., Lacey C. G., 2007, MNRAS, 382, 1394
- [42] McCarthy I. G., Frenk C. S., Font A. S., Lacey C. G., Bower R. G., Mitchell N. L., Balogh M. L., Theuns T., 2008, MNRAS, 383, 593
- [43] Mo H.J., White S.D.M., 1996, MNRAS, 282, 1096
- [44] Moore B., Katz N., Lake G., 1996, ApJ, 457, 455
- [45] Norberg P., Baugh C. M., Hawkins Ed., Maddox S., Peacock J. A., Cole S., Frenk C. S., Bland-Hawthorn J., et al., 2001, MNRAS, 328, 64
- [46] Norberg P., Baugh C. M., Hawkins Ed., Maddox S., Madgwick D., Lahav O., Cole S., Frenk C. S., et al., 2002, MNRAS, 332, 827
- [47] Norberg P., Cole S., Baugh C. M., Frenk C. S., Baldry I., Bland-Hawthorn J., Bridges T., Cannon R., et al., 2002, MNRAS, 336, 907
- [48] Norberg P., Baugh C. M., Gaztanaga E., Croton D. J., 2008, Astro-ph (arXiv:0810.1885N)
- [49] Norberg P., et al., 2009, in preparation
- [50] Richstone D. O., 1976, ApJ, 294, 642
- [51] Sanchez A. G., Crocce M., Cabre A., Baugh C. M., Gaztanaga E., 2009, Astro-ph (arXiv:0901.2570)
- [52] Springel V., White S. D. M., Tormen G., Kauffmann G., 2001, MNRAS, 328, 726
- [53] Springel V., White S. D. M., Jenkins A., Frenk C. S., et al. 2005, Nat, 435, 629
- [54] Springel V., Frenk C. S., White S. D. M., 2006, Nat, 440, 1137
- [55] Springel V., Wang J., Vogelsberger M., Ludlow A., Jenkins A., Helmi A., Navarro J. F., Frenk C. S., et al., 2008, MNRAS, 391, 1685
- [56] Taylor J. E., Babul A., 2001, ApJ, 559, 716
- [57] Wake D. A., Sheth R. K., Nichol R. C., Baugh C. M., 2008, MNRAS, 387, 1045
- [58] Welch G. A., Sastry G. N., 1971, ApJ, 169, 3
- [59] Wetzel A. R., Cohn J. D., White M., 2009, MNRAS, Astro-ph (arXiv:0810.2537)
- [60] White S. D. M., Frenk C. S., 1991, ApJ, 379, 52
- [61] Yang X., Mo H. J., van den Bosch F. C., 2009, ApJ, 693, 830
- [62] York D. G., Adelman J., Anderson John E. Jr., Anderson S. F., Annis J., Bahcall N. A., Bakken J. A., Barkhouser R., et al., 2000, AJ, 120, 1579
- [63] Zehavi I., Blanton M. R., Frieman J. A., Weinberg D. H., Mo H. J., Strauss M. A., Anderson S. F., Annis J., et al., 2002, ApJ, 571, 172
- [64] Zehavi I., Zheng Z., Weinberg D. H., Frieman J. A., Berlind A. A., Blanton M. R., Scoccimarro R., Sheth R. K., et al., 2005, ApJ, 630, 1
- [65] Zheng Z., Berlind A. A., Weinberg D. H., Benson A. J., Baugh C. M., Cole S., Dav R., Frenk C. S., et al., 2005, ApJ, 633, 791
- [66] Zheng Z., Coil A. L., Zehavi I., 2007, ApJ, 667, 760
- [67] Zibetti S., 2008, IAUS, 244, 176
- [68] Zibetti S., White S. D. M., Schneider D. P., Brinkmann J., 2005, MNRAS, 358, 949
- [69] Zwicky F., 1951, PASP, 63, 61