Radio spectral index images of the spiral galaxies NGC 0628, NGC 3627, and NGC 7331
Abstract
Aims. In order to understand the cosmic ray propagation mechanism in galaxies, and its correlation with the sites of star formation, we compare the spatially resolved radio spectral index of three spiral galaxies with their IR distribution.
Methods. We present new low-frequency radio continuum observations of the galaxies NGC 0628, NGC 3627, and NGC 7331, taken at 327 MHz with the Very Large Array.
Results. We complemented our data set with sensitive archival observations at 1.4 GHz and we studied the variations of the radio spectral index within the disks of these spiral galaxies. We also compared the spectral index distribution and the IR distribution, using 70 m Spitzer observations.
Conclusions. We found that in these galaxies the non-thermal spectral index is anticorrelated with the radio brightness. Bright regions, like the bar in NGC 3627 or the circumnuclear region in NGC 7331, are characterized by a flatter spectrum with respect to the underlying disk. Therefore, a systematic steepening of the spectral index with the increasing distance from the center of these galaxies is observed. Furthermore, by comparing the radio images with the 70 m images of the Spitzer satellite we found that a similar anticorrelation exists between the radio spectral index and the infrared brightness, as expected on the basis of the local correlation between the radio continuum and the infrared emission. Our results support the idea that in regions of intense star formation the electron diffusion must be efficient. The observed anticorrelation between radio brightness and spectral index, may imply that the cosmic ray density and the magnetic field strength are significantly higher in these regions than in their surroundings.
Key Words.:
radio continuum: galaxies – galaxies: spiral – galaxies: ISM – stars: formationA. Sources parameters
| Name | (J2000) | (J2000) | d | i | SRC | SFIR |
|---|---|---|---|---|---|---|
| () | (° ′ ″ ) | (Mpc) | (°) | (mJy) | (Jy) | |
| NGC 0628 | 01 36 41.7 | +15 46 59 | 7.3 | 24 | 180 | 20.86 |
| NGC 3627 | 11 20 15.0 | +12 59 30 | 11.1 | 63 | 458 | 67.8 |
| NGC 7331 | 22 37 04.1 | +34 24 56 | 15.1 | 62 | 372 | 35.29 |
B. Observations details
| Name | IF | Frequency | Bandwidth | Configuration | Visibilities | HPBW | rms | Date |
|---|---|---|---|---|---|---|---|---|
| Number | MHz | MHz | Number | mJy/beam | ||||
| NGC 0628 | 2 | 321.5-327.5 | 3.125 | C | 524446 | 65 57 | 2.3 | 01 sep 05 |
| NGC 3627 | 2 | 329.1-323.1 | 6.250 | B | 662708 | 20 16.6 | 2 | 30 oct 07 |
| NGC 7331 | 2 | 329.1-323.1 | 6.250 | B | 349475 | 17.5 15.5 | 1.1 | 03 nov 07 |
-
A. Coordinates, distances, inclinations from Helfer et al. (2003). Inclination is defined assuming i=0° for face-on galaxies. The SRC of NGC 0628, and NGC 3627 are 1.4 GHz global flux from Condon et al. 1990, the SRC of NGC 7331 is from Condon (1987). SFIR is 60 m flux, taken from Rice et al. 1990 for NGC 0628, and for NGC 7331, while from the IRAS Bright Galaxy Sample (Soifer et al., 1989) for NGC 3627.
B. VLA observational properties.
1 Introduction
It is well known that the radio continuum of spiral galaxies consists of a mixture of non-thermal and thermal emission (e.g. Condon, 1992). The non-thermal component is due to the synchrotron emission of cosmic-ray (CRe) electrons with GeV energies spiralling in the galaxy’s magnetic field. The thermal one is due to the free-free emission from ionized gas at K. The two emissions are characterized by different spectra. The synchrotron component generally has a steep spectral index () and dominates at low-frequencies while the free-free emission has a much flatter spectrum, , and may become relevant at frequencies greater than about 10 GHz (Niklas & Beck, 1997). Synchrotron emission is thus best studied at frequencies below a few GHz. At these frequencies close correlations are observed between the radio continuum and several star formation tracers like the emission from ionized gas, the infrared radiation (IR) from thermal dust (e.g. Yun et al., 2001), and the CO emission from molecular clouds (Rickard et al. 1977, Israel 1997, Adler et al. 1991, Murgia et al. 2002). It has been established that these correlations hold not only on global but also on local scales, down to hundreds of parsecs, within the disks of spiral galaxies (Murgia et al. 2005, Paladino et al. 2006). Although it is commonly accepted that all these correlations ultimately originate from the process of massive stars formation itself, the details of the physical mechanisms on how this occurs are not completely understood.
One main difficulty in the study of the non-thermal radio continuum is due to the fact that the synchrotron radiation essentially traces the product of CRe and magnetic field energy densities. Disentangling these two contributions is not directly possible unless making hardly verifiable assumptions (like e.g. energy equipartition between field and particles). A second source of uncertainty is related to the diffusion length of CRe electrons which is poorly known. The CRe diffuse from their injection (or re-acceleration) sites and, as a consequence, their density and energy spectrum at a given location in the disk is the result of the balance between the efficiencies of different processes such as the injection (or re-acceleration) rate, the confinement time, and the energy losses.
Since the mean free path of dust-heating photons (100 pc) is far shorter than the presumed diffusion length of CR electrons (Bicay et al., 1989), the first attempts to model the propagation of CRe have been made by comparing radio and IR images of spiral galaxies. Bicay & Helou (1990) smeared IRAS images of spiral galaxies by using parametrized kernels in order to match the observed morphology seen in the radio. They found that the diffusion length of CRe electrons is of the order of 1-2 kpc. Recently Murphy et al. (2006) applied this phenomenological image-smearing model to new Spitzer images. They found that the galaxies examinated exhibit a wide range of ages and spreading scale lengths of their CR electrons, going from the youngest populations, recently injected within star-forming regions (l500 pc), to the oldest CR electrons, making up a galaxy’s underlying synchrotron disk (l 3 kpc).
The way we will use to understand the cosmic ray diffusion mechanism, and thus its correlation with the sites of intense star formation, is the comparison of spatially resolved radio spectral index images of galaxies and their IR distribution. Such a study is only now possible due to the unprecedented high spatial resolution and sensitivity of the Spitzer Space Telescope at IR wavelengths. We recently studied the point-by-point relation between the radio spectral index and the IR emission in the galaxy M51 (Paladino et al., 2006). By comparing the Spitzer 70 m image and the spectral index image obtained between 1.4 and 4.9 GHz, we found an anticorrelation between the IR emission and the spectral index. Regions in which the IR is higher than the average tend to have a flatter radio spectrum with respect to the surroundings. This result suggests that the CRe electrons confinement time in the star forming regions is shorter than their radiative lifetime and that they age as they diffuse in the disk (Murgia et al 2005).
This work would be a starting point for the program of extending this kind of analysis to a large sample of galaxies. Here we report on the spectral index analysis of three spiral galaxies: NGC 0628, NGC 3627, and NGC 7331. We observed these galaxies at 327 MHz with the Very Large Array (VLA). In order to obtain detailed spectral index maps we complemented our data set with sensitive archival observations at 1.4 GHz. Since at these frequencies the contribution from thermal emission is likely to be minimized the spectral index can be used to study the spectrum of the non-thermal emission.
2 Observations and data reduction
2.1 VLA 327 MHz observations
Our aim is to investigate the variations of the non-thermal spectral index in the sample of 22 nearby spiral galaxies presented in Murgia et al. (2005) and Paladino et al. (2006), by mean of low-frequency radio observations. In this work we report on the first results for three galaxies taken from the aforementioned sample.
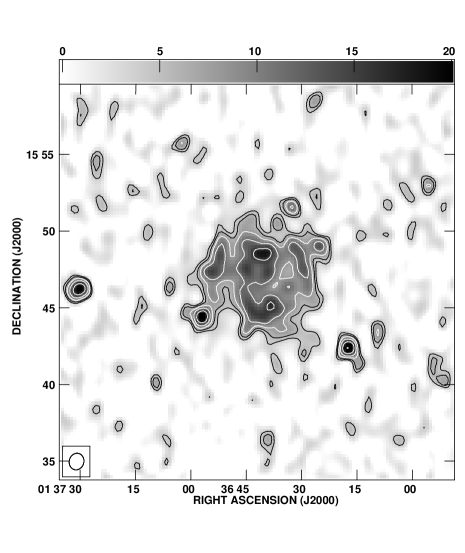
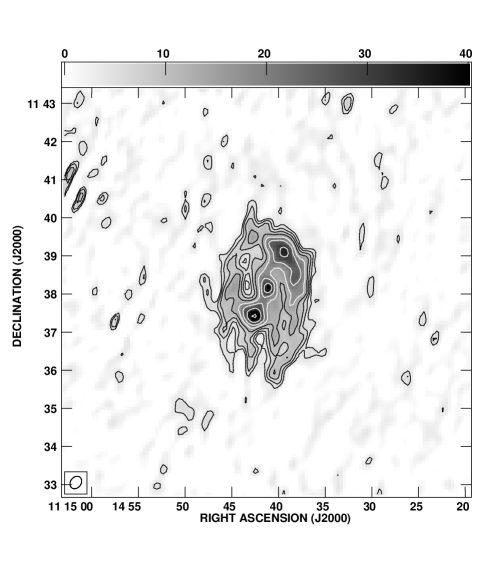
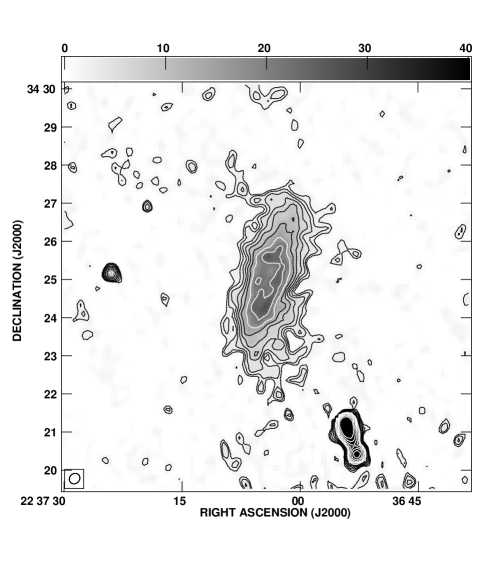
We present new radio observations of the spiral galaxies NGC 0628, NGC 3627, and NGC 7331 at 327 MHz with the VLA. The basic parameters of these galaxies are listed in Table 1.A. The galaxy NGC 0628 is a clear grand-design spiral galaxy seen almost face-on. In the UV bright knots embedded in diffuse emission trace the spiral pattern and many of these knots are also bright in (Marcum et al., 2001). Futhermore these authors have suggested that the entire disk has undergone active star formation within the past 500 Myr and that the inner regions have experienced more rapidly declining star formation than the outer regions. NGC 3627, the brightest member of the Leo Triplet, is an interacting spiral galaxy with a bar and two asymmetric spiral arms. The western arm is accompanied by weak traces of star formation, while the eastern arm contains a straight actively star-forming segment in its inner part (Soida et al., 2001). NGC 7331 is a relatively highly inclined spiral galaxy with a ring, visible in CO (e.g. Regan et al., 2001), radio continnum (e.g. Cowan et al., 1994), submillimeter (Bianchi et al., 1998) and Spitzer-infrared (Regan et al. 2004, Regan et al. 2006) images.
We observed NGC 3627 and NGC 7331 with the VLA in B configuration while NGC 0628 was observed with the VLA in C configuration. A summary of the observations, including the VLA configuration, frequency, bandwidth, visibilities number, date of observations, is reported in Table 1.B.
The observations were conducted in spectral line mode (see Tab. 1.B for details on frequencies and bandwidths), in order to reduce the effects of bandwidth smearing and to allow for more accurate radio-frequency interference (RFI) excision.
The data were calibrated and imaged with the NRAO package AIPS (Astronomical Image Processing System). Both flux density and bandpass calibration were based directly on observations of the strong calibrator sources 3C48, 3C123, 3C147, and 3C286. The amplitude gains were tied to the flux scale of Baars et al. (1977). For the initial phase calibration we used, when available, further calibrators closest to the observed sources. A careful data editing operation has been made in order to remove RFI present in individual channels. At the end of this procedure 10 of data were flagged in the observations of NGC 0628. A higher fraction of data, about 35 and 28 for NGC 3627 and NGC 7331, respectively, was flagged in the 2007 runs, when some EVLA antennas started to be included in the VLA.
The visibility data have been spectrally averaged, retaining 5 channels with a resolution of 488 KHz for NGC 0628, and 6 channels with a resolution of 781 KHz for NGC 3627 and NGC 7331.
The entire field was imaged using the AIPS program IMAGR in 3D mode. Owing to its large field of view at 327 MHz, the VLA is not coplanar at this frequency. Therefore, the primary beam was divided in small overlapping “facets” over which the VLA can be safely assumed to be coplanar (Cornwell & Perley, 1992). Confusion lobes of surrounding sources far from the center of the field are often so strong that their side-lobes contribute measurably to the noise level in the central region. Thus, by using the NRAO VLA Sky Survey (NVSS) catalog as a reference, we also cleaned the strongest sources over an area of about in radius by placing small facets around each of them (task SETFC).
Final images were created by an iterative process of CLEANing and self-calibration including all these “facets”. In the self-calibration process, we used only the strongest components inside the primary beam in order to increase the accuracy of the phase calibration model. The use of smaller clean boxes decreased the possibility of “over-cleaning” and minimized the CLEAN bias (see Condon et al., 1998a, for details).
Figures 2-3 show the 327 MHz images of the three observed sources, with typical noise level reported in Table 1.B.
NGC 0628, which has the largest angular extent () among the three galaxies, has been observed with the VLA in C configuration with an angular resolution of 65″57″.
The observations of NGC 3627 and NGC 7331 ( 5′) were taken with the VLA in B configuration at a resolution of 20″16.6″and 17.5″15.5″, respectively.
2.2 Archival VLA observations at 1.4 GHz
For the purposes of the spectral index imaging, we complemented our data set with archival observations at 1.4 GHz with the VLA in D and C configurations. The archival data we recovered is described in Table 2. The data were calibrated and imaged with the package AIPS following the standard procedures. The coverage of the spatial frequencies of the 1.4 GHz observations is very similar to that at 327 MHz. However, in order to ensure a perfect match in angular resolution, we convolved the final images at both frequencies to the largest beam (see section 3.2).
| Source | VLA | HPBW | rms | Program ID |
|---|---|---|---|---|
| config | Jy/beam | |||
| NGC 0628 | D | 42.72 40.06 | 54 | AA161 |
| NGC 3627 | C | 16.52 14.02 | 150 | AS541 |
| NGC 7331 | C | 17.49 15.48 | 40 | AB345 |
2.3 IR Spitzer images
The galaxies studied in this work were observed as part of the Spitzer
Infrared Nearby Galaxies Survey (SINGS; Kennicutt et al. (2003)) and IR images
have been released. For details on observations and data processing see
delivery document for Fifth (and last) SINGS Data Delivery, April
2007111http:data.spitzer.caltech.edupopularsings20070410_enhanced
_v1Documentssings_fifth_delivery_v2.pdf.
The observations obtained with the Multiband Imaging Photometer for Spitzer (MIPS; Rieke et al. (2004)) at 70 m have resolution of 18″. We convolved these images to the beam of our 327 MHz radio images in order to compare the spectral index distribution with the IR one. As reported in the Data Release, due to special processing, the quality of the NGC 7331 70 m data is somewhat worse than the quality of the other 70 m images released. However, we use this image to compare the spectral index and IR distribution in NGC 7331, handling with care the results obtained from this analysis.
3 Analysis and results
3.1 Integrated radio spectra
| Source | Frequency | Flux density | Reference |
| MHz | Jy | ||
| NGC 0628 | 57.5 | 21 | 1 |
| 324.4 | 0.49 0.03 | This work | |
| 1400 | 0.15 0.01 | 2 | |
| 1515 | 0.16 0.01 | This work | |
| 4850 | 0.060 0.005 | 3 | |
| NGC 3627 | 57.5 | 2.3 0.7 | 1 |
| 160 | 1.6 0.3a | 4 | |
| 325.5 | 0.97 0.03 | This work | |
| 408 | 0.93 0.05a | 5 | |
| 611 | 0.87 0.1a | 4 | |
| 1370 | 0.5 0.01 | 6 | |
| 1425 | 0.38 0.01 | This work | |
| 2695 | 0.2 0.04 | 4 | |
| 4850 | 0.14 0.02 | 7 | |
| NGC 7331 | 74 | 1.12 0.18 | 8 |
| 325 | 0.935 0.004 | 9 | |
| 325.9 | 0.94 0.02 | This work | |
| 1489 | 0.32 0.01 | This work | |
| 1400 | 0.33 0.01 | 2 | |
| 1369 | 0.35 0.01 | 6 | |
| 2380 | 0.18 0.01 | 10 | |
| 4850 | 0.096 0.013 | 7 |
-
a Flux density scale from Wyllie (1969).
-
References and telescopes:
-
1.
Israel & Mahoney (1990): Clark Lake radio Telescope
-
2.
Condon et al. (1998b): NVSS – NRAO VLA D array
-
3.
Gregory et al. (1996): NRAO Green Bank Telescope
-
4.
Haynes et al. (1975): CSIRO telescope
-
5.
Large et al. (1981): Molonglo Radio Telescope
-
6.
Braun et al. (2007): Westerbork Telescope WSRT
-
7.
Gregory & Condon (1991): NRAO Green Bank
-
8.
Cohen et al. (2007): NRAO VLA B array
-
9.
Rengelink et al. (1997): WENSS – WSRT
-
10.
Dressel & Condon (1978): Arecibo Telescope.
-
1.
We measured total flux densities at 327 MHz from the new images of the observed galaxies. The values obtained are reported in Table 3.
 |
 |
 |
Pow = Powerlaw
SSA = Synchrotron Self Absorption
CI = Continuous injection
| Source | Model | fitted parameters | |||
| MHz | MHz | ||||
| NGC 0628 | Pow | 0.78 | – | – | 0.76 |
| NGC 3627 | Pow+SSA | 0.66 | – | 54 | 4.3 |
| CI | 0.4 | 937 | – | 2.9 | |
| NGC 7331 | Pow+SSA | 0.79 | – | 112 | 2.5 |
| CI+SSA | 0.5 | 1025 | 92 | 0.98 | |
In order to investigate if some absorption process affects the emission from these galaxies, in particular in the range of frequencies between 327 MHz and 1.4 GHz, we have analyzed their integrated radio spectra. From a careful assessment of published values between 57 and 5000 MHz we derived the integrated radio spectra of the three observed galaxies. The values of the integrated flux density are reported in Table 3. The telescopes from which the observations have been taken are reported in correspondence of each reference.
Most of the measurements were tied to the flux scale of Baars et al. (1977). Some values (reported with an indication on Table 3) are on the scale of Wyllie (1969), which Baars et al. (1977) concluded is very close to their own.
Figure 4 shows the integrated radio spectra of NGC 0628, NGC 3627, and NGC 7331, in which our new 327 MHz flux density measurements are indicated by filled triangles. The integrated spectrum of NGC 0628 is shown on the left panel of Figure 4. The data are very well fitted by a single power law with a spectral index of =0.78. This value is not unusual for a spiral galaxy; the average spectral index of spiral galaxies is 0.74 0.03 (Gioia et al., 1982).
 |
 |
 |


The integrated spectra of galaxies NGC 3627 and NGC 7331 present deviations from the classical power law. Most spiral galaxies do indeed show a change in spectral index with frequency and different possible reasons have been proposed (e.g., Israel & Mahoney 1990; Hummel 1991; Pohl & Schlickeiser 1992). We fitted the integrated spectra of these galaxies by introducing an absorption at low frequency. This seems to be necessary in particular to fit the low frequency point in NGC 7331. The integrated spectra have been fitted with a power law, SPow() , modified by low-frequency absorption as in Pacholczyk (1970):
| (1) |
where is the frequency at which the optical depth is equal to 1, while is the spectral index in the optically thin power law regime. For the optically thick regime we assume a spectral index 2.5, as expected in the case of an homogeneous synchrotron self-absorbed source. The fitted parameters, along with the reduced values (/ndf, where ndf is the number of degrees of freedom), are reported in table 4.
The frequency peaks for both galaxies resulting from the fit are at 100 MHz, thus the region between 327 MHz and 1.4 GHz should be relatively free from absorption.
A hint of steepening is observed in the spectra above a frequency of 1 GHz. We tried to fit the data with the continuous injection model (CI), described in Murgia et al. (1999). In this model it is assumed that the radio sources are continuously replenished by constant flow of fresh relativistic particles with a power law energy distribution ( N(E)) and that the magnetic field is constant, the radio spectrum has a standard shape Kardashev (1962), with injection spectral index = below a critical frequency , and above . The steepening of the spectral index at high frequencies is due to particle energy losses.
By comparing the values, we can notice that the observed high frequency spectra are better fitted by a CI model, rather than a power law, for both galaxies. In NGC 3627 the CI model fit do not requires synchrotron self-absorption. Nevertheless, the interpretation of the high frequency break should be considered carefully being the assumptions of the CI model too simple to describe the complex structures and physics of spiral galaxies.
In closing, the analysis of integrated spectra of the three galaxies considered in this work shows that the region between 327 MHz and 1.4 GHz should be relatively free from absorptions.
3.2 Local variations in the radio spectral index
We investigate the variations in the non-thermal spectral index as a function of position within the galaxies. The integrated spectra show that the region between 327 MHz and 1.4 GHz is relatively free from (self-)absorption, even in the case of NGC 7331 where a low frequency turnover seems to be present. Moreover, at these frequencies the contribution from thermal emission is likely to be minimized, and thus spectral index can be used to study the spectrum of the non-thermal emission.
The spectral index images between 327 MHz and 1.4 GHz, have been obtained by considering only those pixels where the brightness was above 3 at both frequencies. To accurately determine the spectral index distribution identical beam size and shape at different frequencies is required. We convolved NGC 0628 images to a 66″ round beam while for NGC 3627 and NGC 7331 we used a beam of 20″. In addition, to avoid any positional offsets, the images were aligned and interpolated to identical projections and field center. The primary beam correction has been applied to the images at both frequencies.
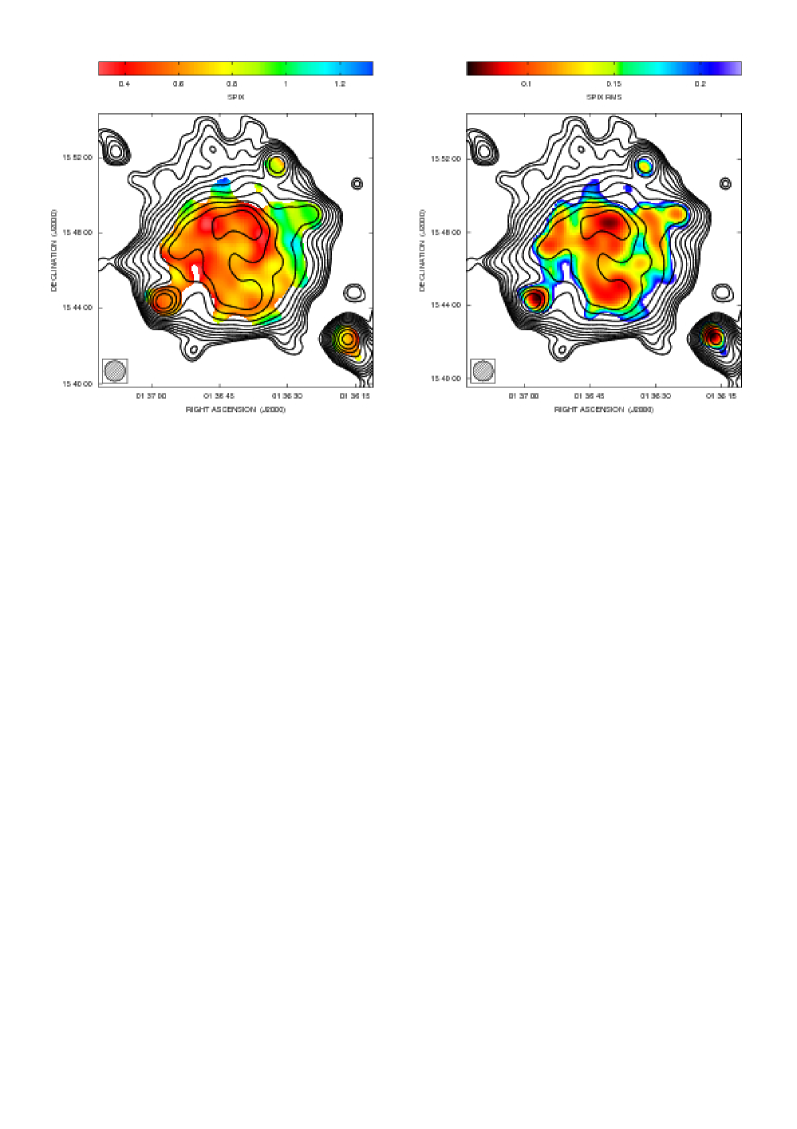
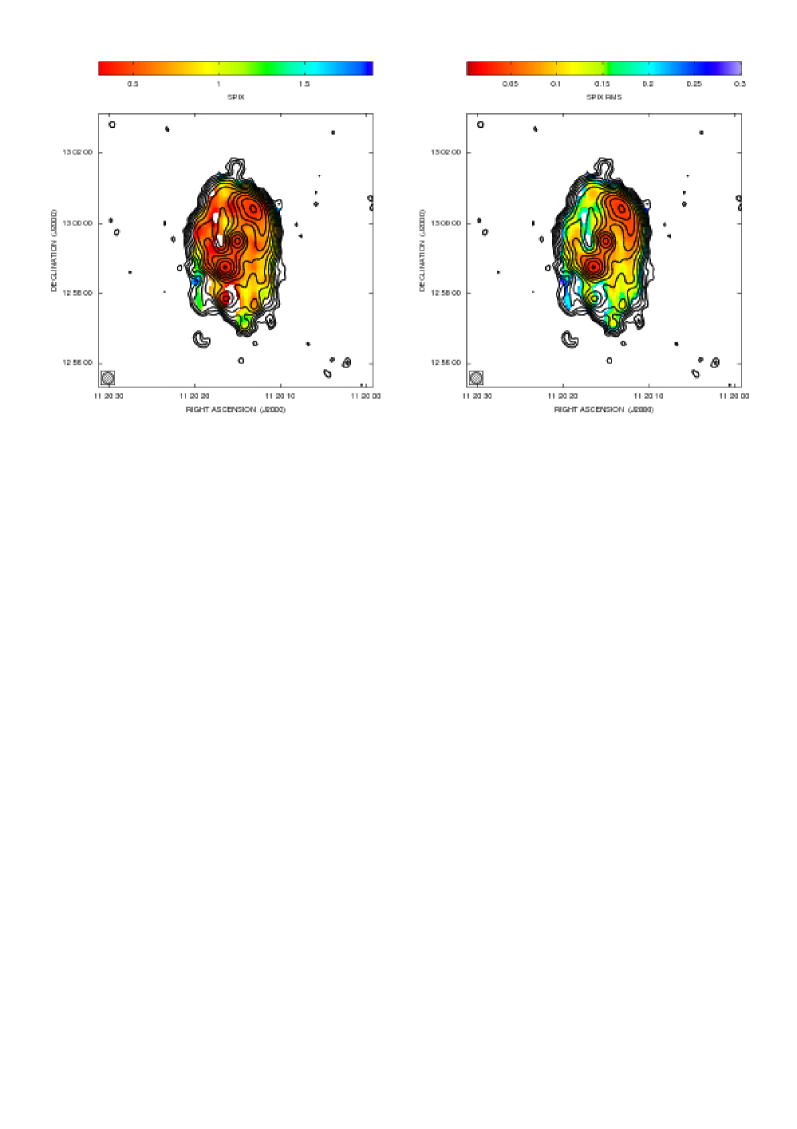
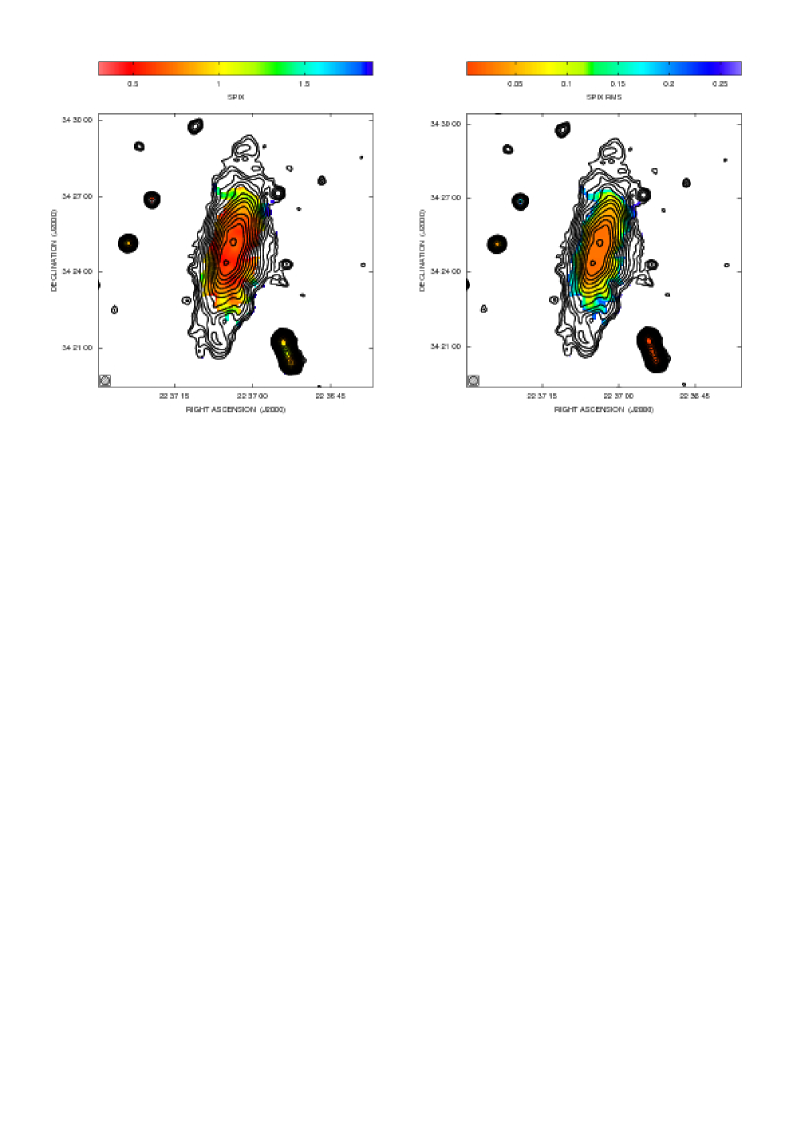
The spectral index images, calculated between 327 MHz and 1.4 GHz, of the three sources are shown in left panels of Figures 7, 9 and 11. The dynamic range of images at 327 MHz is typically lower than the one at 1.4 GHz, therefore the cut in these spectral index maps in most of the points is driven by the 327 MHz images. Right panel of the same Figures show the spectral index uncertainty. The comparison of the image with the error image show that most of the observed spectral index features are statistically significant.
The 66″ beam of NGC 0628 partly hidden the spiral structure of the galaxy, bright clumps in spiral arms in radio images correspond to flatter regions in the image (Fig. 7). The spectral index image of NGC 3627 (Fig. 9) clearly shows that the bar and its brights ending regions have a spectral index flatter than the underlying disk. The radio spectrum of NGC 7331 (Fig. 11) is almost uniformly flat in the galaxy’s center and steepens towards the peripheral regions of the disk.
For a quantitative analysis we measured the point-to-point brightness on the radio images at 327 MHz and 1.4 GHz as follows. We overlaid regular grids of rectangular beam-sized boxes on the radio images, and we averaged the brightness in each box. We then calculate the spectral index between 327 MHz and 1.4 GHz.
Figures 5, 7, 9 and 11 show the results of this point-to-point comparison. Only points exceeding 5 times the rms of the computed spectral index are shown. This severe clipping increases our confidence in spectral index variations.
Figure 5 shows the variations of spectral index with the radio brightness in the three studied galaxies. A common feature in these galaxies is that the spectral index is anticorrelated with the radio brightness. Bright regions, like the bar in NGC 3627 or the circumnuclear region in NGC 7331, are characterized by a flatter spectrum with respect to the underlying disk. In all the three galaxies, the brighter regions have a spectral index of about . In the faintest regions, the radio spectrum steepen to .
Left panels of Figures 7, 9, and 11 show the spectral index versus the distance from the center of the sources. The anticorrelation between the brightness and the spectral index causes a systematic steepening of the radio spectrum with the increasing distance from the center of these galaxies, where typically brightest regions are located.
3.3 Comparison with IR emission
The far infrared luminosity from galaxies is emitted by interstellar dust heated by the general interstellar radiation field and the more intense radiation in star formation regions. The 70 m emission can be used as star formation diagnostic. To investigate the connection between star formation sites and cosmic rays propagation mechanism, we compare 70 m distribution to spectral index in galaxies.
We used 70 m Spitzer images (Kennicutt et al., 2003) convolved to the same beam of our spectral images. We measured the IR brightness using the same grid described in section 3.2. Right panels in Figures 7,9 and 11 show the radio spectral index versus the 70 m brightness. Despite the very different morphologies, the radio spectral index shows a common behaviour in all the three galaxies: an anticorrelation exists between the radio spectral index and the infrared brightness. Regions in which the IR is higher than the average tend to have a flatter radio spectrum with respect their surroundings. The radio spectral index shows the same anticorrelation with the radio brightness. The observed trend is expected on the basis of the local correlation between the radio continuum and the infrared emission. This result is consistent with the idea that the CRe electrons confinement time in the star forming regions is shorter than their radiative lifetime.
4 Summary
We have presented new 327 MHz VLA radio images of the three spiral galaxies NGC 0628, NGC 3627, and NGC 7331. Based on these images, we measured the integrated flux densities and we performed a spatially resolved study of the synchrotron spectral index distribution.
We have calculated the integrated radio spectra of these galaxies, using the measured integrated fluxes, together with flux densities measurements taken from the literature. In the considered frequency range, the radio spectrum of NGC 0628 is well fitted by a single power law with an index . The integrated spectra of galaxies NGC 3627 and NGC 7331 present deviations from the classical power law. We fitted these integrated spectra and we noticed that the observed high frequency spectra are better reproduced by a continuous injection model. In NGC 7331 a synchrotron self-absorption process well reproduce the low frequency spectrum. This is one of the possible mechanisms producing the low-frequency turnover and further low-frequency observations, are needed to confirm it.
We complemented our data set with sensitive archival observations at 1.4 GHz and we studied the variation of the radio spectral index to within the disks of these spiral galaxies. We found that the spectral index is anticorrelated with the radio brightness. Bright regions, like the bar in NGC 3627 or the circumnuclear region in NGC 7331, are characterized by a flatter spectrum with respect to the underlying disk. This causes a systematic steepening of the spectral index with the increasing distance from the center of these galaxies. Furthermore, by comparing the radio images with the 70 m images of the Spitzer satellite we found that a similar anticorrelation exists between the radio spectral index and the infrared brightness, as expected on the basis of the local correlation between the radio continuum and the infrared emission. Our results support the idea that in regions of intense star formation, where the injection rate of electrons is presumably higher, the CRe electrons confinement time is shorter than their radiative lifetime (Murgia et al., 2005), then the electron diffusion must be efficient. We also observed the anticorrelation between RC brightness and spectral index, this may imply that the cosmic ray density and the magnetic field strength are significantly higher in these regions than in their surroundings.
Finally, we note that this study adds to a growing list of examples confirming the importance of high-resolution, low-frequency radio observations in providing important tool to understand the physical mechanism of production and diffusion of cosmic rays. This also points to the great potential of the new generation of much more sensitive low frequency instruments, as LOFAR. Future work will involve a detailed comparison of the radio spectral index distribution and the star-formation tracers, as IR and molecular emission, in a larger sample of spiral galaxies, in order to analyse the connection of cosmic ray production and propagation with the star formation processes.
Acknowledgements.
We would like to thank the anonymous referee for insightful comments which improved this manuscript. E.O.acknowledges financial support of Austrian Science Foundation (FWF) through grant number P18523-N16. The National Radio Astronomy Observatory is operated by Associated Universities, Inc., under contract to the National Science Fundation. This research has made use of the NASA/IPAC Extragalactic Database (NED) which is operated by the Jet Propulsion Laboratory, California Institute of Technology, under contract with the National Aeronautics and Space Administration and of CATS database Astrophysical CATalogs support System.References
- Adler et al. (1991) Adler, D. S., Allen, R. J., & Lo, K. Y. 1991, ApJ, 382, 475
- Baars et al. (1977) Baars, J. W. M., Genzel, R., Pauliny-Toth, I. I. K., & Witzel, A. 1977, A&A, 61, 99
- Bianchi et al. (1998) Bianchi, S., Alton, P. B., Davies, J. I., & Trewhella, M. 1998, MNRAS, 298, L49
- Bicay & Helou (1990) Bicay, M. D. & Helou, G. 1990, ApJ, 362, 59
- Bicay et al. (1989) Bicay, M. D., Helou, G., & Condon, J. J. 1989, ApJ, 338, L53
- Braun et al. (2007) Braun, R., Oosterloo, T. A., Morganti, R., Klein, U., & Beck, R. 2007, A&A, 461, 455
- Cohen et al. (2007) Cohen, A. S., Lane, W. M., Cotton, W. D., et al. 2007, AJ, 134, 1245
- Condon (1987) Condon, J. J. 1987, ApJS, 65, 485
- Condon (1992) Condon, J. J. 1992, ARA&A, 30, 575
- Condon et al. (1998a) Condon, J. J., Cotton, W. D., Greisen, E. W., et al. 1998a, AJ, 115, 1693
- Condon et al. (1998b) Condon, J. J., Cotton, W. D., Greisen, E. W., et al. 1998b, AJ, 115, 1693
- Condon et al. (1990) Condon, J. J., Helou, G., Sanders, D. B., & Soifer, B. T. 1990, ApJS, 73, 359
- Cornwell & Perley (1992) Cornwell, T. J. & Perley, R. A. 1992, A&A, 261, 353
- Cowan et al. (1994) Cowan, J. J., Romanishin, W., & Branch, D. 1994, ApJ, 436, L139
- Dressel & Condon (1978) Dressel, L. L. & Condon, J. J. 1978, ApJS, 36, 53
- Gioia et al. (1982) Gioia, I. M., Gregorini, L., & Klein, U. 1982, A&A, 116, 164
- Gregory & Condon (1991) Gregory, P. C. & Condon, J. J. 1991, ApJS, 75, 1011
- Gregory et al. (1996) Gregory, P. C., Scott, W. K., Douglas, K., & Condon, J. J. 1996, ApJS, 103, 427
- Haynes et al. (1975) Haynes, R. F., Huchtmeier, W. K. G., & Siegman, B. C. 1975, A compendium of radio measurements of bright galaxies (Melbourne: Commonwealth Scientific and Industrial Research Organization (CSIRO), Division of Radiophysics, 1975)
- Helfer et al. (2003) Helfer, T. T., Thornley, M. D., Regan, M. W., et al. 2003, ApJS, 145, 259
- Hummel (1991) Hummel, E. 1991, A&A, 251, 442
- Israel (1997) Israel, F. P. 1997, A&A, 328, 471
- Israel & Mahoney (1990) Israel, F. P. & Mahoney, M. J. 1990, ApJ, 352, 30
- Kardashev (1962) Kardashev, N. S. 1962, Soviet Astronomy, 6, 317
- Kennicutt et al. (2003) Kennicutt, Jr., R. C., Armus, L., Bendo, G., et al. 2003, PASP, 115, 928
- Large et al. (1981) Large, M. I., Mills, B. Y., Little, A. G., Crawford, D. F., & Sutton, J. M. 1981, MNRAS, 194, 693
- Marcum et al. (2001) Marcum, P. M., O’Connell, R. W., Fanelli, M. N., et al. 2001, ApJS, 132, 129
- Murgia (2000) Murgia, M. 2000, Synage++
- Murgia et al. (2002) Murgia, M., Crapsi, A., Moscadelli, L., & Gregorini, L. 2002, A&A, 385, 412
- Murgia et al. (1999) Murgia, M., Fanti, C., Fanti, R., et al. 1999, A&A, 345, 769
- Murgia et al. (2005) Murgia, M., Helfer, T. T., Ekers, R., et al. 2005, A&A, 437, 389
- Murphy et al. (2006) Murphy, E. J., Helou, G., Braun, R., et al. 2006, ApJ, 651, L111
- Niklas & Beck (1997) Niklas, S. & Beck, R. 1997, A&A, 320, 54
- Pacholczyk (1970) Pacholczyk, A. G. 1970, Radio astrophysics. Nonthermal processes in galactic and extragalactic sources (Series of Books in Astronomy and Astrophysics, San Francisco: Freeman, 1970)
- Paladino et al. (2006) Paladino, R., Murgia, M., Helfer, T. T., et al. 2006, A&A, 456, 847
- Pohl & Schlickeiser (1992) Pohl, M. & Schlickeiser, R. 1992, A&A, 263, 37
- Regan et al. (2004) Regan, M. W., Thornley, M. D., Bendo, G. J., et al. 2004, ApJS, 154, 204
- Regan et al. (2001) Regan, M. W., Thornley, M. D., Helfer, T. T., et al. 2001, ApJ, 561, 218
- Regan et al. (2006) Regan, M. W., Thornley, M. D., Vogel, S. N., et al. 2006, ApJ, 652, 1112
- Rengelink et al. (1997) Rengelink, R. B., Tang, Y., de Bruyn, A. G., et al. 1997, A&AS, 124, 259
- Rice et al. (1990) Rice, W., Boulanger, F., Viallefond, F., Soifer, B. T., & Freedman, W. L. 1990, ApJ, 358, 418
- Rickard et al. (1977) Rickard, L. J., Turner, B. E., & Palmer, P. 1977, ApJ, 218, L51
- Rieke et al. (2004) Rieke, G. H., Young, E. T., Engelbracht, C. W., et al. 2004, ApJS, 154, 25
- Soida et al. (2001) Soida, M., Urbanik, M., Beck, R., Wielebinski, R., & Balkowski, C. 2001, A&A, 378, 40
- Soifer et al. (1989) Soifer, B. T., Boehmer, L., Neugebauer, G., & Sanders, D. B. 1989, AJ, 98, 766
- Wyllie (1969) Wyllie, D. V. 1969, MNRAS, 142, 229
- Yun et al. (2001) Yun, M. S., Reddy, N. A., & Condon, J. J. 2001, ApJ, 554, 803