Diffuse microwave emission of the interstellar medium : intensity and polarization
Abstract
With the increasing number of experiments dedicated to the observation of the Cosmic Microwave Background, interest on the detailed properties of the foreground Galactic emission has risen. In particular the focus is shifting towards polarized microwave emission with the goal of detecting signature from primordial gravitational waves and inflation. This review describes the Galactic polarized and unpolarized emissions in the microwave range : free-free, synchrotron, thermal dust and anomalous emission.
Institut d’Astrophysique Spatiale (CNRS), Université Paris-Sud, bâtiment 121, 91405, Orsay, France
1. Introduction
One of the greatest challenges in the observation of the Cosmic Microwave Background (CMB) in the 20-200 GHz range is its separation from the foreground emission. This task is facilitated by the fact that the intensity of the emission from the Galactic interstellar medium reaches a minimum in this range. On the other hand, even if the Galactic emission is weak, it is still stronger than the CMB over a significant fraction of the sky. In addition the identification of the cosmological signal is complicated by the fact that several interstellar emissions are superimposed in this frequency range: free-free, synchrotron, thermal dust. There are also strong evidences of an excess of emission in this range, discovered by Kogut et al. (1996b, a) in the COBE-DMR data. This so-called “anomalous emission” is remarkably well correlated with thermal dust emission at 100 m with a spectrum which can be confused with that of free-free or synchrotron emissions.
With a detailed characterization of the CMB unpolarized emission over the whole sky by COBE, WMAP and soon Planck, most of the scientific focus is moving towards the observation of the CMB polarized emission which will bring definite informations on the early Universe. The study of the CMB polarized signal is instrumentally challenging but most importantly the subtraction of Galactic foreground emission is tremendously more difficult than in unpolarized emission. Even if the Galactic polarized emission is simpler (we expect only synchrotron and thermal dust to contribute significantly to the Galactic polarized emission) the ratio of the CMB over Galactic polarization is almost two order of magnitude smaller than in unpolarized light. It appears clearly that this task requires a deep understanding of the diffuse Galactic emission and a coherent modeling of the unpolarized and polarized emissions.
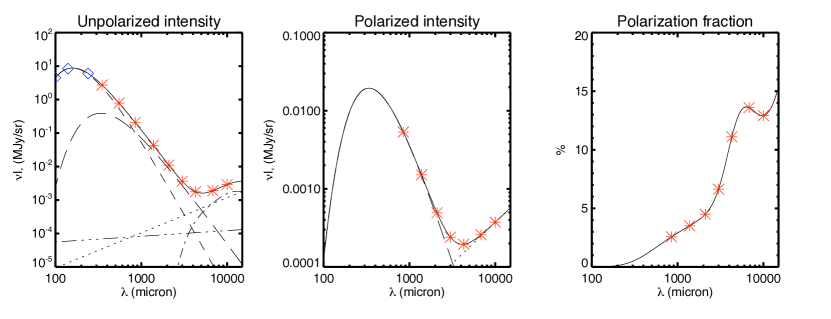
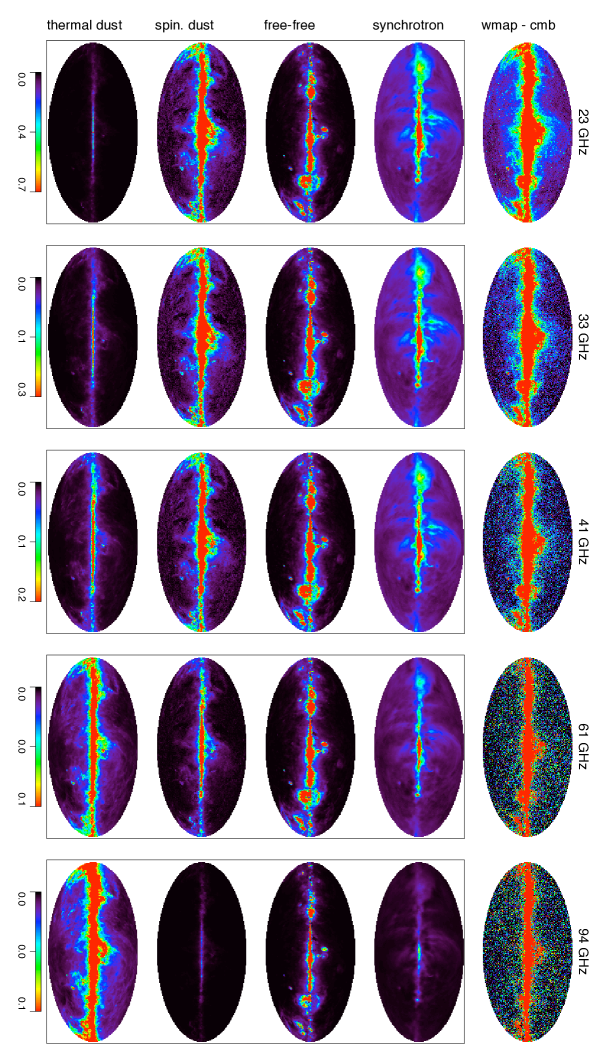
Fig. 1 shows a spectrum of the Galactic diffuse emission of a typical line of sight at high Galactic latitude. The left panel illustrates the complexity of the superposition of Galactic emissions in the CMB frequency range. In the infrared the emission is dominated by the thermal emission from big dust grains. Following Finkbeiner et al. (1999) it is modeled here as the sum of two dust components at different temperature (see § 3.). At longer wavelengths the power law spectra of the synchrotron and free-free emissions become dominant. Finally, the bell-shaped anomalous emission appears at the lower end of the spectrum, with an intensity that locally can dominate all the other components at some frequencies. An attempt to separate all these contribution and produce all-sky maps for each of them has been presented by Miville-Deschênes et al. (2008). The result of this decomposition for the five WMAP bands is illustrated in Fig. 2 where it is clearly seen that, in this range, there is no frequency where a single process dominates the emission.
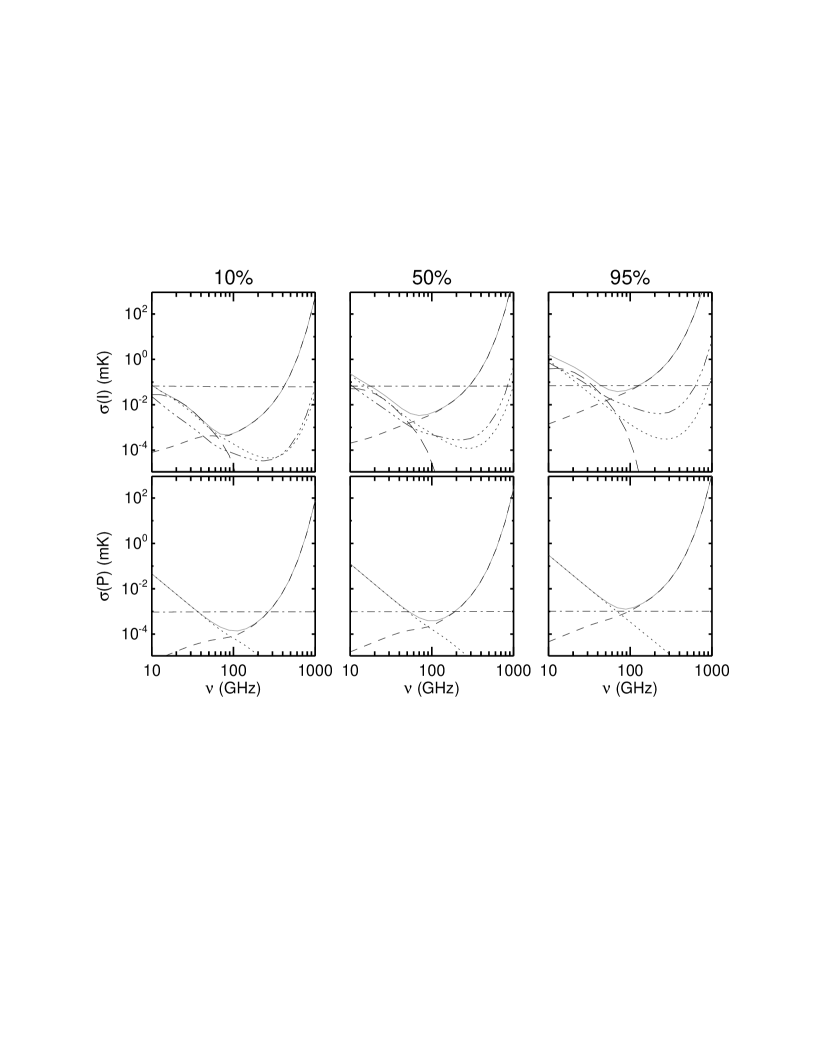
Another way of appreciation the complexity of the emission in the CMB frequency range is by looking at the rms fluctuation level of each emission as a function of frequency, for different areas on the sky. Fig. 3 shows this for polarized and unpolarized emission and for the 10, 50 and 95 % faintest regions of the sky. It highlights the fact that, in regions of the sky of faintest Galactic emission, the CMB is clearly dominating the brightness fluctuations at frequencies around 80 GHz, but the level of Galactic emission fluctuations increases greatly with the sky surface. Fig. 3 also compares the level of fluctuation in polarization () where the contrast of the CMB over the Galactic fluctuation level is much less favorable than in unpolarized light. In this case the best frequency to observe the CMB is closer to 100 GHz.
The Stokes parameters Q and U can be express in terms of a scalar (curl-free) component of even parity (E modes) and a pseudo-scalar (curl) component of odd parity (B modes). One of the greatest challenge of modern cosmology is to detect the B modes of the CMB polarization which would provide key information on the existence of gravitational waves and on the inflation period of the Universe. These B modes are at least ten times fainter that the E modes which dominates the polarization signal shown in Fig. 3. The detection of a non zero primordial B type polarization is one of the main challenges of actual and up-coming cosmological experiments (e.g. the Planck mission). It will require a detailed description of the polarized Galactic emission, especially of polarized thermal dust.
This contribution is a review of the known constraints on the Galactic emission (polarized and unpolarized) in the microwave range. The next sections are devoted to descriptions of the four main Galactic diffuse emissions : free-free (§ 2.), thermal dust (§ 3.), synchrotron (§ 4.) and anomalous emission (§ 5.).
2. Free-Free
Free-free emission comes from the electron-ion scattering in the warm ionized medium at an average temperature of K at high Galactic latitudes. Its emission is a rather difficult component of the interstellar emission to identify as it does not dominate at any frequency except in bright HII regions in the Galactic plane. H corrected for dust extinction is often used as a proxy for free-free as they both depend linearly on the emission measure, EM= (see Dickinson et al. (2003) and Finkbeiner (2003)). On the other hand, Finkbeiner (2004) argued that an error of a factor of 2 is likely in some parts of the sky solely due to an imperfect extinction correction. In addition the estimate of free-free emission from H requires an estimate of the electronic temperature which is usually assumed constant over the sky. This is a significant source of uncertainty as electronic temperature variations are expected, with lower values in the Galactic plane due to a higher metallicity and therefore more efficient cooling.
It is important to point out that the free-free spectral index is a slowly varying function of frequency and electron temperature Bennett et al. (1992); Dickinson et al. (2003); Bennett et al. (2003), At 23 GHz, the free-free spectral index varies only from 2.13 to 2.16 for K, independent of extinction. Based on this physical property Bennett et al. (2003); Hinshaw et al. (2007) estimated the free-free emission in the WMAP data using a Maximum Entropy Method (MEM) considering a constant spectral index of 2.14 over the whole sky, providing an alternative to H. Miville-Deschênes et al. (2008) built a new free-free template by combining these two estimates of the free-free emission; they used the sensitivity and resolution of the H observations in regions where extinction by dust is limited Dickinson et al. (2003) and the result of the WMAP MEM decomposition elsewhere Bennett et al. (2003). This map of free-free emission is shown in Fig. 2.
Free-free is essentially unpolarized, except at the edges of HII regions where Thompson scattering could produce some polarization at small scales. Dickinson et al. (2007) put an upper limit of only 0.6 percent for the polarized free-free emission of bright HII regions at 31 GHz. Therefore free-free is not expected to be a significant CMB foreground in polarization.
3. Thermal dust
3.1. Intensity
Interstellar dust grains have been known since the 1950s to produce extinction of starlight in the UV to near-infrared. From the extinction curves it has been estimated that dust grains are made of silicate and carbonaceous material Draine & Lee (1984) and that they have a size distribution that follows a power law with sizes ranging from big molecules to about 1 m Mathis et al. (1977). In the 80s the IRAS satellite observed the emission from these grains over the whole sky at 12, 25, 60 and 100 m with an angular resolution of 5 arcmin. These observations revealed the ubiquity of interstellar dust and interstellar matter in general, even in the faintest part of the high Galactic latitude sky.
The near to mid-infrared part of the spectrum is produced by the emission of the smallest dust grains (radius m) heated stochastically by starlight. As grains get bigger they absorb UV photons often enough to stop fluctuating in temperature and to be in thermal equilibrium with the ambient radiation field. Therefore, in the far-infrared to millimeter range, the emission from big grains can be modeled as a modified black-body: where is the Planck function at frequency , the equilibrium temperature and the emissivity spectral index. The grain equilibrium temperature varies spatially as a function of the local radiation field and of the grains optical properties which depend on their chemical composition, size and structure. For instance the growth of grains or the appearance of icy mantles have an impact on their equilibrium temperature and on their emissivity parameter Boudet et al. (2005); Meny et al. (2007). The observed equilibrium temperature of big grains ranges from K in cold cores to several hundreds in photo-dissociation regions, with a typical value of 17.5 K () in the diffuse ISM Lagache et al. (1998); Désert et al. (2008). The spatial and spectral variations of dust emission and extinction observed over the last 50 years revealed significant variations in the dust properties (grain size distribution, structure and composition) which implies rather short evolution timescales through coagulation or fragmentation processes.
In the sub-millimeter and millimeter range the big grain emission has been measured by very few experiments. The FIRAS experiment on-board the COBE satellite made an all-sky map of this emission at a resolution. Molecular clouds have also been observed from the ground (e.g. JCMT at 450 and 850 m - see Johnstone et al. (2006)) or with balloon borne experiments like PRONAOS Ristorcelli et al. (1998) or BLAST Chapin et al. (2008). These observations revealed an excess of emission in the submm compare to the diffuse ISM spectrum ( K, ). Finkbeiner et al. (1999) showed that a better fit to the FIRAS data can be achieved by considering two dust populations with different equilibrium temperatures and spectral indices. Later, in the spirit of the work of Draine & Lee (1984) on the extinction curve, Li & Draine (2001) also proposed a “2 components” model which, as opposed to the model of Finkbeiner et al. (1999), is also in accordance with known optical properties of silicate and carbonaceous dust. It has also been proposed that the submm-mm dust spectrum could be explained by variations of the spectral index as a function of physical conditions. Laboratory measurements of absorption spectra for amorphous silicates have revealed a change in in the submm range, as a function of Boudet et al. (2005). These results are in accordance with the anti-correlation between and observed with the PRONAOS Dupac et al. (2003) and Archeops Désert et al. (2008) experiments. Significant progress on the exact nature of the big dust grains are expected soon with the Planck and Herschel missions.
3.2. Estimate of thermal dust intensity in the CMB range
Meanwhile, despite the fact that it is not coherent with extinction, the Finkbeiner et al. (1999) provides a way to estimate thermal dust emission in the CMB frequency range. These authors used the 100 m/240 m ratio (DIRBE data) to estimate locally the average temperature of each dust component, assuming that the ratio of power absorbed (and radiated) by each component is the same, and that the ratio of their abundance is the same everywhere. Assuming a spectral index for each component, they extrapolate the 100 m IRAS map to any frequency in the submm-mm range, providing a template for thermal dust emission at 5 arcmin resolution. Despite these rather strong hypothesis, this model reproduces rather well the WMAP 94 GHz data on scales larger than a few degrees. On the other hand comparison at smaller scales with the 353 GHz data from the balloon-borne Archeops experiments Benoit et al. (2004) seems to reveal differences up to 60% (J.-P. Bernard, private communication). A typical line of sight at high Galactic latitude for the model 7 of Finkbeiner et al. (1999) is presented in Fig. 1 (left panel).
3.3. Polarization
Sub-millimeter polarized dust emission has been the subject of a number of review papers Hildebrand & Kirby (2004); Martin (2007); Vaillancourt (2007) and of a detailed modeling study by Draine & Fraisse (2009). Extinction of starlight from dust in the UV to near-infrared is known to be polarized. This property reveals that dust grains are aligned on the magnetic field lines, even if the exact mechanism by which they align is still not well understood (radiative torque is a likely candidate - see the review by Lazarian, this volume). Polarized extinction has been used to estimate basic grain properties like shape, size and chemical composition Bastien (2007) but also the structure and strength of the magnetic field Heiles (1996).
Given that the grains are aligned on the magnetic field lines, their emission in the far-IR/sub-mm is also polarized. From first principles we expect that a dust population with given optical properties should have a polarization fraction () constant with frequency in the FIR to mm range Hildebrand (1988). Observations have shown that this is not the case in molecular clouds Vaillancourt (2002); in this case the wavelength dependence of the polarization fraction can be explained by the presence of more than one dust populations with different equilibrium temperatures. Considering the complexity of molecular clouds (in terms of magnetic field structure, variations of dust properties and extinction of heating radiation field) it is far from clear if the same variation with wavelength will be observed in the diffuse ISM. Up to now, the only observations of the polarized dust emission from the diffuse emission in the submm/mm range were obtained at 353 GHz by Archeops Ponthieu et al. (2005) and at 94 GHz by WMAP Kogut et al. (2007). These studies show a clear detection at a few percent level (less that 6% in the Galactic plane - see Fig. 4) with a spatial structure in the Galactic plane in accordance with the starlight extinction polarization measurements. At 94 GHz the polarization fraction seems to increase slightly outside the Galactic plane in accordance with a lower depolarisation effect due to the crossing of less magnetic field fluctuations on the line of sight than in the Galactic plane. Unfortunately the sensitivity of these data is still not sufficient to allow a detailed analysis of the variation with wavelength of the polarization fraction it the diffuse ISM.
The observation of such a variation would provide important constraints on the properties of dust grains. Extinction measurements clearly showed that silicates type grains are aligned (O-Si band is polarized) unlike carbonaceous type ones (carbon features are unpolarized). If big dust grains are composed of two distinct populations, their different polarization fraction and equilibrium temperature will produce a clear spectral signature of the polarization fraction in the submm, even in cirrus clouds at high Galactic latitudes (see Fig. 1 - right panel - and Draine & Fraisse (2009) for a modeling of this effect). This is a topic where the submm polarization observations from the Planck mission but also the balloon-borne experiments PILOT Bernard et al. (2007) and Blast-pol Marsden et al. (2008) will certainly make a break through in our understanding of interstellar dust.
4. Synchrotron
The Galactic synchrotron radiation is produced by relativistic electrons spiraling around the Galactic magnetic field lines. At a given frequency the synchrotron emission depends on the cosmic-ray electrons in a given energy range and on the strength of the component the magnetic field perpendicular to the line of sight. The synchrotron radiation is intrinsically strongly polarized.
4.1. Intensity
For a cosmic ray distribution following a power law, , the synchrotron unpolarized intensity at frequency can be written as:
| (1) |
where the integral is over the line of sight and with the plane corresponding to the plane of the sky. The emissivity term is given by a power law:
| (2) |
where . For a typical value of cosmic ray spectrum and .
The cosmic ray volume density , the energy spectrum exponent and the field are all varying locally in the Galaxy. Obviously, at a given frequency the synchrotron intensity varies on the sky, but the synchrotron spectral index also shows spatial variations which depends on local variations of the cosmic rays energy spectrum.
It is worth noting that even if locally the energy spectrum is a power law, the fact that can vary along will induce departure from a pure power law for the observed synchrotron spectral index. In addition cosmic rays at higher energies (several GeVs) lose their energy faster than low energy ones which produce a steepening of at high energies as we move away from cosmic-ray production regions. This results in a steepening of the synchrotron spectrum at frequencies higher than 70 GHz, which is expected to be stronger away from star forming regions where cosmic-rays are produced. This effect is often modeled as a second order term in the synchrotron spectral index. It follows that the synchrotron intensity spectrum can be described as a power law
| (3) |
where is a curvature term that could depends on sky position.
4.2. Polarization
The synchrotron polarization fraction is related to the cosmic ray energy distribution slope : . For a typical value of cosmic ray spectrum the polarization fraction is 75%.
This maximum polarization fraction is never observed on the sky because of depolarisation effects due to beam depolarisation, to Faraday rotation, to the angle between the line of sight direction and the orientation of the large scale magnetic field lines, but mostly to the fluctuating direction of the random part of the magnetic field along the line of sight.
Similarly to the synchrotron intensity (see Eq. 1), and neglecting Faraday rotation which is not important in the microwave range, the Stokes parameters and of polarized synchrotron emission integrated along the line of sight are
| (4) |
and
| (5) |
where , , and .
Like for the synchrotron intensity, the Stokes and spectra can be approximated by power laws. On the other hand, because of the different weighting of the magnetic field in Equations 4 and 5 compared to Eq. 1, the spectral index of and should have a slightly different structure on the sky. In practice the determination of the spatial variation of the polarized synchrotron spectral index at CMB frequencies is challenging because of the limited signal-to-noise ratio of the WMAP data.
4.3. Estimate of synchrotron intensity in the CMB range
The most reliable estimate of synchrotron emission to date is the 408 MHz all-sky map of Haslam et al. (1982) (see middle-left panel of Fig. 5). The extrapolation of the 408 MHz emission at CMB frequencies relies on an estimate of and of its variations on the sky (and eventually of the curvature term ). All-sky estimates of the synchrotron spectral index between 408 MHz and 2326 MHz have been attempted by Giardino et al. (2002) and Platania et al. (2003). They obtained compatible values of but slightly different spatial variations. Unfortunately, due to cosmic-ray electrons aging effects Banday & Wolfendale (1991), these values of the synchrotron spectral index can not be used blindly to estimate synchrotron between 20 and 100 GHz. The determination of the spatial variation of the 408 MHz-23 GHz synchrotron spectral index is made difficult by the presence of the anomalous emission. By looking at specific regions known to be dominated by synchrotron, Davies et al. (2006) showed that it steepens to values of . Miville-Deschênes et al. (2008) proposed a method to estimate on the whole sky based on the use of the 23 GHz polarization data of WMAP.
5. The anomalous emission
5.1. Synchrotron or spinning dust ?
The analysis of the COBE-DMR data by Kogut et al. (1996b) revealed an excess of Galactic emission in the 30-90 GHz range, the so-called anomalous emission, strongly correlated spatially with thermal dust emission but with a spectrum similar to synchrotron or free-free. Leitch et al. (1997) showed that the correlation of this excess with 100 m extends to sub-degree scales in the North Celestial Loop (NCL) region. The lack of correlation of the anomalous emission with H measurements, also highlighted by de Oliveira-Costa et al. (2002) using Tenerife and COBE-DMR data, led Leitch et al. (1997) to conclude that free-free emission can only account for the data if it comes from gas with K. Draine & Lazarian (1998a) ruled out this interpretation based on energetic arguments.
An alternative explanation would be that the anomalous emission is actually synchrotron Bennett et al. (2003); Hinshaw et al. (2007). As described by Kogut et al. (2009) the high level of correlation of the 23 GHz data with thermal dust does not provide a proof that the observed emission excess is not synchrotron, but this explanation needs to address the fact that the correlation of synchrotron with thermal dust would be stronger at 23 GHz than at 408 MHz.
In fact synchrotron emission observed at a given frequency is mostly produced by cosmic-ray electrons of a given energy following:
| (6) |
Furthermore higher energy cosmic-ray electrons lose their energy faster than lower energy ones. Therefore the emission in the GHz range produced by high energy CRs should be stronger closer to the regions where they are produced, i.e. star forming regions which also have strong thermal dust emission. At MHz frequencies, the synchrotron emission comes from lower energy CRs which are more spread out in the Galaxy, explaining why the 408 MHz map is not strongly correlated with the thermal dust emission. As attractive as it might be this explanation suffers from several difficulties.
First the correlation between the 23 GHz and the 100 m maps extends to the resolution of WMAP ( at 23 GHz) and down to low column density cirrus clouds Davies et al. (2006) where there is no star forming activities and no local production of cosmic rays.
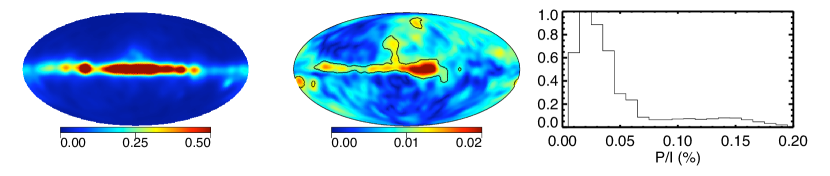
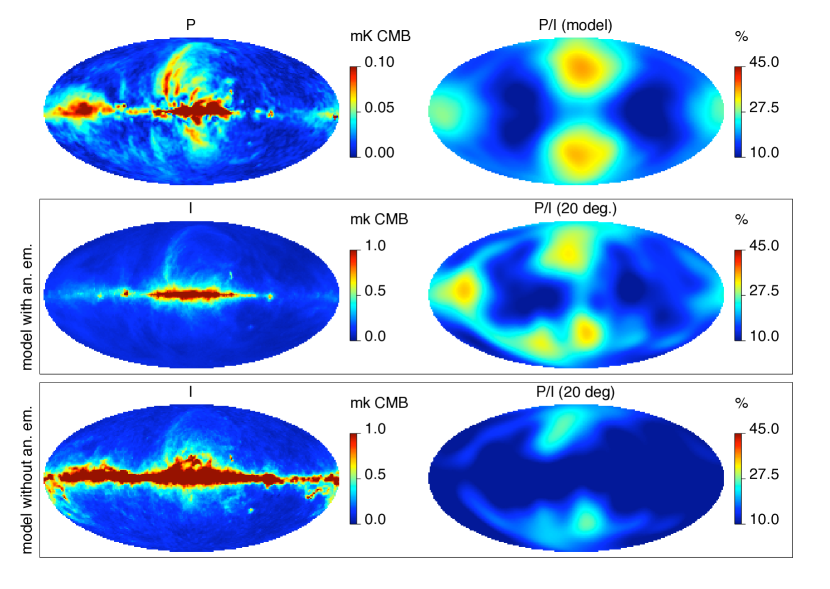
A second constraint comes from the low polarization fraction () observed at 23 GHz. Free-free is known to produce no polarization111expect at the edges of HII regions. Once CMB and free-free are removed from the 23 GHz unpolarized emission , the polarization fraction measured at 23 GHz is less than 10% in the Galactic plane and it reaches 15% on average at high Galactic latitudes Kogut et al. (2007). As the intrinsic synchrotron polarization fraction is 75% and that Faraday rotation is negligeable at 23 GHz, this low polarization fraction requires either 1) the presence of an additional unpolarized emission or 2) a strong depolarisation mechanism. The most significant depolarisation process here is the tangling of the magnetic field lines along the line of sight. Polarized extinction measurements in the near-infrared, pulsar measures and radio synchrotron observations all point at a quasi-equipartition between the regular and turbulent part of . Using a standard bi-symmetrical spiral model for the large scale magnetic field and considering a turbulent part of the field in energy equipartition with the regular part Miville-Deschênes et al. (2008) could estimate what should be the large scale polarization fraction map of synchrotron emission (Fig:5 top-right panel). They conclude that in the case of equipartition, the modeled polarization fraction can be reconciled with the observations only if an additional unpolarized component is present (Fig:5 middle panel). If not, as it was also shown by Sun et al. (2008), the polarization fraction observed at 23 GHz would require a turbulent part of the magnetic field 1.5 times the regular part, which seems highly unlikely given the other constraints. Once free-free and synchrotron (estimated from polarization) are removed from the 23 GHz unpolarized emission, the residual emission is very well correlated to dust extinction E(B-V). Miville-Deschênes et al. (2008) could also estimated that this emission has an average spectrum between 23 and 61 GHz compatible with spinning dust models Draine & Lazarian (1998b).
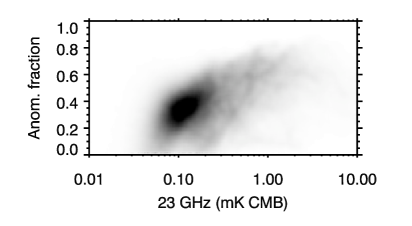
A third strong argument against synchrotron as the carrier of this anomalous emission came recently from the analysis of the absolutely calibrated ARCADE data at 3, 8 and 10 GHz. Kogut et al. (2009) showed that combined with the Haslam 408 MHz map the ARCADE data put a very strong constraint on the synchrotron spectral index near the CMB frequency range. The extrapolation of these data to 23 GHz clearly shows that synchrotron plus free-free can not account for all the 23 GHz Galactic emission and that the residual emission is of the order of % of the 23 GHz emission in the Galactic plane. This is in accordance with the analysis of Miville-Deschênes et al. (2008) who conclude that the fraction of the 23 GHz emission attributed to the anomalous emission is about 30% at high latitudes and of 50% on average in the Galactic plane (see Fig. 6).
5.2. Polarization of the anomalous emission
The question of the polarization of the anomalous emission is an important one in the context of the analysis of the polarized CMB emission. Polarization of the dust-correlated anomalous emission has been looked for around 10 GHz in specific clouds by Battistelli et al. (2006) and Mason et al. (2009). These studies find marginal polarization fraction for the anomalous emission. These results allow to exclude magnetic dipole models Draine & Lazarian (1999) and are in favor of the spinning dust emission Draine & Lazarian (1998b) which is the result of rotational excitation of the smallest dust grains (i.e. PAHs). The polarization extinction measurements in the UV clearly show that these small grains are weakly aligned on the magnetic field, unlike bigger grains. Therefore the spinning dust emission is not expected to be significantly polarized. Nevertheless, as the level of alignment of the PAHs on the magnetic field is not well constrained, it is not clear if polarized spinning dust from the diffuse ISM is present or not in the 10-100 GHz range. Its detection is challenging because of its low polarization level, the strong polarization fraction of the synchrotron emission and the limited signal-to-noise ratio of the available data.
6. Conclusion
The Galactic emission in the microwave range is rich and complex. Even with only continuum emission (free-free, synchrotron, thermal dust and anomalous emission), this wavelength range provides important diagnosis and tracers for all phases of the interstellar medium, cosmic rays, dust grains and the Galactic magnetic field. Fortunately for research on the interstellar medium, the detailed understanding of the Galactic microwave emission is one of the main challenges shared by all CMB experiments as it is proven to be the main obstacle for its study, especially in polarization.
It appears that the understanding of interstellar dust, through the thermal emission from big grains and the rotational emission from smaller ones, will be a major aspect of the CMB data analysis. Interstellar dust have been studied for a long time in the infrared and in UV-NIR extinction. Nevertheless very little is known on the big grains microwave emission, especially in polarization, but yet enough to expect significant spatial and spectral variations. With its adapted frequency coverage the Planck mission will provide the first all-sky map of dust polarized emission in the submm and, with it, a totally new view of the Galactic magnetic field.
At lower frequencies a strong debate about the existence of an anomalous emission and its separation from synchrotron has been on-going since the COBE results. It seems now clear that there is an extra component in the 20-50 GHz that can not be attributed to any known process. This emission has a very low (if any) polarization and it is very well correlated to interstellar dust tracers. Emission from small spinning dust grains is a very likely candidate.
Significant progress have been made since the COBE era on the understanding of the Galactic emission in the microwave range but the detailed exploration is only beginning. High hopes are set on on-going and future projects, especially the Planck mission.
Acknowledgments.
I would like to thank the conference organizers for inviting me. I acknowledge funds from the Canadian Space Agency in support of this work.
References
- Banday & Wolfendale (1991) Banday, A. J. & Wolfendale, A. W. 1991, MNRAS, 248, 705
- Bastien (2007) Bastien, P. 2007, in Sky Polarisation at far-infrared to radio wavelengths, ed. M.-A. Miville-Deschenes & F. Boulanger, EAS Publications Series, 23, 131–146
- Battistelli et al. (2006) Battistelli, E. S., Rebolo, R., Rubino-Martin, J. A., et al. 2006, ApJ, 645, L141
- Bennett et al. (2003) Bennett, C. L., Halpern, M., Hinshaw, G., et al. 2003, ApJS, 148, 1
- Bennett et al. (2003) Bennett, C. L., Hill, R. S., Hinshaw, G., et al. 2003, ApJS, 148, 97
- Bennett et al. (1992) Bennett, C. L., Smoot, G. F., Hinshaw, G., et al. 1992, ApJ, 396, L7
- Benoit et al. (2004) Benoit, A., Ade, P., Amblard, A., et al. 2004, A&A, 424, 571
- Bernard et al. (2007) Bernard, J. P., Ade, P., Debernardis, P., et al. 2007, in Sky Polarisation at Far-Infrared to Radio Wavelengths, ed. M.-A. Miville-Deschenes & F. Boulanger, EAS Publications Series, 23, 189–203
- Boudet et al. (2005) Boudet, N., Mutschke, H., Nayral, C., et al. 2005, ApJ, 633, 272
- Chapin et al. (2008) Chapin, E. L., Ade, P. A. R., Bock, J. J., et al. 2008, ApJ, 681, 428
- Davies et al. (2006) Davies, R. D., Dickinson, C., Banday, A. J., et al. 2006, MNRAS, 758, 758
- de Oliveira-Costa et al. (2002) de Oliveira-Costa, A., Tegmark, M., Finkbeiner, D. P., et al. 2002, ApJ, 567, 363
- Désert et al. (2008) Désert, F. X., Macías-Pérez, J. F., Mayet, F., et al. 2008, A&A, 481, 411
- Dickinson et al. (2007) Dickinson, C., Davies, R. D., Bronfman, L., et al. 2007, MNRAS, 379, 297
- Dickinson et al. (2003) Dickinson, C., Davies, R. D., & Davis, R. J. 2003, MNRAS, 341, 369
- Draine & Fraisse (2009) Draine, B. T. & Fraisse, A. A. 2009, ApJ, 696, 1
- Draine & Lazarian (1998a) Draine, B. T. & Lazarian, A. 1998a, ApJ, 494, L19
- Draine & Lazarian (1998b) Draine, B. T. & Lazarian, A. 1998b, ApJ, 508, 157
- Draine & Lazarian (1999) Draine, B. T. & Lazarian, A. 1999, ApJ, 512, 740
- Draine & Lee (1984) Draine, B. T. & Lee, H. M. 1984, ApJ, 285, 89
- Dupac et al. (2003) Dupac, X., Burgo, C. D., Bernard, J. P., et al. 2003, MNRAS, 344, 105
- Finkbeiner (2003) Finkbeiner, D. P. 2003, ApJS, 146, 407
- Finkbeiner (2004) Finkbeiner, D. P. 2004, ApJ, 614, 186
- Finkbeiner et al. (1999) Finkbeiner, D. P., Davis, M., & Schlegel, D. J. 1999, ApJ, 524, 867
- Giardino et al. (2002) Giardino, G., Banday, A. J., Gorski, K. M., et al. 2002, A&A, 387, 82
- Haslam et al. (1982) Haslam, C. G. T., Salter, C. J., Stoffel, H., & Wilson, W. E. 1982, A&AS, 47, 1
- Heiles (1996) Heiles, C. 1996, ApJ, 462, 316
- Hildebrand & Kirby (2004) Hildebrand, R. & Kirby, L. 2004, in Astrophysics of Dust, ed. G. C. C. Adolf N. Witt & B. T. Draine (ASP Conference Series, Vol. 309), 515
- Hildebrand (1988) Hildebrand, R. H. 1988, QJRAS, 29, 327
- Hinshaw et al. (2007) Hinshaw, G., Nolta, M. R., Bennett, C. L., et al. 2007, ApJS, 170, 288
- Johnstone et al. (2006) Johnstone, D., Matthews, H., & Mitchell, G. F. 2006, ApJ, 639, 259
- Kogut et al. (1996a) Kogut, A., Banday, A. J., Bennett, C. L., et al. 1996a, ApJ, 460, 1
- Kogut et al. (1996b) Kogut, A., Banday, A. J., Bennett, C. L., et al. 1996b, ApJ, 464, L5
- Kogut et al. (2007) Kogut, A., Dunkley, J., Bennett, C. L., et al. 2007, ApJ, 665, 355
- Kogut et al. (2009) Kogut, A., Fixsen, D. J., Levin, S. M., et al. 2009, ARCADE 2 Observations of Galactic Radio Emission, arXiv:0901.0562
- Lagache et al. (1998) Lagache, G., Abergel, A., Boulanger, F., & Puget, J. L. 1998, A&A, 333, 709
- Leitch et al. (1997) Leitch, E. M., Readhead, A. C. S., Pearson, T. J., & Myers, S. T. 1997, ApJ, 486, L23
- Li & Draine (2001) Li, A. & Draine, B. T. 2001, ApJ, 554, 778
- Marsden et al. (2008) Marsden, G., Ade, P. A. R., Benton, S., et al. 2008, in Millimeter and Submillimeter Detectors and Instrumentation for Astronomy IV, ed. S. W. W. D. Duncan, W. S. Holland & J. Zmuidzinas, Proceedings of the SPIE, 7020, 702002–702002
- Martin (2007) Martin, P. G. 2007, in Sky Polarisation at Far-Infrared to Radio Wavelengths, ed. M.-A. Miville-Deschênes & F. Boulanger, EAS Publications Series, 23, 165–188
- Mason et al. (2009) Mason, B. S., Robishaw, T., Heiles, C., Finkbeiner, D., & Dickinson, C. 2009, A Limit on the Polarized Anomalous Microwave Emission of Lynds 1622, arXiv:0901.0133
- Mathis et al. (1977) Mathis, J. S., Rumpl, W., & Nordsieck, K. H. 1977, ApJ, 217, 425
- Meny et al. (2007) Meny, C., Gromov, V., Boudet, N., et al. 2007, A&A, 468, 171
- Miville-Deschênes et al. (2008) Miville-Deschênes, M. A., Ysard, N., Lavabre, A., et al. 2008, A&A, 490, 1093
- Platania et al. (2003) Platania, P., Burigana, C., Maino, D., et al. 2003, A&A, 410, 847
- Ponthieu et al. (2005) Ponthieu, N., Macías-Pérez, J. F., Tristram, M., et al. 2005, A&A, 444, 327
- Ristorcelli et al. (1998) Ristorcelli, I., Serra, G., Lamarre, J. M., et al. 1998, ApJ, 496, 267
- Sun et al. (2008) Sun, X. H., Reich, W., Waelkens, A., & Enßlin, T. A. 2008, A&A, 477, 573
- Vaillancourt (2002) Vaillancourt, J. E. 2002, ApJS, 142, 53
- Vaillancourt (2007) Vaillancourt, J. E. 2007, in Sky Polarisation at Far-Infrared to Radio Wavelengths, ed. M.-A. Miville-Deschênes & F. Boulanger, EAS Publications Series, 23, 147–164