Sunspot seismic halos generated by fast MHD wave refraction
Abstract
Aims. We suggest an explanation for the high-frequency power excess surrounding active regions known as seismic halos.
Methods. We use numerical simulations of magneto-acoustic wave propagation in magnetostatic sunspot model.
Results. We propose that seismic halos can be caused by the additional energy injected by high-frequency fast mode waves refracted in the higher atmosphere due to the rapid increase of the Alfvén speed. Our model qualitatively explains the magnitude of the halo and allows to make some predictions of its behavior that can be checked in future observations.
Key Words.:
Magnetohydrodynamics (MHD) – Sun: magnetic fields – Sun: oscillations – Sun: helioseismology1 Introduction
Almost since the discovery of the 5-min solar oscillations it is well known that the oscillation power is reduced by some 40–60% in the photospheres of sunspots (Lites et al., 1982; Abdelatif et al., 1986; Brown et al., 1992; Title et al., 1992; Hindman & Brown, 1998). Later it was found that the high-frequency non-trapped wave power shows a suspicious enhancement in rings surrounding active regions, both in the photosphere (Brown et al., 1992) and in the chromosphere (Braun et al., 1992; Toner & Labonte, 1993). These power enhancements are known as “halos”. Their observational properties can be summarized as:
(i) The power enhancement is observed at high frequencies between 5.5 and 7.5 mHz for waves that are usually non-trapped in the non-magnetic quiet Sun.
(ii) The acoustic power measured in halos is larger than in the nearby quite Sun by about 40-60% (Hindman & Brown, 1998; Braun & Lindsey, 1999; Donea et al., 2000; Jain & Haber, 2002; Nagashima et al., 2007).
(iii) The halos are observed at intermediate longitudinal magnetic fluxes G, while the acoustic power is usually reduced at all frequencies at larger fluxes (Hindman & Brown, 1998; Thomas & Stanchfield, 2000; Jain & Haber, 2002).
(iv) The radius of the halo increases with height. In the photosphere the halos are located at the edges of active regions, while in the chromosphere they extend to a large portion of the nearby quiet Sun (Brown et al., 1992; Braun et al., 1992; Thomas & Stanchfield, 2000).
(v) The power increase in the halo is qualitatively similar in sunspots, pores and plages.
(vi) Significant reflection of the upcoming acoustic radiation at 5–6 mHz is detected in active regions, unlike the behavior of such high-frequency waves in the quiet Sun (Braun & Lindsey, 2000).
While several plausible mechanisms have been proposed to explain the acoustic power reduction for the strongest fields in active regions (e.g. MHD mode conversion; Cally & Bogdan, 1997), no accepted theory exists to explain the power enhancement in acoustic halos. The increase of the high-frequency acoustic emission, initially proposed by Brown et al. (1992) and Braun et al. (1992), seems not to find observational confirmations, since the observed continuum intensity does not show the halo effect (Hindman & Brown, 1998; Jain & Haber, 2002). Alternatively, the latter authors propose that the velocity in the surroundings of active regions may become field-aligned and some type of incompressible waves may be responsible for halos. This, however, lacks any observational evidence. Recently, Kuridze et al. (2008) suggested yet another mechanism based on acoustic waves trapped in field-free atmospheres lying below small-scale magnetic canopies of network cores and active regions. Interestingly, halos were observed recently in MHD simulations of waves in magnetic structures by Hanasoge (2008) and Shelyag et al. (2009). Based on his simulations, Hanasoge (2009) suggests that the power enhancement in halos is due to magnetic field induced mode mixing resulting in preferential scattering from low to high wave numbers.
In this Letter we propose a mechanism based on the fast MHD mode refraction in the vicinity of the transformation layer (where the Alfvén speed is equal to the sound speed ) that is capable to explain several observational properties of halos. In addition, we predict some new properties that can be obtained from observations in the future to confirm or discard this explanation.
2 Description of methods
We perform 2D numerical experiments that are essentially similar to those by Khomenko et al. (2009), to study the adiabatic propagation of magneto-acoustic waves excited by a single source located at sub-photospheric layers of a magneto-static sunspot model. The numerical MHD code is described in detail in Khomenko & Collados (2006); Khomenko et al. (2008). The unperturbed magnetostatic sunspot model is taken from Khomenko & Collados (2008). The simulation domain has Mm2 in horizontal and vertical directions, respectively, with a resolution of Mm and Mm. The whole domain contains magnetic field, but it becomes weak and dynamically unimportant further than 20 Mm from the sunspot axis. The maximum field strength in the photosphere is around 1 kG. Our sunspot model has a Wilson depression. With the help of the SIR radiative transfer code (Ruiz Cobo & del Toro Iniesta, 1992), from the known distribution of thermodynamic parameters in geometrical height, we calculated the optical depth scale, log, for each horizontal point of the MHS sunspot model. The photospheric level defined by the optical depth scale log is located 300 km deeper at the sunspot axis compared to its location 40 Mm far from the axis (see Figs. 1 and 2 in Khomenko et al., 2009). We define two reference levels of optical depth: log (“photosphere”) and log (“line formation”). At a horizontal distance Mm from the sunspot axis, the “photosphere” is located 500 km below the top boundary of our simulation domain. The “line formation” level is located 160 km above the “photosphere”. At 20 Mm from the axis, the level is above the “line formation” level by about 300 km, and at the axis it is located some 200 km below.
In the first set of experiments the source is placed at three different horizontal distances , 30 and 35 Mm from the sunspot axis and at km below the photosphere. The temporal behavior of the source is described by a Ricker wavelet (Parchevsky & Kosovichev, 2009; Khomenko et al., 2009) with a central frequency of 3.3 mHz. In the second set of experiments the source is placed at Mm and km, and it is harmonic and continuous in time with three different frequencies , 5 and 3.3 mHz. In all the cases the sunspot simulations are accompanied by non-magnetic simulations in the modified model S of Christensen-Dalsgaard et al. (1996) (see Parchevsky & Kosovichev, 2007) with exactly the same properties of the source and numerical treatment. The duration of simulations is about two physical hours.
3 Results
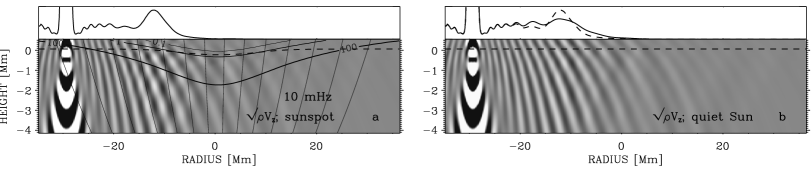
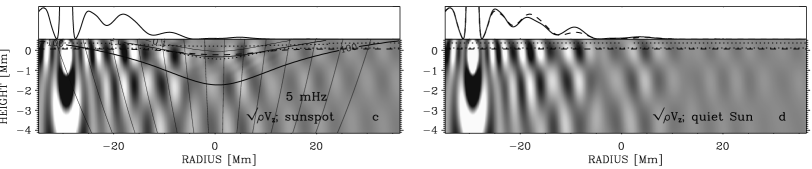
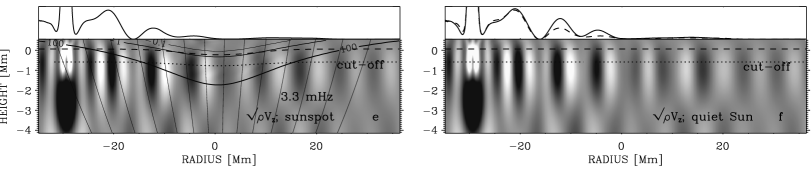
Fig. 1 shows snapshots of the vertical velocity in simulations with the harmonic source. When the wave frequency is well above the cut-off frequency ( mHz) the waves are propagating in the quiet Sun (Fig. 1b). This situation is different in the sunspot model. Significant reflections can be appreciated in Fig. 1a visible as an interference wave pattern around Mm. The reflection of the high-frequency waves is produced in the vicinity of the transformation layer. The fast (acoustic-like) waves generated by the source are transmitted as fast (magnetic) waves in the upper atmosphere where the Alfvén speed is larger that the sound speed (). In the magnetically dominated layers these waves are refracted (see Khomenko & Collados, 2006) and are returned back to the sub-photospheric layers where they interfere with the waves coming from the source. This behavior of waves is clearly seen on the movie of this simulation, attached as on-line material to this paper. The r.m.s. vertical velocity amplitude measured at the line formation level (dashed curves in Fig. 1a and b) shows a suspicious bump on the left from the location where the log contour crosses the contour (see upper plots on each panel). This bump is absent in the quiet Sun simulation. We propose that the increase in the high-frequency power in halos surrounding active regions can be produced by the additional energy injected by the fast mode waves refracted in the magnetically dominated layers back to sub-photospheric layers. The presence of the upward and downward propagating wave energy manifest itself as the wave interference pattern. Note that this mechanism does not necessarily imply that the high-frequency fast waves are trapped in sunspots, since a part of their energy can leak into the slow mode waves after each mode transformation at the layer. However, this mechanism produces significant reflections of the high-frequency waves that otherwise are propagating in the quiet Sun.
When the wave frequency is below the photospheric cut-off frequency ( mHz, Fig. 1e, f) the fast mode waves become evanescent before reaching the transformation layer. In this case neither refraction nor interference can be produced because of the absence of fast to fast mode transmission. Fig. 1e, f (upper plots) shows that the r.m.s. amplitude distributions are very similar in the sunspot and the quiet Sun simulations and that the amplitudes in the sunspot case are always lower than in the quiet Sun.
The mHz case (Fig. 1c, d) shows an intermediate situation, where the waves are reflected both due to cut-off effects and the magnetic effects. In this case the cut-off height (dotted lines) almost coincides with the height. Some power excess is still present in the sunspot case compared to the quiet Sun. The bump is weaker and is now located more near the source as the interference happens at another location due to the different wavelength. Note that the r.m.s. velocity distribution is less smooth for the and 3.3 mHz compared to mHz, as several nodes are present in the horizontal (and vertical) direction due to the evanescent character of waves.
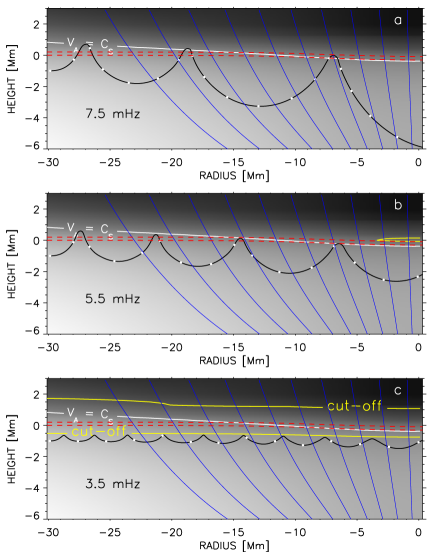
The eikonal solution for the fast mode wave (Cally, 2006; Moradi & Cally, 2008; Khomenko et al., 2009) allows to get a more complete physical picture of the wave behavior at different frequencies. Fig. 2 gives the wave paths of the fast mode waves launched from their lower turning point (that roughly coincides with the location of the source in the simulations). At high frequencies ( mHz) the waves penetrate higher up in the atmosphere above the line formation layer where they are refracted back down due to the presence of the magnetic field. In the low-frequency case (3.5 mHz, Fig. 2c) the waves are sharply reflected from the cut-off layer and are less affected by the magnetic field. Note that the power excess (halos) at high-frequency should form at distances where the refraction of the fast mode occurs above the line formation layer, i.e. where the layer lies above the photosphere. Otherwise it would not be detected in spectral observations. This happens in regions of intermediate field strengths. Under no circumstances can the halo form in the “umbral” zone with strong fields where is larger than in the photosphere.
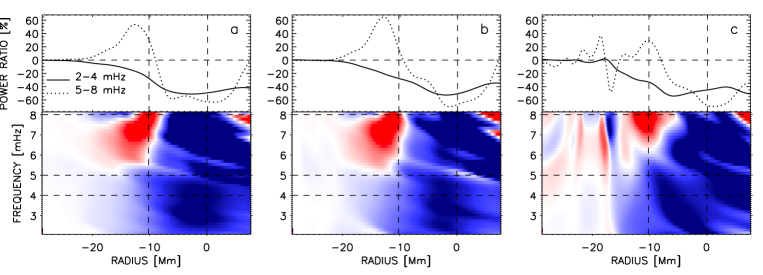
A more realistic situation with the source emitting a spectrum of waves is considered in Fig. 3. In this figure we compare the wavelet source simulations with different source locations. We represent the ratio between the photospheric Fourier power in the sunspot and in the quiet Sun at different frequencies as a function of horizontal distance. We conclude that, independently of the position of the source, the overall picture is very similar especially for the sources at and Mm. For the source located at the Mm from the axis, the magnetic field plays already some role and modifies the properties of the source compared to the purely non-magnetic case, thus contaminating the detailed picture. Still, even in this case, halo power increase is present around Mm, being weaker than in the other two cases. Fig. 3 shows a power excess at high frequencies above 5.5 mHz at distances Mm from the sunspot axis (the latter position coincides with the location where in the photosphere). At low frequencies, a power deficit is observed in the sunspot. The power deficit is also present at high frequencies in the “umbral” region. The power averaged over both, low-frequency and high-frequency, bands shows a 40-60% decrease in the umbra relative to the quiet Sun. This decrease is because part of the source energy is lost after the multiple mode transformations (see Cally & Bogdan, 1997). In the high-frequency band, however, there is an excess of the power up to some 40–50%. Note that the magnitude of the halo in our simulations is in a good agreement with the observed one (e.g. Hindman & Brown, 1998).
4 Discussion and Conclusions
Our results indicate that the halo effect happens in a natural way due to additional energy input from the high-frequency fast mode waves produced after their refraction. The halo is produced in the photospheric regions where the field is intermediate implying that the Alfvén speed is lower than the sound speed. The halo is not observed at low frequencies because these waves are already reflected below the transformation layer. The halo is not observed in the umbral part of the sunspot because the refraction happens below the layer visible in spectral line observations.
In our simulations, the halo is observed at the periphery of the strong field zone where the field is inclined by some 30–40 degrees. For sunspots with larger field strengths than considered here, the level would be located deeper and would intersect the log level further from the sunspot axis. Thus, for models with more intense magnetic field, we expect the halo will appear at larger distances from the sunspot axis. Also, by increasing the magnetic field inclination in the penumbra of the sunspot model, the fast to fast mode transmission will be more efficient (Cally, 2006) and we can expect the magnitude of the halo to be somewhat larger.
Based on our model, we can speculate regarding some observed properties of the halo as well as others (still undetected) that may be interesting to observe in the future.
(i) Several observations indicate that the radius of the halo increases with height (Brown et al., 1992; Braun et al., 1992; Thomas & Stanchfield, 2000). This effect can be qualitatively explained by our model. As follows from e.g. Fig.1, with increasing height, the layer is located at progressively larger distances from the sunspot axis. Observed in chromospheric lines, the condition necessary to detect the halo (i.e. that the line formation layer lies below the layer) would be fulfilled at larger distances from the sunspot axis, and, in a natural way, this would produce halos with larger radius. We can predict that, after some height in the chromosphere where the whole atmosphere is magnetically dominated the halos should disappear.
(ii) Our model also explains qualitatively the observations of Braun & Lindsey (2000) who detected significant reflection of the high-frequency waves in active regions.
(iii) The horizontal velocity component (not shown in this paper) shows a stronger magnitude of the halo effect as the waves propagate nearly horizontally at the heights where they are refracted. Thus, we suggest that the magnitude of the halo in off-center observations should be stronger. We are aware of only one observations of this kind (Toner & Labonte, 1993), where apparently no change of the halo magnitude was detected. However, more observations are required to confirm/discard this conclusion.
(iv) Since the magnitude of the mode transformation and reflection at the layer depends on the magnetic field inclination (Cally, 2006), we can speculate that halos, when detected with high resolution observations, should show fine structure effects in active region penumbral filaments, being more pronounced for horizontal fields.
Acknowledgements.
This research has been funded by the Spanish Ministerio de Educación y Ciencia through projects AYA2007-63881 and AYA2007-66502.References
- Abdelatif et al. (1986) Abdelatif, T. E., Lites, B. W., & Thomas, J. H. 1986, ApJ, 311, 1015
- Braun & Lindsey (1999) Braun, D. C. & Lindsey, C. 1999, ApJ, 513, L79
- Braun & Lindsey (2000) —. 2000, Solar Phys., 192, 307
- Braun et al. (1992) Braun, D.C., Lindsey, C., Fan, Y., & Jefferies, S.M. 1992, ApJ, 392, 739
- Brown et al. (1992) Brown, T. M., Bogdan, T. J., Lites, B. W., & Thomas, J. H. 1992, ApJ, 394, L65
- Cally (2006) Cally, P. 2006, Phil. Trans. R. Soc. A, 364, 333
- Cally & Bogdan (1997) Cally, P. S. & Bogdan, T. J. 1997, ApJ, 486, L67
- Christensen-Dalsgaard et al. (1996) Christensen-Dalsgaard, J., Dappen, W., Ajukov, S. V., & 30 co-authors. 1996, Science, 272, 1286
- Donea et al. (2000) Donea, A.-C., Lindsey, C., & Braun, D. C. 2000, Sol. Phys., 192, 321
- Hanasoge (2008) Hanasoge, S. M. 2008, ApJ, 680, 1457
- Hanasoge (2009) Hanasoge, S. M. 2009, A&A, in press
- Hindman & Brown (1998) Hindman, B. W. & Brown, T. M. 1998, ApJ, 504, 1029
- Jain & Haber (2002) Jain, R. & Haber, D. 2002, A&A, 387, 1092
- Khomenko & Collados (2006) Khomenko, E. & Collados, M. 2006, ApJ, 653, 739
- Khomenko & Collados (2008) —. 2008, ApJ, 689, 1379
- Khomenko et al. (2008) Khomenko, E., Collados, M., & Feliipe, T. 2008, Solar Phys., 251, 589
- Khomenko et al. (2009) Khomenko, E., Kosovichev, A., Collados, M., Parchevsky, K., & Olshevsky, V. 2009, ApJ, 694, 411
- Kuridze et al. (2008) Kuridze, D., Zaqarashvili, T. V., Shergelashvili, B. M. & Poedts, S. 2008, Annales Geophysicae, 26, 2983
- Lites et al. (1982) Lites, B. W., White, O. R., & Packman, D. 1982, ApJ, 253, 386
- Moradi & Cally (2008) Moradi, H. & Cally, P. 2008, Solar Phys., 215, 309
- Nagashima et al. (2007) Nagashima, K., Sekii, T., Kosovichev, A. G., et al. 2007, PASP, 59, S631
- Parchevsky & Kosovichev (2007) Parchevsky, K. V. & Kosovichev, A. G. 2007, ApJ, 666, 547
- Parchevsky & Kosovichev (2009) —. 2009, ApJ, 694, 573
- Ruiz Cobo & del Toro Iniesta (1992) Ruiz Cobo, B., del Toro Iniesta, J. C. 1992, ApJ, 398, 375
- Shelyag et al. (2009) Shelyag, S., Zharkov, S., Fedun, V., Erdélyi, R., Thompson, M. J. 2009, A&A, 501, 735
- Thomas & Stanchfield (2000) Thomas, J. H. & Stanchfield, D. C. H. 2000, ApJ, 537, 1086
- Title et al. (1992) Title, A. M., Topka, K. P., Tarbell, T. D., Schmidt, W., Balke, C., & Scharmer, G. 1992, ApJ, 393, 782
- Toner & Labonte (1993) Toner, C. G. & Labonte, B. J. 1993, ApJ, 415, 847