Fermi Observations of the Large Magellanic Cloud
Abstract
We report on observations of the Large Magellanic Cloud with the Fermi Gamma-Ray Space Telescope. The LMC is clearly detected with the Large Area Telescope (LAT) and for the first time the emission is spatially well resolved in gamma-rays. Our observations reveal that the bulk of the gamma-ray emission arises from the 30 Doradus region. We discuss this result in light of the massive star populations that are hosted in this area and address implications for cosmic-ray physics. We conclude by exploring the scientific potential of the ongoing Fermi observations on the study of high-energy phenomena in massive stars.
Centre d’Étude Spatiale des Rayonnements, CNRS/Université de Toulouse, PO Box 44346, 31028 Toulouse Cedex 4
1. Introduction
Since the early days of high-energy gamma-ray astronomy it has become clear that the gamma-ray flux received at Earth is dominated by emission from the Galactic disk (Clark et al. 1968). This emission can be well understood in terms of cosmic-ray interactions with the interstellar medium (Strong 2007). At energies MeV, the generation of diffuse gamma-ray emission is dominated by the decay of produced in collisions between cosmic-ray nuclei and interstellar medium nuclei. Ultimately, the study of this hadronic gamma-ray emission may provide hints on the still mysterious origin of the galactic cosmic-rays. However, the interpretation of the galactic diffuse gamma-ray emission is complicated by the fact that a large number and variety of individual sources contribute along the line of sight to the observed emission, thus blurring the link between individual cosmic-ray acceleration sites and observed gamma-ray signatures in our Galaxy.
Gamma rays from cosmic-ray interactions are also expected from nearby galaxies, and indeed, the EGRET telescope aboard the Compton Gamma-Ray Observatory (CGRO) has for the first time detected gamma-ray emission from the Large Magellanic Cloud (LMC) (Sreekumar et al. 1992). The LMC is an excellent target for studying the link between cosmic-ray acceleration and gamma-ray emission since this galaxy is nearby (bringing the sources fluxes in reach of modern gamma-ray telescopes) and since the system is nearly seen face-on (avoiding the superposition of sources along the line of sight that hampers studies in our own Galaxy). In addition, the LMC is rather active, housing many supernova remnants, bubbles and superbubbles and massive star forming regions that are all potential sites of cosmic-ray acceleration (Biermann 2004; Cesarsky & Montmerle 1983; Binns et al. 2007).
The Large Area Telescope (LAT) aboard the Fermi Gamma-Ray Space Telescope (FGST) provides now the capabilities to study diffuse gamma-ray emission from nearby galaxies in depth, and of the LMC in particular (Digel et al. 2000; Weidenspointner et al. 2007). We report here on the initial analysis of observations taken in the course of the first year’s all-sky survey by the LAT .
2. Observations
The LAT is the primary instrument on the FGST satellite which has been launched from Cape Canaveral on June 11th, 2008. The LAT is an imaging, wide field-of-view, high-energy gamma-ray telescope, covering the energy range from below 20 MeV to more than 300 GeV. The LAT is a pair-conversion telescope with a precision tracker made of a stack of 18 x,y silicon tracking planes and a calorimeter made of 96 CsI(Tl) crystals. The tracker array is covered by a segmented anticoincidence shield allowing for the rejection of charged particle backgrounds.
The LAT has a large sr field of view, and compared to earlier gamma-ray missions, has a large effective area ( cm2 on axis at GeV for the event selection used in this paper), improved angular resolution ( 68% containment radius at 1 GeV) and low dead time ( s per event). The energy resolution in the 100 MeV - 10 GeV energy range is better than %. A detailed description of the instrument is given by Atwood et al. (2009). The on-orbit instrument calibration is presented by Abdo et al. (2009).
The data used in this work covers the period August 8th 2008 – April 24th 2009 and amounts to 211.7 days of continuous sky survey observations. During this period a total exposure of cm s2 (at 1 GeV) has been obtained for the LMC region.
2.1. Data preparation
The data analysis presented in this paper has been performed using the ScienceTools version v9r11 and the instrument response functions P6_V3. We collected all data obtained within the period August 8th 2008 – April 24th 2009 and applied the diffuse event class filter that has been designed to minimize contamination by instrumental background while retaining a substantial fraction of the signal. As has been pointed out by Atwood et al. (2009), any harsher event cut would not significantly improve the signal-to-noise ratio.
We further excluded from the data all periods where the spacecraft has entered the South Atlantic Anomaly (SAA) and for which the spacecraft z-axis points more than away from the zenith direction (the zenith direction being defined by the vector running from the Earth center through the spacecraft). While the SAA cut excludes periods of particular large instrumental background from the analysis, the latter cut excludes periods where the Earth enters the field of view. Furthermore, to minimize contamination from Earth albedo photons we exclude photons with zenith angles above from the analysis. We further restricted the analysis to photon energies above 200 MeV where our current knowledge of the instrument response implies systematic uncertainties that are smaller than and where the redistribution of photons in energy due to incomplete energy measurements becomes negligible.
2.2. Morphology
To illustrate the distribution of observed gamma-ray photons in the LMC region we show in Fig. 1 a counts-map of the area. The arrival directions of observed photons in the 200 MeV - 100 GeV energy range have been binned into large pixels covering a large area around the position . The binned map has then been smoothed using a 2D adaptive Gaussian kernel smoothing technique (Ebeling et al. 2006) to remove Poissonian noise that arises from the relatively small number of counts that have been registered. The signal-to-noise ratio (s.n.r.) has been set to 10 to reduce statistical noise variations to below in the image.
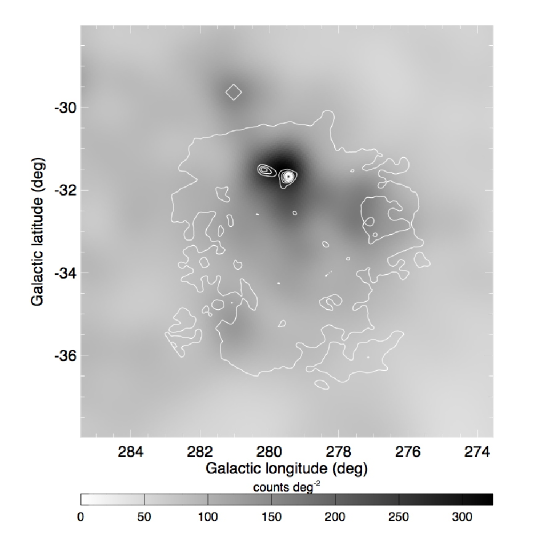
We overlay as contours on the Fermi/LAT counts map the extinction map of Schlegel et al. (1998) as tracer of the total gas column density in the LMC. To first order the extinction scales linearly with total gas column density, and we chose 10 linearly spaced contours to allow the reader to visually appreciate the distribution of gas column densities in the LMC. Obviously, a substantial fraction of the gas is found in a small area in the north of the LMC, at roughly , which coincides with the 30 Doradus star forming region.

The high-energy gamma-ray photons that are observed from the LMC also peak in this area. The photon intensity in the 30 Dor region exceeds counts/deg2 while in most of the remaining regions of the LMC is remains below counts/deg2 (the background rate around the LMC is around counts/deg2). The excess near 30 Dor is also clearly seen in the longitude and latitude profiles of the photon intensity observed by LAT that is shown in Fig. 2.
Within a rectangular box covering galactic longitudes and galactic latitudes we find a total number of counts within the energy range 200 MeV - 100 GeV above the expected contributions from galactic diffuse emission, extragalactic diffuse emission, instrumental background, and the blazar CRATES J060106-703606. These background contributions have been estimated by fitting spatial and spectral templates of their emission components together with a spatial template for the LMC emission to the data. Galactic diffuse emission has been modelled spatially and spectroscopically using the GALPROP model (Strong 2007) version 54_59Xvarh7S111 Available from the website: http://galprop.stanford.edu while for the combination of extragalactic diffuse emission and residual instrumental background we assume an isotropic emission with a power law spectral distribution. CRATES J060106-703606 is modeled as a point source at with a power-law spectral distribution. For the LMC we use the extinction map of Schlegel et al. (1998) as spatial template from which we subtract a pedestal level of from all pixels and for which we set all pixels outside a radius of around to zero in order to extract the LMC emission. As spectral model we assume a power law for the LMC.
To describe the morphology of the high-energy gamma-ray emission from the LMC we first fit a point source with free position and flux on top of the background model222From now on we call the combination of the GALPROP model, the isotropic model and the CRATES J060106-703606 point source the background model of our analysis. The free parameters of this background model are the normalization of the GALPROP model, the intensity and spectral slope of the isotropic component, and the flux and spectral slope of the CRATES J060106-703606 point source. to our data. This results in a best-fitting point-source position of with a statistical 95% confidence error radius of (the systematic position uncertainty is estimated to less than ). We note that this position is close to that of R 136, the central star cluster of 30 Dor, which is located at , i.e. at an angular distance of from our best-fitted point-source location.
The detection significance of the LMC can be estimated using the so-called Test Statistics (TS) which is defined as twice the difference between the log-likelihood that is obtained by fitting the LMC model on top of the background model to the data, and the log-likelihood that is obtained by fitting the background model only, i.e. . Under the hypothesis that our model satisfactorily explains the Fermi/LAT data, TS follows a distribution with degrees of freedom, where is the number of free parameters in the LMC model (Cash 1979). In the particular case of a point source with free position, flux and spectral index we have and the measured TS of 869.1 corresponds to a significance of .
As next step we replace the point source model by an extended source model which we implement as axisymmetric 2D Gaussian shape with variable angular size . In addition to the size we again fitted the position, flux and power law spectral index of the source. This results in a best-fitting source position of (with a 95% confidence radius of ), and source extent of . The TS amounts to 1088.5 which is larger by 219.4 than the value obtained for the point-source model. Since we added one additional parameter (the source extent ) with respect to the point-source model we obtain the significance of the source extension from the distribution to .
Alternatively to the geometrical models we also compare the Fermi/LAT data to various spatial templates that trace the interstellar matter distributions in the LMC. For neutral hydrogen (H I) we use the aperture synthesis and multibeam data that Kim et al. (2005) have combined from ATCA and Parkes observations. For molecular hydrogen we use CO observations of the LMC obtained with the NANTEN telescope (Yamaguchi et al. 2001). We further used the extinction map of Schlegel et al. (1998) (SFD) as tracer of the total gas column density and compare also our data to the 100 m IRIS map that has been obtained by reprocessing the IRAS survey data (Miville-Deschênes & Lagache 2005). The results of this comparison are summarized together with that of the geometrical models in Table 1.
The best fits are obtained for the SFD extinction map and the IRAS 100 m infrared map which give TS values of and , respectively. For 2 free parameters (the total flux in the map and the spectral index) this corresponds to a detection significance of . An almost equally good fit is obtained using the neutral hydrogen map. Fitting instead the CO map to the LAT data provides a rather poor fit, suggesting that the gamma-ray morphology differs from that of molecular gas in the LMC. Fitting the H I and CO maps together to the data confirms this result since the fit attributes of the total flux to the H I component. Correspondingly, the TS increase with respect to fitting the H I gas map alone is also negligible.
The H I/SFD/IRIS 100 m maps fit the data considerably better than a single point source, adding further evidence that the observed high-energy gamma-ray emission is extended in nature. Furthermore, the 2D Gaussian source model cannot reach the fit that is obtained by those tracer maps, suggesting that the emission morphology is more complex than a single Gaussian shape.
| LMC model | TS | Parameters |
|---|---|---|
| Point source | 869.1 | 4 |
| 2D Gaussian source | 1088.5 | 5 |
| H I gas map | 1173.4 | 2 |
| CO gas map | 932.2 | 2 |
| H I + CO gas maps | 1176.1 | 4 |
| SFD extinction map | 1179.6 | 2 |
| IRIS 100 m infrared map | 1179.1 | 2 |
2.3. Spectrum
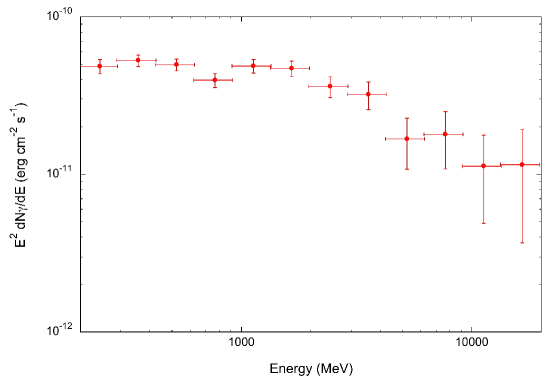
Using the extinction map of Schlegel et al. (1998) (i.e. our best fitting spatial template of the high-energy emission) we extract a spectrum of the LMC by fitting the data in 12 logarithmically-spaced energy bins covering the energy range 200 MeV - 20 GeV. Above 20 GeV, photons from the LMC become too sparse in our actual data set to allow for meaningful spectral points to be derived.
Figure 3 shows the LMC spectrum that has been obtained by this method. Our analysis indicates a spectral steepening of the emission with increasing energy, suggesting that a simple power law is an inadequate description of the data. We confirm this trend by fitting the data using a broken power law instead of a simple power law. This results in an improvement of the TS by corresponding to a significance of () of the spectral steepening. Fitting alternatively an exponentially cutoff power law improves the TS by with respect to the simple power law, corresponding to a significance of () of the spectral cutoff. Integrating the broken power law or the exponentially cutoff power law model over the energy range 100 MeV – 500 GeV gives identical photon fluxes of ph cm-2s-1 and an energy fluxes of erg cm-2s-1 for the LMC. The systematic uncertainty in these flux measurements amounts to .
3. Discussion and conclusions
Sreekumar et al. (1992) reported the first detection of the LMC in MeV gamma rays based on 4 weeks of data collected with the EGRET telescope aboard CGRO. Due to EGRET’s limited angular resolution and the weak emission detected from the LMC, details of the spatial structure of the galaxy could not have been resolved. However, it has been obvious from EGRET data that the LMC was an extended gamma-ray source.
Fermi/LAT allows now for the first time to clearly resolve the gamma-ray emission of the LMC and to attribute the emission maximum to the 30 Dor star forming region. While this coincidence could be taken as a hint for an enhanced cosmic-ray density in 30 Dor with respect to the rest of the galaxy, we note that a substantial fraction of the interstellar gas of the LMC is also confined to the 30 Dor area. Consequently, the target density for cosmic-ray interactions is greatly enhanced in this region which implies a corresponding enhancement of the gamma-ray luminosity. Whether the data do also support an enhanced cosmic-ray density in 30 Dor with respect to the rest of the galaxy needs a more detailed analysis of the observations.
The rather poor fit of the CO map to the LAT data suggests that the overall distribution of gamma-ray emission differs from that of molecular hydrogen. The distribution of neutral hydrogen fits the data considerably better and the combined fit of H I and CO maps indicates that any contribution to the gamma-ray emission that is correlated to the molecular gas is at best marginal. This agrees well with expectations since the gas budget of the LMC is largely (90-95%) dominated by neutral hydrogen (Fukui et al. 1999). Consequently we are presently unable to determine the CO-to-H2 conversion factor, XCO, from our LMC data.
Fichtel et al. (1991) performed a detailed modelling of the cosmic-ray distribution in the LMC and predicted an integrated MeV photon flux of ph cm-2s-1 for the galaxy. Pavlidou & Fields (2001) predicted an integrated MeV photon flux of ph cm-2s-1 based on estimates of the LMC supernova rate and total gas densities. Our observed flux of ph cm-2s-1 falls at the hide side of these estimates, yet given the uncertainties in the models the agreement can be judged satisfactorily.
Further studies of the LMC with Fermi/LAT will now concentrate on the spectral analysis of the data, with particular emphasize on variations of the spectral shape throughout the galaxy. Thanks to the excellent sensitivity and angular resolution of the LAT, this is the first time that such studies become possible. And other nearby galaxies await their detection, such as the Small Magellanic Cloud or the Andromeda Galaxy (M31). Both should be in reach of Fermi and the comparative study of their diffuse gamma-ray emission should help to understand the impact of the environment and metallicity on the physics of cosmic rays.
References
- Abdo et al. (2009) Abdo, A.A., Ackermann, M., Ajello, M., et al. 2009a, Instrumentation and Methods for Astrophysics, submitted (astro-ph/0904.2226)
- Atwood et al. (2009) Atwood, W.B., Abdo, A.A., Ackermann, M., et al. 2009, ApJ, submitted (astro-ph/0902.1089)
- Binns et al. (2007) Binns, W.R., Wiedenbeck, M.E., Arnould, M., et al. 2007, SSRv, 130, 439
- Biermann (2004) Biermann, P.L. 2004, New Astronomy Reviews, 48, 41
- Cash (1979) Cash, W. 1979, ApJ, 228, 939
- Clark et al. (1968) Clark, G.W., Garmire, G.P., & Kraushaar, W.L. 1968, ApJ, 153, 203
- Cesarsky & Montmerle (1983) Cesarsky, C.J., & Montmerle, T. 1983, SSRv, 36, 173
- Digel et al. (2000) Digel, S.W., Moskalenko, I., Ormes, J.F., et al. 2000, AIP, 528, 449
- Ebeling et al. (2006) Ebeling, H., White, D.A., & Rangarajan, F.V.N. 2006, MNRAS, 368, 65
- Fichtel et al. (1991) Fichtel, C.E., Özel, M.E., Stone R.G., & Sreekumar, P. 1991, ApJ, 374, 134
- Fukui et al. (1999) Fukui, Y., Mizuno, N., Yamaguchi, R., et al. 1999, PASJ, 51, 745
- Healey et al. (2007) Healey, S.E., Romani, R.W., Taylor, G.B., et al. 2007, ApJS, 171, 61
- Kim et al. (2005) Kim, S., Staveley-Smith, L., Dopita, M.A., et al. 2005, ApJS, 143, 487
- Miville-Deschênes & Lagache (2005) Miville-Deschênes, M.-A., & Lagache, G. 2005, ApJS, 157, 302
- Pavlidou & Fields (2001) Pavlidou, V., & Fields, B.D. 2001, ApJ, 558, 63
- Schlegel et al. (1998) Schlegel, D.J., Finkbeiner, D.P., & Davis, M. 1998, ApJ, 500, 525
- Sreekumar et al. (1992) Sreekumar, P., Bertsch, D.L., Dingus, B.L., et al. 1992, ApJ, 400, L67
- Strong (2007) Strong, A.W. 2007, Ap&SS, 309, 35
- Weidenspointner et al. (2007) Weidenspointner, G., Lonjou, V., & Knödlseder, J. 2007, AIP, 921, 498
- Yamaguchi et al. (2001) Yamaguchi, R., Mizuno, N., Onishi, T. et al. 2001, PASJ, 53, 959