Comparison of Alpha-Element Enhanced Simple Stellar Population Models with Milky Way Globular Clusters
Abstract
We present simple stellar population (SSP) models with scaled-solar and -element enhanced abundances. The SSP models are based on the Dartmouth Stellar Evolution Database, our library of synthetic stellar spectra, and a detailed systematic variation of horizontal-branch (HB) morphology with age and metallicity. In order to test the relative importance of a variety of SSP model ingredients, we compare our SSP models with integrated spectra of 41 Milky Way Globular Clusters (MWGCs) from Schiavon et al. (2005). Using the Mg and Ca4227 indices, we confirm that Mg and Ca are enhanced by about +0.4 and +0.2 dex, respectively, in agreement with results from high resolution spectra of individual stars in MWGCs. Balmer lines, particularly H and H, of MWGCs are reproduced by our -enhanced SSP models not only because of the combination of isochrone and spectral effects but also because of our reasonable HB treatment. Moreover, it is shown that the Mg abundance significantly influences Balmer and iron line indices. Finally, the investigation of power-law initial mass function (IMF) variations suggests that an IMF much shallower than Salpeter is unrealistic because the Balmer lines are too strong on the metal-poor side to be compatible with observations.
1 Introduction
Understanding the star formation and chemical enrichment histories of galaxies from their integrated spectrophotometries is one of the overarching goals of modern astronomy and astrophysics. Over the last two decades, we have learned that massive elliptical galaxies have enhanced -element abundances, such as Mg, compared to the Sun (Worthey et al. 1994; Worthey 1998; Lee & Worthey 2005). According to CDM cosmology, it is usually suggested that star formation was most intense at the deep potentials inhabited by massive ellipticals. Their intense star formation skewed the chemical abundance pattern toward the yields from massive core-collapse supernovae.
Central to this line of investigation, the Lick/IDS spectral indices have been widely used to derive the mean age and metallicity of stellar systems such as star clusters and galaxies. It is therefore essential to validate the simple stellar population (SSP; single age and single metallicity) models by comparing conclusions derived from theoretical integrated Lick spectral indices with results obtained from resolved stellar population studies. The most suitable nearby sample is arguably the Milky Way globular clusters (MWGCs). They are generally old, span a broad range of metallicity, and show some -element enhancement.
There have been many efforts in the literature to understand the integrated spectroscopic properties of MWGCs (e.g., Burstein et al. 1984; Gibson et al. 1999; Vazdekis et al. 2001; Lee, Yoon, & Lee 2000; Schiavon et al. 2002; Thomas et al. 2003; Lee & Worthey 2005). Although there is mounting evidence that the MWGCs are perhaps not an ideal representatives of SSPs (e.g., Piotto 2009; Yi 2009), they are still very useful targets for the purpose of testing SSP models.
In order to compute the theoretical integrated Lick/IDS spectral indices from SSP models for the broad range of age and metallicity, three components are generally used. They are (1) stellar isochrones and/or evolutionary tracks, (2) stellar spectra, and (3) empirically derived Lick spectral index fitting functions. The fitting functions of Worthey et al. (1994)111 Worthey & Ottaviani (1997) for H, H, H, H. There are different sets of fitting functions in the literature (e.g., Schiavon 2007). have been built upon the Lick stellar library that basically follows the galactic chemical enrichment histories throughout the broad metallicity coverage. In a nutshell, stars on the metal-poor side ([Fe/H] 1.0) are generally -element enhanced, [/Fe] +0.4 dex and near solar metallicity they are solar-scaled, i.e., [/Fe] = 0.0.
Stellar evolutionary models and high resolution synthetic spectral libraries have been updated frequently. Some recent examples of -element enhanced stellar models are Kim et al. (2002), Pietrinferni et al. (2006), VandenBerg et al. (2006), and Dotter et al. (2007b). In this work, we present scaled-solar and -element enhanced SSP models for a broad range of age and metallicity that employ the Dotter et al. (2007b) stellar evolution models and the Lee et al. (2009) high resolution synthetic stellar spectra. A detailed systematic variation of horizontal-branch (HB) morphology with age and metallicity is incorporated in order to faithfully represent the MWGCs. Lee et al. (2000) investigated the effects from HB stars with a detailed variation of HB morphologies as a function of age and metalicity. Their input ingredients were, however, the amalgamation of the Revised Yale isochrones with Yi et al. (1997) HB evolutionary tracks. In this work, our HB morphology treatment is based on the recent study by Dotter (2008). This work differs from recent efforts by Coelho et al. (2007) and Schiavon (2007) in that we cover a broader range of metallicity and age and adopt different isochrones, stellar spectra, and reasonable treatment of HB morphology222 Coelho et al. (2007)’s [Fe/H] range is only from 0.5 to +0.2 and that of Schiavon (2007) is from 1.3 to +0.3. Schiavon (2007) focused only for the blue side of the spectra, so he did not cover Fe5406 index..
Milky Way globular clusters are known for their different degree of -element enhancement from scaled-solar chemical abundances (e.g., Pritzl, Venn, & Irwin 2005). Thus it is important to self-consistently include these abundances patterns at every stage of SSP model construction. We examine our new models with the large, homogeneous dataset of MWGC integrated spectra compiled by Schiavon et al. (2005; hereafter S05). Earlier observational efforts in this category include Burstein et al. (1984), Cohen et al. (1998), and Puzia et al. (2002). However, the S05 dataset is the larget and most representative of the MWGC population.
In the following section, we describe our new models in detail. The results from our models are depicted in 3. Our models are compared with Lick indices measured from the S05 data in 4. Section 5 summarizes and concludes this work.
2 Models
The present models are direct descendents of an evolutionary population synthesis code that was developed to study the stellar populations of globular clusters and galaxies (Lee, Yoon, & Lee 2000; Lee, Lee, & Gibson 2002; Lee et al. 2004; Lee & Worthey 2005; Lee et al. 2009). In this work, we take advantage of the recent emergence of isochrones and HB evolutionary tracks with -element enhancement at fixed [Fe/H] from (Dotter et al., 2007b) accompanied with Lee et al. (2009) high resolution synthetic spectra. We describe how we generate reasonable HB morphologies in section 2.2. The standard Salpeter (1955) initial mass function (IMF) was employed for calculating the relative number of stars along the isochrones. The variation of IMF is, however, investigated and depicted in section 2.3. The investigated ages are 8, 11, and 14 Gyr and the metallicities cover [Fe/H] with [/Fe] = 0.0 and +0.4.
We defer the detailed studies on the effects of multiple populations (Piotto 2009), He-enhancement (Yi 2009), CNONa chemical inhomogeneity (Pietrinferni et al. 2009), blue stragglers (Cenarro et al. 2008), and binary stars in GCs to future work.
2.1 -Element Enhancement
In this study, we are illuminating the differences between scaled-solar and +0.4 dex -element enhancement at fixed [Fe/H] in the SSP models by varying (1) isochrones alone, (2) synthetic spectra alone, and (3) both isochrones and spectra.
2.1.1 -enhanced isochrones
The stellar evolution models that we employ were described by Dotter et al. (2007b) and we refer the reader to that paper for complete details. We have used their stellar evolution models at [Fe/H] = 2.5, 2.0, 1.5, 1.0, 0.5, and 0 with [/Fe] = 0.0 and +0.4 and ages from 8 to 14 Gyr. These are complemented by a self-consistent set of He-burning tracks that extend from the zero-age HB (ZAHB) to the onset of thermal pulsations on the asymptotic giant branch (AGB). In the models, -enhancement refers to enhancements in the -capture elements O, Ne, Mg, Si, S, Ca, and Ti by the same amount as specified in [/Fe]. The models assume that the initial He mass fraction follows = 0.245 + 1.54, where = 0.245 is the primordial He abundance from big bang nucleosynthesis (Spergel et al. 2003) and the required initial He abundance of the calibrated solar model is = 0.274.
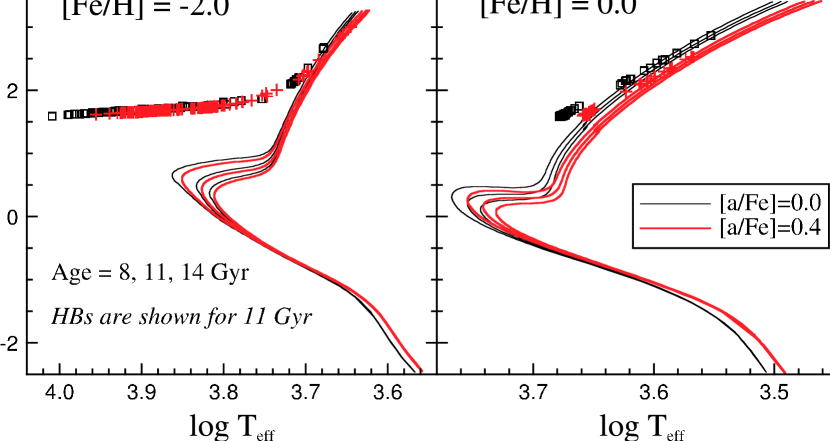
It must be emphasized that our -enhanced stellar models in this work are set at fixed [Fe/H], rather than fixed metal mass fraction , so the -elements add additional metals and make the isochrones cooler in general. In this setting, the temperature differences are more significant on the metal-rich side than on the metal-poor as illustrated in Figure 1. The scaled-solar and +0.4 dex -enhanced stellar models of Dotter et al. (2007b) are contrasted in the H-R diagrams at 8, 11, and 14 Gyr in Figure 1. The left panel shows the -element enhancement at [Fe/H] = 2.0, while the right panel displays that at [Fe/H] = 0.0.
2.1.2 -enhanced synthetic spectra
Investigations into the effects of individual elements on stellar spectra, with the intent of applying the results to galaxy spectra, include such works as Tripicco & Bell (1995) and Korn et al. (2005), who gauged the effects of ten individual elements on the Lick system of 25 pseudo-equivalent width indices introduced by Worthey et al. (1994) and Worthey & Ottaviani (1997). In order to investigate the effects of -element enhancement on the Lick/IDS indices at solar and super-solar metallicity, Lee & Worthey (2005) employed the updated response functions by Houdashelt et al. (2002), which expanded the earlier work of Tripicco & Bell (1995) regarding the sensitivity of each Lick spectral indices as the abundances of individual chemical elements are varied.
The newly compiled synthetic spectra that we employ in this study were described in Lee et al. (2009) and we refer the reader to that paper for details. As noted in Lee et al. (2009), the synthetic spectra are not very accurate in absolute predictions (c.f. Korn et al., 2005; Serven, Worthey, & Briley, 2005) hence we employ a differential approach in which the fitting functions of Worthey et al. (1994) and Worthey & Ottaviani (1997) are used as the zero point, and delta-index information as a function of element ratio is incorporated via measuring the synthetic spectral library. This procedure is similar to that of previous investigations (e.g., Trager et al. 2000a, b; Proctor & Sansom 2002; Thomas et al. 2003; Lee & Worthey 2005; Schiavon 2007) but more sophisticated since an entire grid of delta-index information was used as opposed to 2 or 3 synthetic stars at solar abundance as in previous works.
The Lick stellar library generally follows the galactic chemical enrichment, i.e., [/Fe] = +0.4 for [Fe/H] 1.0, [/Fe] = +0.2 for [Fe/H] = 0.5, and [/Fe] = 0.0 for [Fe/H] = 0.0 (e.g., Reddy et al. 2006). In order to compensate for this intrinsic abundance trend rooted in the stellar library, we have employed the synthetic spectra of [/Fe] = 0.4 for [Fe/H] 1.0, that of [/Fe] = 0.2 for [Fe/H] = 0.5, and that of [/Fe] = 0.0 for [Fe/H] = 0.0 for our solar-scaled SSP models. Then for our 0.4 dex -enhanced SSP models, we have used the synthetic spectra of [/Fe] = 0.0 for [Fe/H] 1.0, that of [/Fe] = +0.2 for [Fe/H] = 0.5, and that of [/Fe] = +0.4 for [Fe/H] = 0.0.
2.2 Horizontal-Branch Morphologies
Following our earlier work (Lee et al. 2000, 2002, 2004; Lee & Worthey 2005), we fully account for the detailed systematic variation of HB morphology with age and metallicity. In Lee et al. (2000) and Lee et el. (2002), we basically followed the Reimers massloss formula which led to a variation in massloss with age and metallicity. In this work, we have instead employed the Dotter (2008) mass loss scheme to represent the MWGC HB morphologies. We have adopted a massloss of 0.16 for [Fe/H] = 1.5, 1.0, 0.5, and 0.0; 0.08 for [Fe/H] = 2.0; and 0.015 for [Fe/H] = 2.5 from Figure 3 of Dotter (2008). 0.02 is used for the mass dispersion. It is important to recognize that Dotter (2008) was focused on a set of similarly old age GCs in that paper so that there was no claim of an age dependence on mass loss. Nevertheless, this trend should be fine so long as it is applied to old GCs. Examples of HB morphologies in the H-R diagram are shown in Figure 1 at [Fe/H] = 2.0 (left panel) and 0.0 (right panel) for 11 Gyr. The small squares are HB stars for the solar-scaled models, while the crosses are the +0.4 dex -enhanced models. Similar to the isochrones, the -enhanced HB stars at fixed [Fe/H] are also generally cooler than their solar-scaled counterparts.
The number of HB stars are estimated from the number for stars that evolved off the RGB using the Salpeter (1955) IMF. We find that our -parameter values (i.e., the number of HB stars over the number of RGB stars at the zero-age HB stars) are similar to Salaris et al. (2004). Besides the number of HB stars, there are several parameters that can vary the HB morphologies at given age and metallicity such as different mass dispersion, different He, different mass-loss. Observationally, indeed, there are variations of HB morphologies at given [Fe/H] within the GC population. We assign, however, a single HB morphology at a given age and metallicity by delegating a mass dispersion, and a mass-loss as described above. The purpose of this study is not to investigate the detailed match between our SSP models and the observations of every single GC, but rather to examine the overall match for the entire range of metallicity.
2.3 IMF Variations
For the calculation of the relative number of stars along the isochrones, we have adopted the standard Salpeter (1955) power-law IMF, where the number of stars () in mass interval () is described by
| (1) |
with = 2.35 in this study. However, we have also investigated the variation of IMF as depicted in the below. The above simple power-law IMF with = 2.35 has been varied with exponents of = 3.35 (dwarf star-dominant = bottom-heavy IMF) and 1.35 (giant star-dominant = top-heavy IMF). We find that the = 3.35 case decreases the RGB number density down to 20%, and the = 1.35 case increases the RGB number density up to 375%, relative to that of the standard Salpeter IMF with = 2.35. As the HB star number density scales with the RGB stars, it is seen in the bottom right panels of Figures 2 12 that the HB effect becomes significantly more important for the top-heavy IMF.
3 Differential Model Comparisons
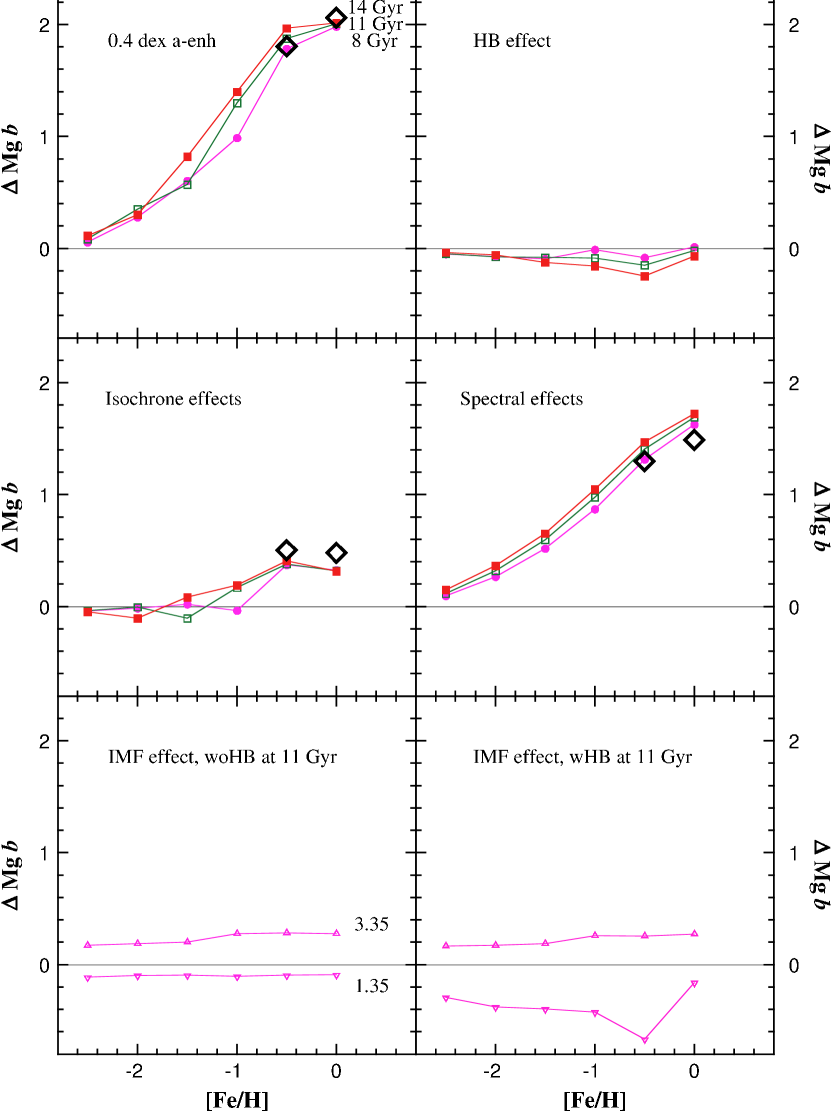
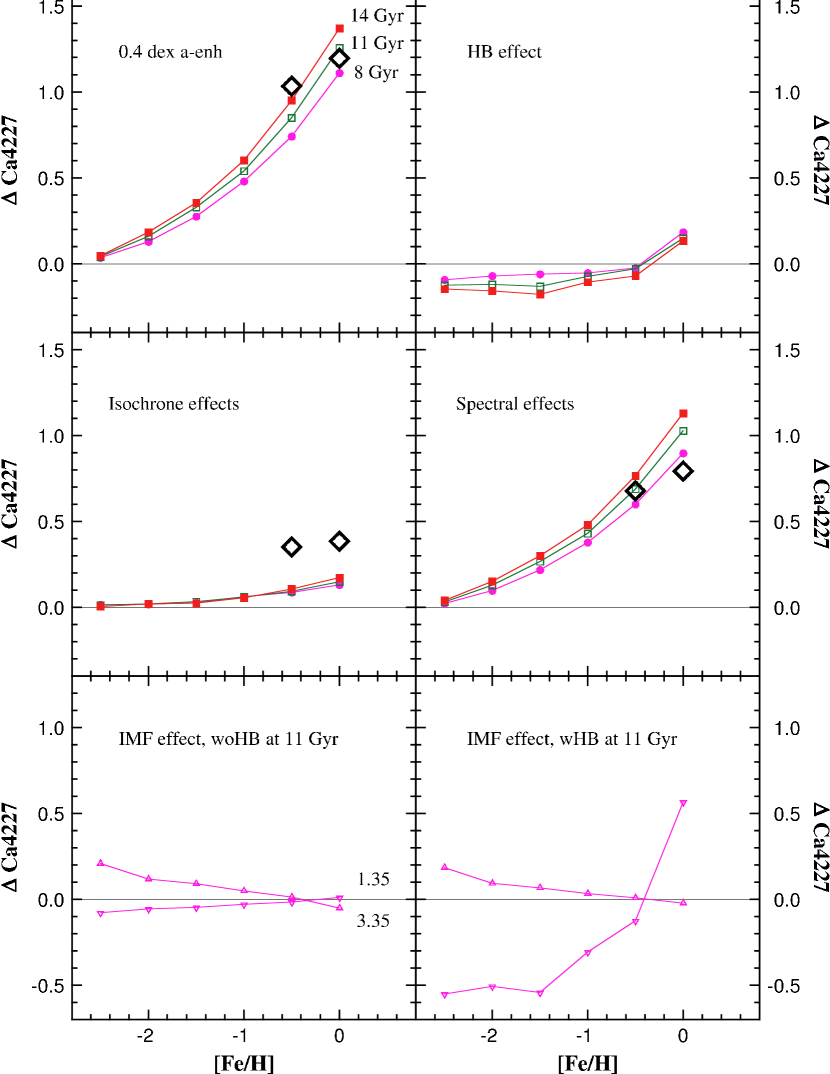
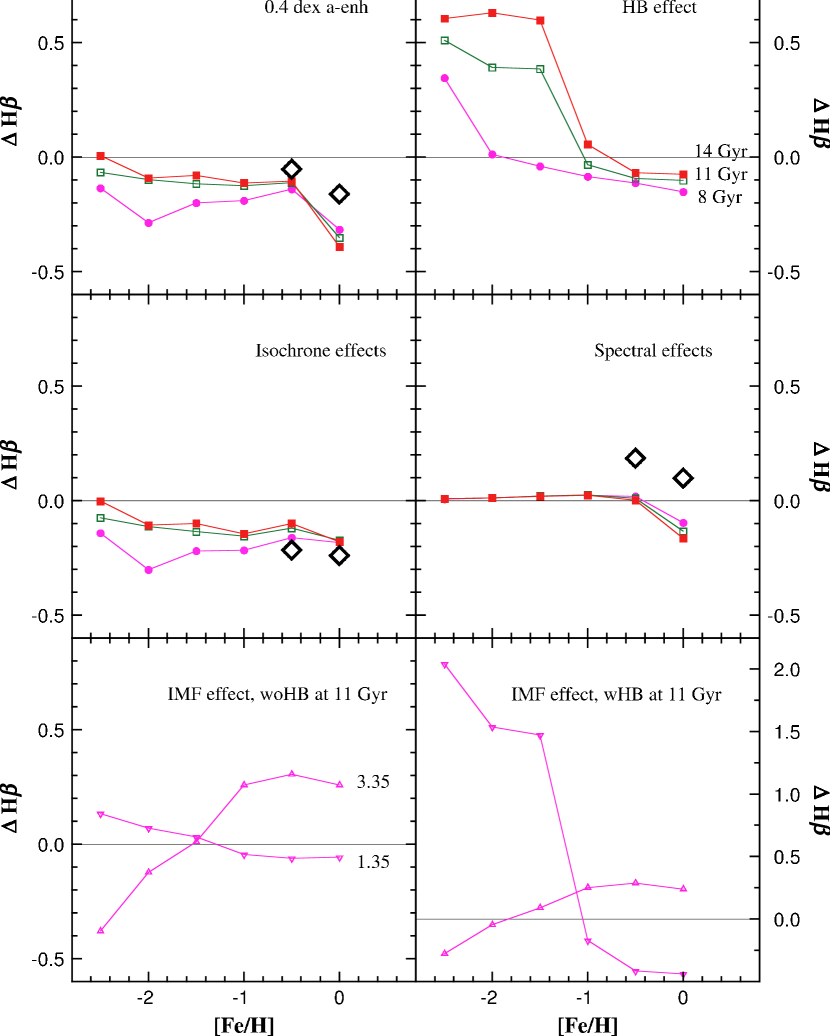
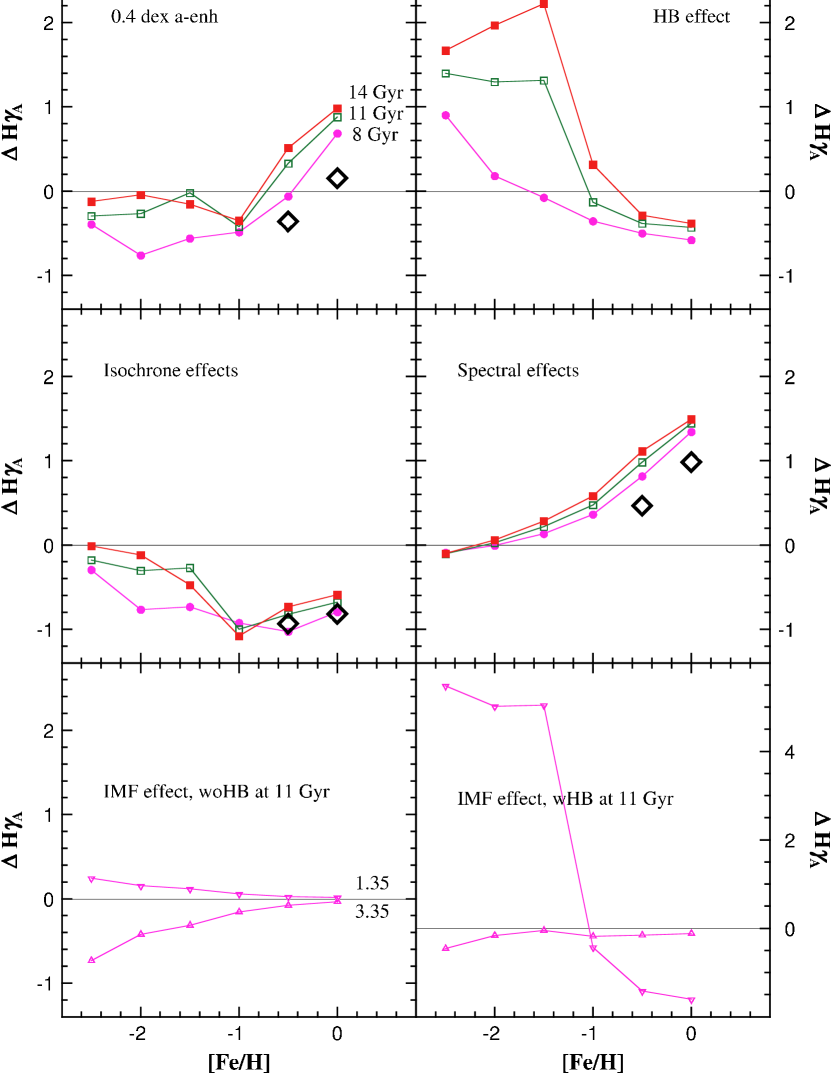
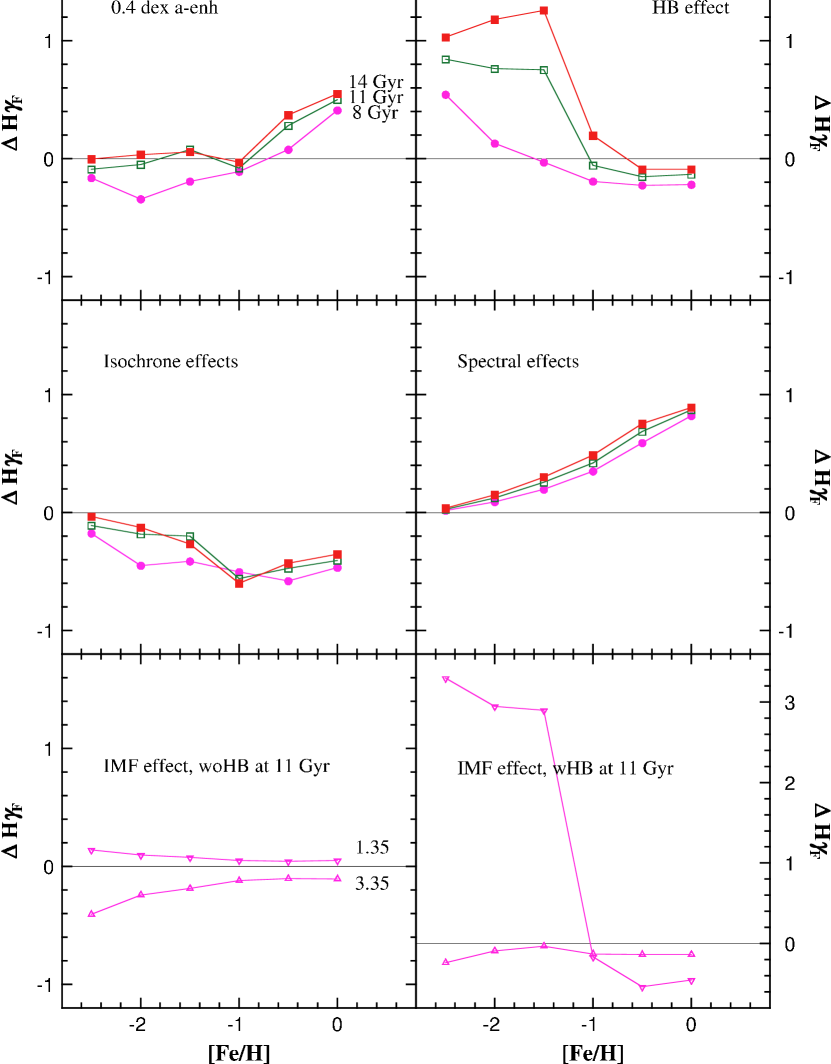
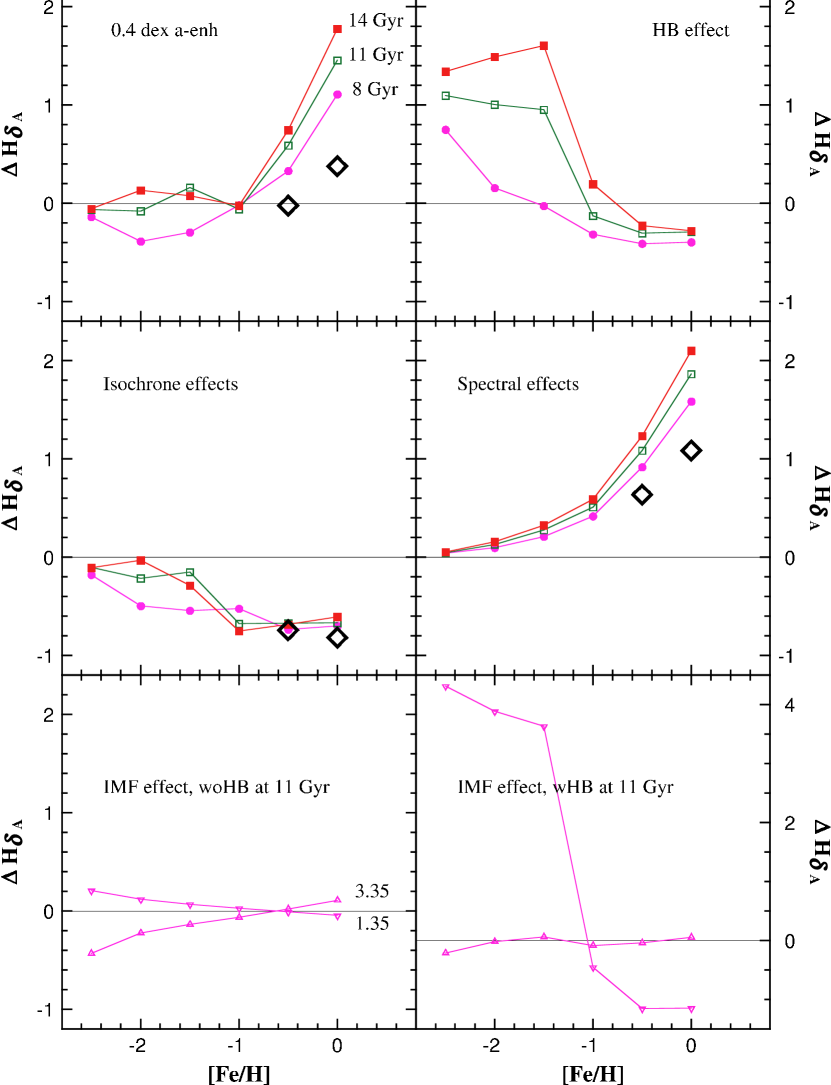
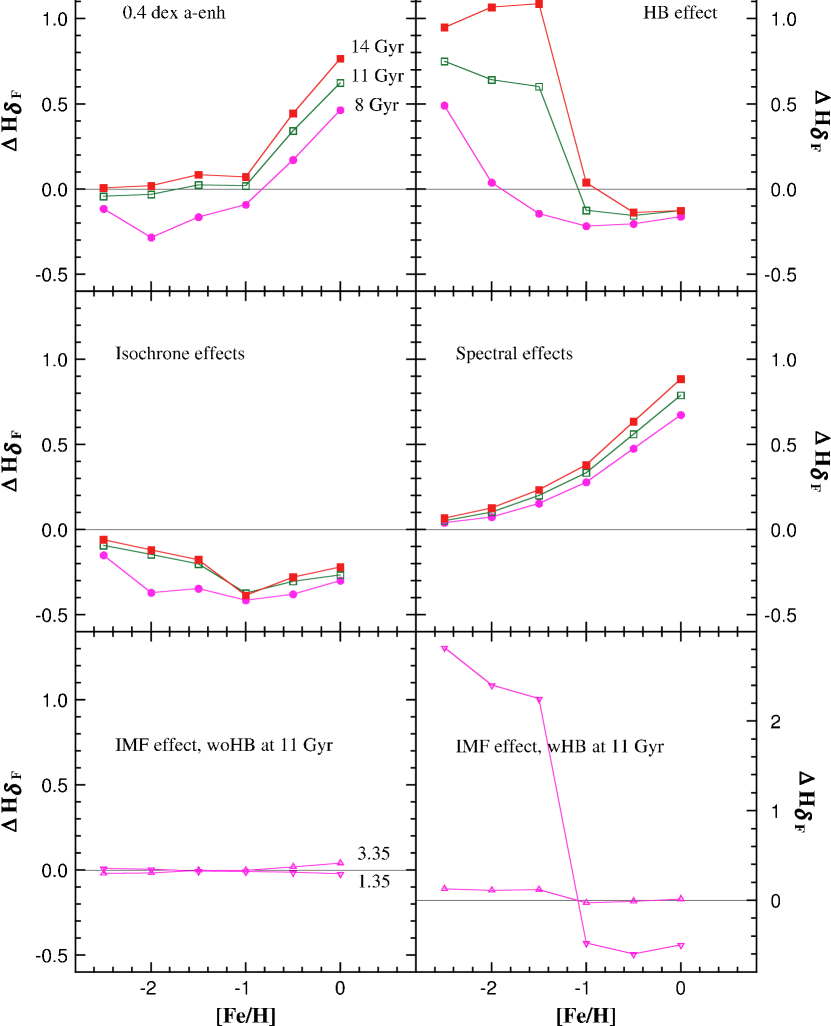
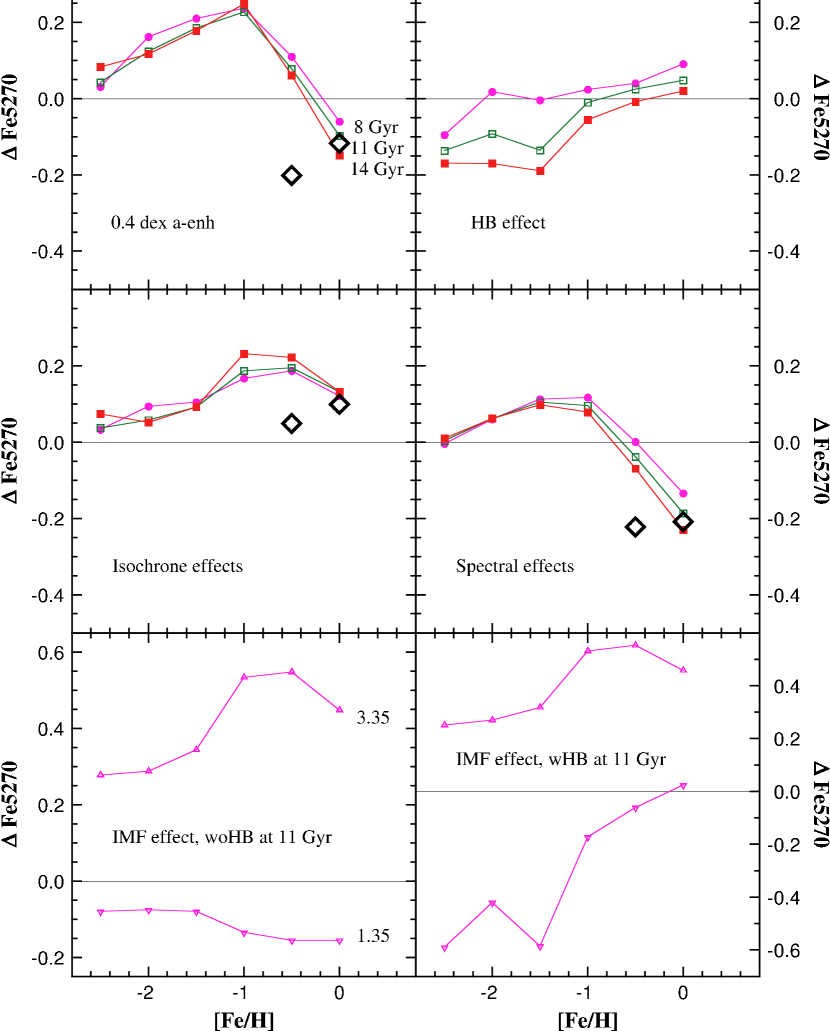
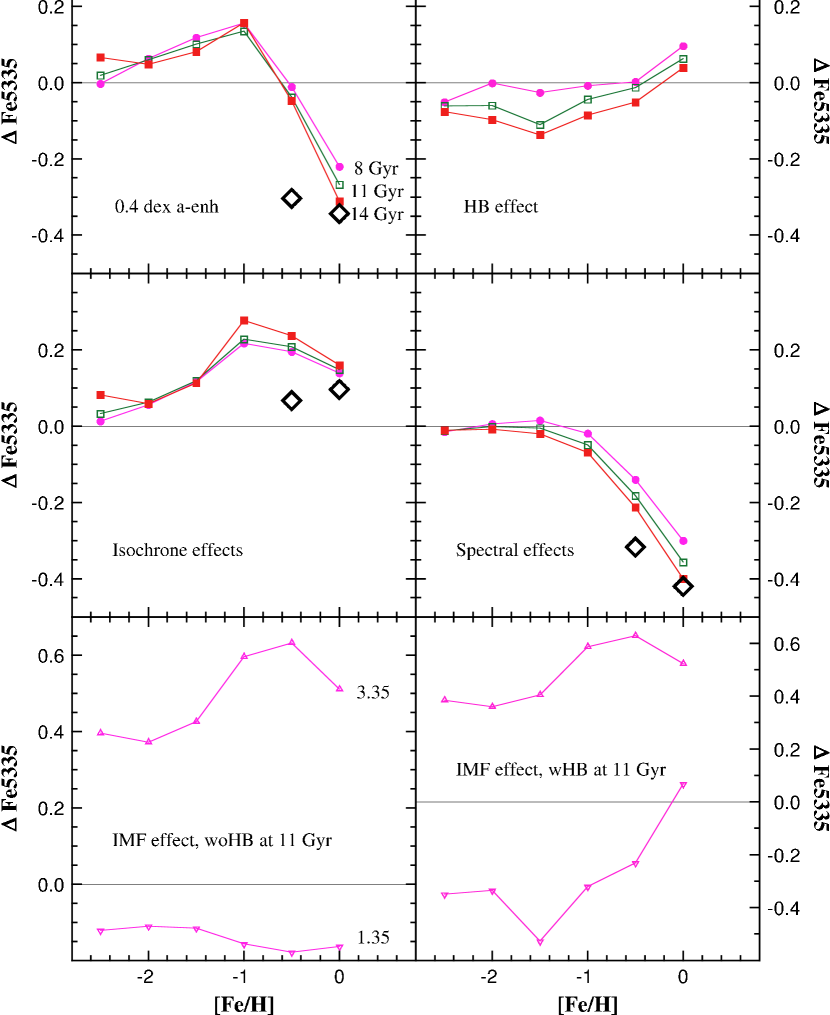
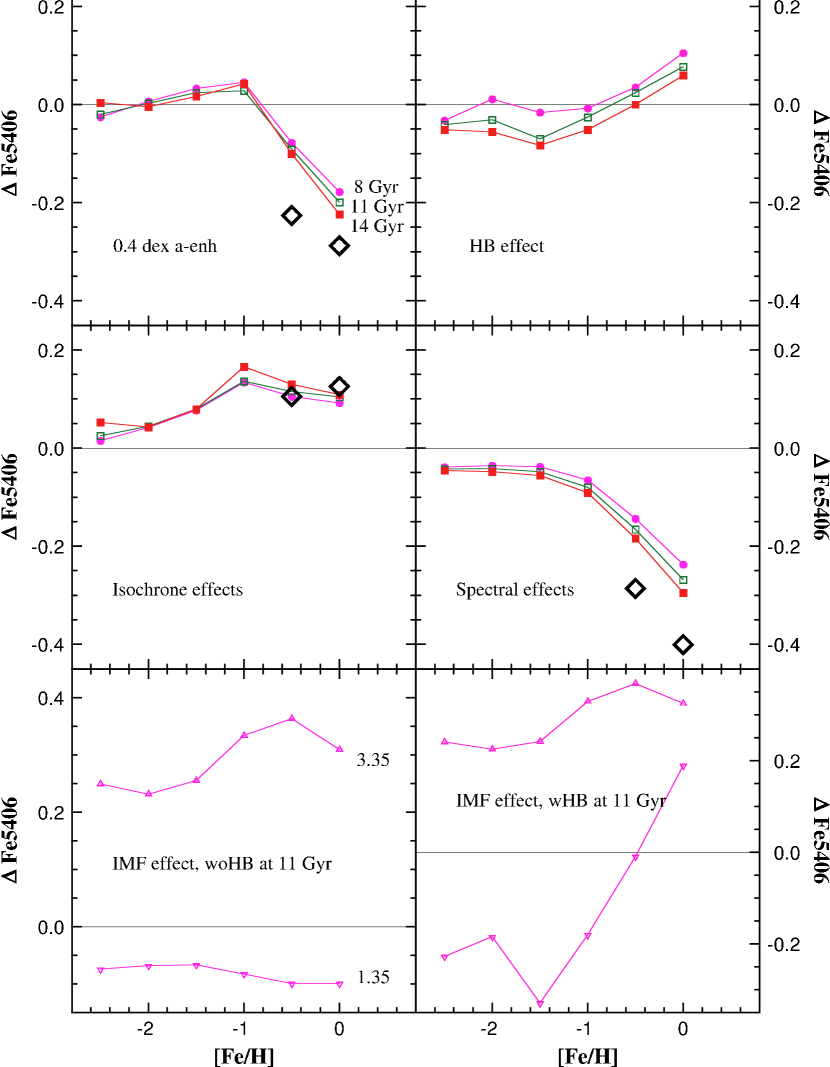
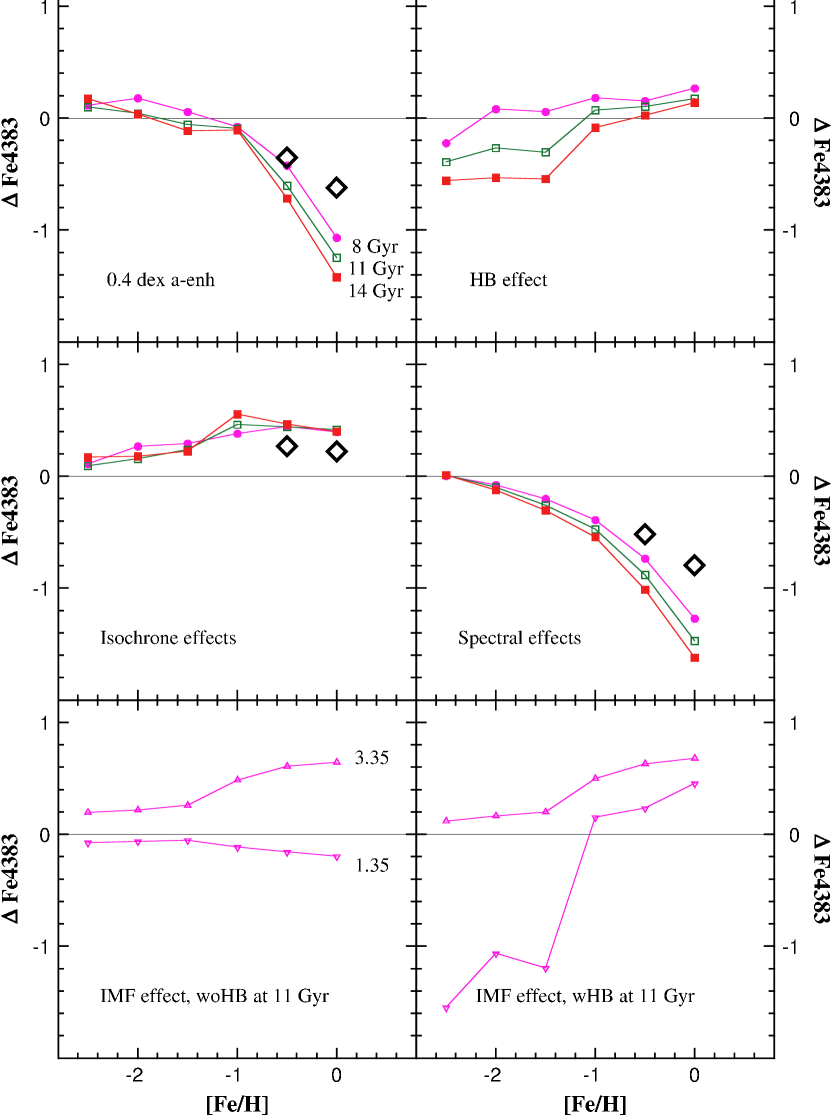
Having depicted the theoretical aspects of generating the scaled-solar and -enhanced Lick spectral indices in 2, we now present the results of our SSP models. The effects due to -element enhancement in the isochrones and spectra, HB stars, and IMF variation on several Lick indices are illuminated in Figures 2 12. The figures are organized as follows: In the top left panel, the differences between scaled-solar and -enhanced models (both isochrones and spectra are enhanced) without HB stars (aa-woHB ss-woHB) are displayed. The top right panel shows the effect of HB stars on the -enhanced models (aa-wHB aa-woHB). The middle left panels display isochrone effects alone without HB stars (as-woHB ss-woHB), while the middle right panels show spectral effects alone without HB stars (sa-woHB ss-woHB). Thus, the top left panels illustrate the combination of the middle panels. Table 1 lists the spectral effects of 0.4 dex enhancements of individual -elements as well as that of whole -element at 11 Gyr, without the consideration of HB stars, at [Fe/H] = 1.0 and 0.0 for our investigated Lick indices.
In Figures 2 - 5, 7, and 9 - 12, we have compared our model results with Coelho et al. (2007) at [Fe/H] = 0.5 and 0.0 using their Tables 15 and 17. Their SSP models are for 12 Gyr and they are depicted with diamonds. Because of differences in isochrones and synthetic spectra that are used in this study and Coelho et al. (2007), we find some differences. Regarding the isochrones, there are mixing length differences between two studies, = 1.6 for Coelho et al. (2007) and 1.938 for Dotter et al. (2007b). According to Figure 1 of Yi (2003), larger makes RGB temperature warmer. There are also differences among the treatment of overshooting and diffusion. Regarding the synthetic spectra, Coelho et al. (2007) are mainly based on ATLAS model atmosphere as shown their Figure 5, but Lee et al. (2009) are mainly based on MARCS model atmosphere for the similar range of temperature and luminosity. These dissimilar model inputs collectively make some different model outputs as shown in Figures 2 - 5, 7, and 9 - 12. It would be interesting to see how Coelho et al. models are compared with our models and Milky Way globular clusters when their models are extended toward the metal-poor regime.
The bottom panels of Figures 2 12, depict the variation of IMF effect (the exponent, of the power-law IMF in equation (1) between 1.35 and 3.35) without (bottom left panels) and with HB stars (bottom right panels) at 11 Gyr for our 0.4 dex -enhanced models.
3.1 Mg and Ca4227
Mg :
The top left panel of Figure 2 shows that Mg becomes significantly stronger with -element enhancement as a function of metallicity. It is demonstrated in the middle panels of Figure 2 that both -enhanced isochrones and spectra make Mg stronger as a function of [Fe/H], but the latter effects dominates. The top panels show that HB stars do not influence Mg very much compared to -element enhancement and, in fact, make Mg slightly weaker. The bottom left panel of Figure 2 shows that Mg increases about 0.2 Å with a bottom-heavy IMF and decreases about 0.1 Å with a top-heavy IMF; the bottom right panels shows that the IMF effect is slightly reduced if HB stars are included. It is understood that low-mass main sequence stars make Mg strong.
Ca4227:
Similar to Mg , it is shown in the middle panels of Figure 3 that both -enhanced isochrones and spectra make Ca4227 stronger as a function of [Fe/H] but, as with Mg , the latter effect dominates. Also the top panels display that HB stars do not affect Ca4227 much compared to abundance effects in the models, as with Mg . The bottom panels show that IMF effect is not very significant though the top-heavy IMF becomes noticeable because of the enhanced effect of HB stars.
Table 1 indicates that Mg and Ca4227 are predominantly affected by Mg and Ca among elements, respectively. At [Fe/H] = 0.0, Ca4227 is also sensitive to oxygen though only about 25% of the effect is due to calcium.
3.2 Balmer Line Indices
H:
It can be seen in the top right panel of Figure 4 that H increases as much as 0.7 Å on the metal-poor side ([Fe/H] 1.0) for old stellar populations due to blue HB stars. Also, it is noted from the middle panels of Figure 4 that the -element effects come mostly from the cooler isochrones, which weaken the temperature sensitive H. The spectral effects are almost negligible, except at solar metallicity. According to Table 1, it is Mg that dilutes the H at [Fe/H] = 0.0. The bottom left panel displays that H increases with a bottom-heavy IMF on the metal-rich side ([Fe/H] 1.0), but the bottom right panel shows that the effect of HB stars become considerably more important with a top-heavy IMF, particularly on the metal-poor side ([Fe/H] 1.0).
H, H:
Similar to H, the top right panels of Figures 5 and 6 show that H and H increase as much as 2.4 Å and 1.4 Å, respectively on the metal-poor side ([Fe/H] 1.0) for old stellar populations due to blue HB stars. Also, it is noted from the middle panels of Figures 5 and 6 that the isochrone and spectral effects due to -element are opposite. According to Table 1, H becomes stronger with Mg-, O-, and Si-enhancement, while it becomes weaker with Ti-enhancement. The spectral effects are much less significant for H than for H as noted in Lee et al. (2009).
Similar to H and H, the top right panels of Figures 7 and 8 show that H and H increase as much as 1.8 Å and 1.2 Å, respectively on the metal-poor side ([Fe/H] 1.0) for old stellar populations due to blue HB stars. Also, it is seen from the middle panels of Figures 7 and 8 that the isochrone and spectral effects due to -enhancement are opposite, similar to H. According to Table 1, H becomes stronger with Mg-, Si-, Ca-, and O-enhancement in decreasing order of importance, while becomes weaker with Ti-enhancement. On the contrary, H becomes stronger with Si-, Ca-, and Mg-enhancement in decreasing order of importance, while becomes weaker with Ti-enhancement. It is noted from Table 1 that the effect of O-enhancement is minimal in H among H and H indices. Furthermore, the effect of Mg-enhancement on H considerably attenuates compared to that on H.
The IMF effect in the bottom panels of Figures 5 8 is similar to what we denoted in Figure 4 for H. The top-heavy IMF makes both H and H considerably stronger on the metal-poor side ([Fe/H] 1.0) mostly because of the enhanced effect of HB stars. Without the consideration of HB stars, the bottom left panel of Figure 8 displays that the IMF effect on H is minimal among Balmer lines.
3.3 Iron Line Indices
Fe5270, Fe5335, Fe5406, Fe4383:333It becomes clear in Lee et al. (2009) that Fe4531 and Fe5015 are Ti-sensitive indices.
The top left panel of Figure 9 displays that Fe5270 becomes stronger with -element enhancement except at the solar metallicity. The middle panels of Figure 9 illustrate that, while the cooler -enhanced isochrones at fixed [Fe/H] make Fe5270 stronger at all metallicity, the spectral effect makes Fe5270 weaker on the metal-rich side. According to Table 1, Ca-enhancement makes Fe5270 stronger on the metal-poor side but it is Mg-enhancement which overwhelms Ca-enhancement and makes Fe5270 weaker on the metal-rich side. The top right panel of Figure 9 shows that Fe5270 also decreases with blue HB stars on the metal-poor side ([Fe/H] 1.0) by 0.2 Å at 14 Gyr. The bottom left panel of Figure 9 depicts that Fe5270 increases in general with a bottom-heavy IMF, particularly on the metal-rich side ([Fe/H] 1.0). The bottom right panel shows that the effect from blue HBs becomes commensurately important with top-heavy IMF on the metal-poor side ([Fe/H] 1.0).
Although the -element enhancement effects on Fe5335 shown in the top left panel of Figure 10 is similar to that on Fe5270 in the top left panel of Figure 9, it is noted from the middle right panel of Figure 10 that the spectral effects do not make Fe5335 stronger on the metal-poor side as they do for Fe5270. According to Table 1, it is mostly Mg-enhancement which weakens Fe5335; Ca-enhancement does not influence Fe5335 significantly as it does Fe5270. The top right panel of Figure 10 displays that the HB effect is similar, though in less degree, to Fe5270. Fe5335 diminishes by 0.15 Å with blue HB stars at 14 Gyr. The bottom panels illustrate that the IMF effect is similar to Fe5270.
The top left panel of Figure 11 depicts that the -element enhancement effects on Fe5406 is relatively minor compared to that on Fe5270 and Fe5335 on the metal-poor side ([Fe/H] 1.0). From the middle panels of Figure 11, we find that it is the spectral effects that cancel out the isochrone effects on the metal-poor side. According to Table 1, all the elements make Fe5406 weaker, though the primary element is Mg. Similar to Fe5270 and Fe5335, the top right panel of Figure 11 illustrates that the blue HB stars on the metal-poor side make Fe5406 weaker by 0.1 Å at 14 Gyr. The bottom panels display that the IMF effect is similar to Fe5270 and Fe5335.
The top left panel of Figure 12 shows that the -enhancement on Fe4383 is similar to that on Fe5406 rather than Fe5270 and Fe5335. It is noted from the middle right panel of Figure 12 that the spectral effects due to -element enhancement grow systematically stronger with increasing metallicity. According to Table 1, all the elements except Ti make Fe4383 weaker, the leading element is Mg. Similar to Fe5270, Fe5335, and Fe5406, the top right panel of Figure 12 displays that the blue HB stars on the metal-poor side make Fe4383 weaker by 0.6 Å at 14 Gyr. The bottom panels illustrate that the IMF effect is similar to Fe5270, Fe5335, and Fe5406.
4 Comparisons with Milky Way Globular Clusters
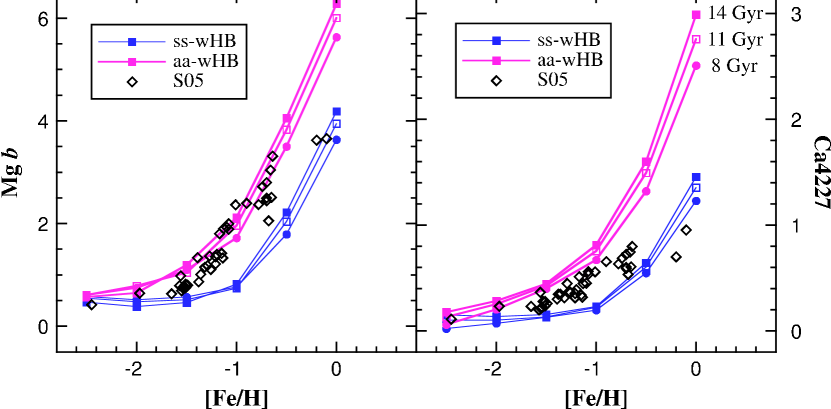
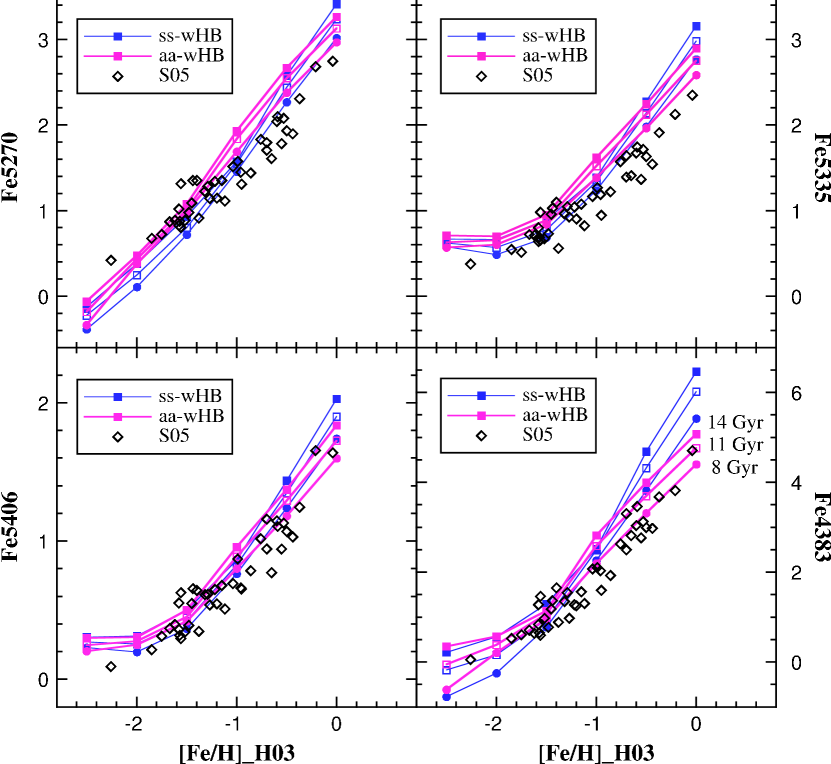
Having discussed the theoretical outputs of our SSP model -enhanced Lick spectral indices in 3, we now provide empirical checks of our models using the Milky Way GCs. In this work, we use recent the large, homogeneous dataset of 41 integrated spectra of the Milky Way GCs by S05. There are 40 MWGCs listed in Table 1 of S05 and we find that NGC 7078444We use [Fe/H] = 2.45 for NGC 7078 following the Table 7 of Kraft & Ivans (2003) based on MARCS models as we describe in section 4.3. is also available from their spectra, hence the total sample has 41 GCs, some with multiple observations. We have averaged the measured Lick index values when there are multiple observations. Figures 13 16 display [Fe/H] vs. Lick index plots in order to take advantage of independent measurements of [Fe/H] and [/Fe] from individual stars in the Milky Way GCs. The [Fe/H] values were taken from Table 1 of S05. Our simple stellar population models with reasonable HB morphologies are shown for several Lick indices as a function of [Fe/H]. The blue lines are solar-scaled models with HB stars (ss-wHB), while the pink lines are +0.4 dex -enhanced models (aa-wHB; both isochrones and spectra are enhanced). Ages of our models are noted next to the -enhanced models: filled circles are for 8 Gyr, open squares are for 11 Gyr, and filled squares are for 14 Gyr, respectively. The SSP models were computed at [Fe/H] = 2.5, 2.0, 1.5, 1.0, 0.5, and 0.0 and are connected by straight lines in the figures.
We describe how our SSP model Lick indices of Mg and Ca4227, Balmer lines, and Fe lines are compare with observations of Milky Way GCs in sections 4.1, 4.2, and 4.3, respectively. Comparisons of our model metal line indices with Milky Way GCs are of great importance. This is because age estimation using the diagnostic diagram of a metal line index vs. a Balmer line index could be misleading unless the calibrations of model metal line indices are carefully considered. We remind readers again, however, that the purpose of this study is not investigating the detailed match between models and the observations for every individual GC, but rather to look into the overall match for the entire range of [Fe/H] because of the caveats (i.e., no blue stragglers, binaries, multiple populations, CNONa considerations, etc) of our models as delineated in section 2.
4.1 Mg and Ca4227
From the left panel of Figure 13, it is seen that the overall match between MWGCs and our 0.4 dex -enhanced SSP models is good. Although it seems that the metal-poor GCs ([Fe/H] 1.0) indicate [/Fe] 0.2 - 0.3 dex, it is again not an aim of this study to investigate the every individual Milky Way GC’s location on our model grids. There is mounting evidence that not every -element is equally enhanced in MWGCs and not every MWGC is of the similar amount of -element enhancement (e.g., Gratton, Sneden, & Carretta 2004; Pritzl, Venn, & Irwin 2005). Our models represent the case when all the elements are equally enhanced by 0.4 dex. Lee et al. (2009) have noted that Mg is primarily sensitive to Mg alone and other elements do not much affect it so that [/Fe] = 0.4 dex should be equivalent to [Mg/Fe] = 0.4 for Mg .
From the right panel of Figure 13, it is indicated that [/Fe] ([Ca/Fe]) +0.2 would reproduce the observations better. As Pritzl et al. (2005) showed, it may be true that Ca is less enhanced compared to Mg in the stars of MWGCs. Pipino et al. (2009) recently suggest that the observed under-abundance of Ca with respect to Mg could be attributed to the different contributions from supernovae Type Ia and supernovae Type II to the nucleosynthesis of these two elements. The two most metal-rich Milky Way GCs in Figure 13 are NGC 6553 ([Fe/H] = 0.20) and NGC 6528 ([Fe/H] = 0.10). It seems that both of them indicate a lower amount of -enhancement compared to their metal-poor counterparts. For NGC 6553, Cohen et al. (1999) and Alves-Brito et al. (2006) report [Ca/Fe] = +0.06 and +0.05, respectively. For NGC 6528, Carretta et al. (2001) and Zoccali et al. (2004) report [Mg/Fe] = 0.04 and 0.06, respectively.
4.2 Balmer Line Indices
Balmer lines are widely used as an age indicator because of their superb temperature sensitivity in stars, tracing the temperature of the main-sequence turnoff better than many other indices. However, Lee et al. (2009) and earlier works (Worthey et al., 1994; Thomas et al., 2004; Lee & Worthey, 2005; Coelho et al., 2007; Schiavon, 2007) found that they are also abundance sensitive to some degree. The horizontal-branch effect on H was also investigated by Lee et al. (2000).
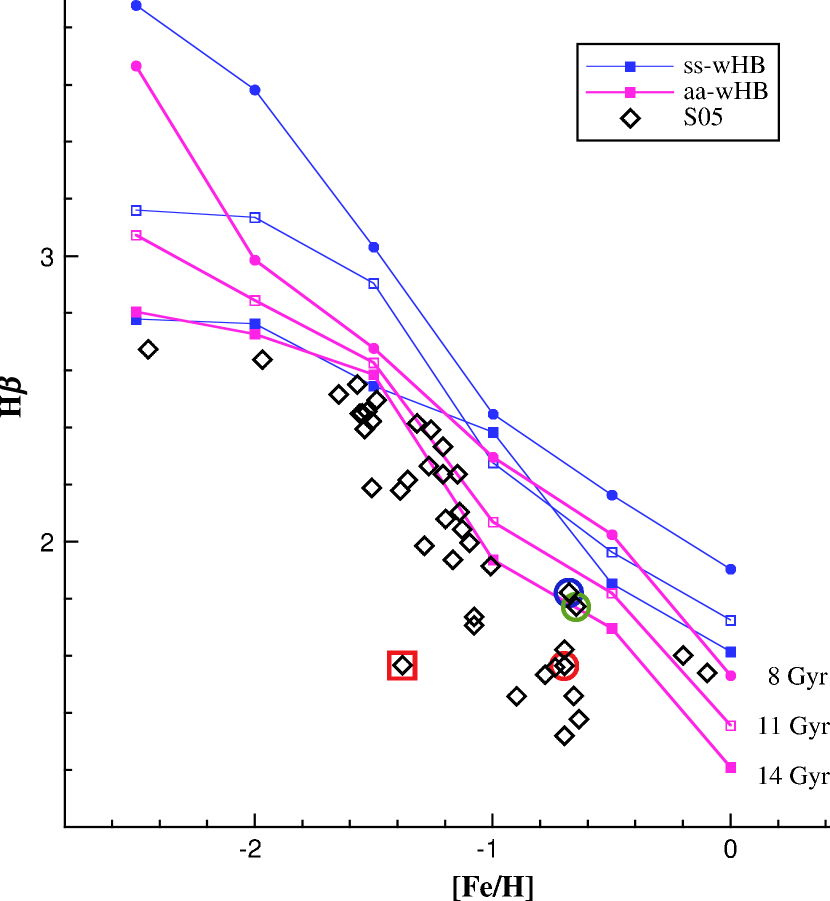
Figures 14 and 15 are similar to Figures 1 and 2 of Lee & Worthey (2005), but here we see the combination of isochrone and spectral effects of 0.4 dex -element (O, Mg, Si, S, Ca, Ti) enhancement after the correction of the stellar library’s intrinsic abundance patterns. From the top right panels of Figures 4 8, we have learned that blue HB stars significantly affect the Balmer lines (H, H, H) for the old stellar populations on the metal-poor side. It is clear from Figures 14 and 15 that the HB effect indeed improves the agreement between our models and observations. It is useful to note here that most Milky Way GCs have ages between 11-14 Gyr (e.g., Salaris & Weiss 2002).
Figure 14 shows that the overall match is rather good although that the observations are a little bit weaker than the models, particularly those for 1.0 [Fe/H] 0.6. We can see Poole et al. (2009) for a more detailed discussion, but a few words about outliers might be useful. The biggest outlier is NGC 6544 ([Fe/H] = 1.38; red open square) in Figure 14, that shows significantly weaker H compared to other MWGCs with similar metallicity (although only much slightly weaker at H and H in Figure 15). According to Harris (1996; 2003 updated version) MWGC compilation, NGC 6544 has considerably large reddening than other GCs in the S05 sample, E(BV) = 0.73. Moreover, Figure 1 of Hazen (1993) shows that there is a rather bright foreground star within 2’ from the center of NGC 6544. Several MWGCs with 1.0 [Fe/H] 0.6 also show some mismatches against models. Among the other clusters in the sample, it is interesting to find that NGC 6388 ([Fe/H] = 0.68; blue open circle) and NGC 6441 ([Fe/H] = 0.65; green open circle), which have unusually sizable population of blue HB stars for their metallicities (Rich et al. 1997), have stronger H features than 47 Tuc (([Fe/H] = 0.70; red open circle), which has a purely red HB.
For two most metal-rich MWGCs in the sample, a significant population of blue stragglers is seen in NGC 6553 ([Fe/H] = 0.20) (Beaulieu et al. 2001; Zoccali et al. 2001) and in NGC 6528 ([Fe/H] = 0.10) (Brown et al. 2005). They may explain rather strong H from NGC 6553 and NGC 6528 compared to those H-weak MWGCs with 1.0 [Fe/H] 0.6.
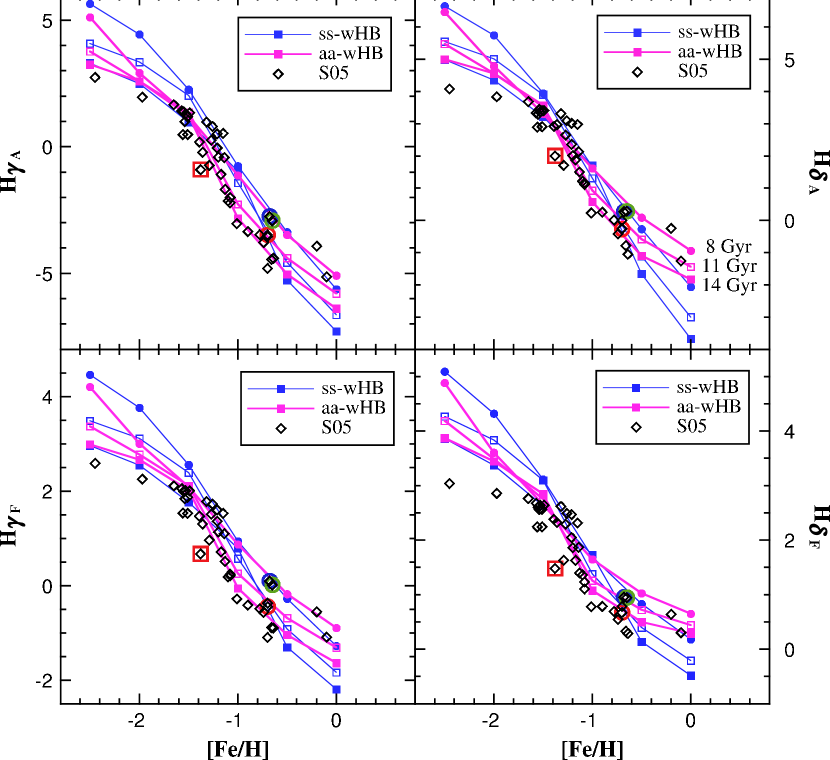
The overall agreement between the -enhanced SSP models of H and H Lick indices and the MWGCs in Figure 15 are much better than what we found for H, as shown in Figure 14. However, it is the case that the -enhanced models differ less from the scaled-solar models for H and H than they did for H. NGC 6544 ([Fe/H] = 1.38; red open square) is still an outlier but not to the great extent that it is for H. As with H, NGC 6388 and NGC 6441, with sizable population of blue HB stars, show relatively stronger H and H within a small metallicity range (again, these two and 47 Tuc are marked with different colored circles for comparison), particularly at H.
The top and middle panels of Figures 5 8 illuminated that the isochrone and spectral effects of -element enhancement on H and H go in the opposite direction and their effects are cancelled out on the metal-poor side, exposing mostly the HB effect alone. Among four H and H indices, H has the broadest dynamic range (8 Å difference between NGC 7078 with [Fe/H] = 2.45 and NGC 6528 with [Fe/H] = 0.10). The bottom panels of Figure 15 display that H and H are very similar to H and H in the upper panels, except for a narrower dynamic range.
4.3 Iron Line Indices
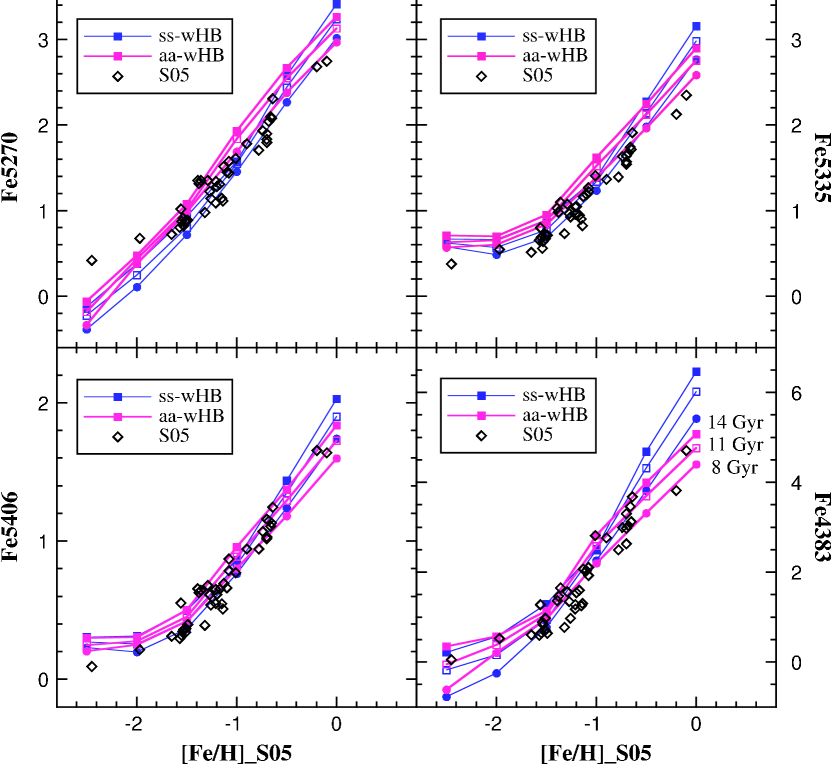
In Figure 16, we see that the overall match between Lick iron indices and the MWGCs is generally good although not superb in Fe5270 particularly around [Fe/H] 1.0. One of the culprits, is perhaps, the spectral effect of Ca as we described in section 3.3. Isochrone effects from individual element need to be investigated because -enhanced isochrone effects become significant near [Fe/H] = 1.0. Dotter et al. (2007a) investigated individual elemental effects on the isochrones only at the solar metalicity. The dynamic range of Fe5406, which is claimed to be the least sensitive to every element except iron among Lick iron indices (Lee et al. 2009; Percival et al. 2009), is only slightly smaller (1.6 Å) compared to that of Fe5270 (2.4 Å) and Fe5335 (2.0 Å).
Despite the use of high-resolution spectra of individual stars, the discrepancy of [Fe/H] estimation can be quite large among different studies even though their internal uncertainties are often fairly small. For example, Barbuy et al. (1999) found NGC 6553 to have [Fe/H] = 0.55 while Carretta et al. (2001) found [Fe/H]=0.06. To demonstrate the effect of changing the [Fe/H] scale we present Figure 17, which is the same as Figure 16, but the [Fe/H] values of MWGCs are from Harris (1996) compilation555We use his 2003 version, http://physwww.mcmaster.ca/ harris/mwgc.dat instead of Table 1 of S05. Compared to Figure 16, the matches are not very favorable especially at 1.0 [Fe/H] 0.5.
In Figure 18, we compare [Fe/H] values in Table 1 of S05 with several different [Fe/H] compilations available in the literature. They are Harris (1996; 2003 version), Zinn & West (1984), Carretta & Gratton (1997), and Kraft & Ivans (2003). The top left panel of Figure 18 compares [Fe/H] values in Table 1 of S05 with Harris 2003 compilation. 40 MWGCs except NGC 7078 are displayed here. The middle left panel shows the comparison between S05 and Zinn & West (ZW84) [Fe/H] in Table 7 of Kraft & Ivans (2003). 29 MWGCs are shown here. By comparing these two, we notice that the Harris 2003 compilation generally follows the ZW84 [Fe/H]. We illustrated in Figure 17 that our SSP models do not go very well along with [Fe/H] of Harris 2003 compilation.
The top right panel of Figure 18 compares [Fe/H] values of S05 with that of Carretta & Gratton (CG97)666They are listed in Table 2 of Rutledge, Hesser, & Stetson (1997). estimated by Rutledge, Hesser, & Stetson (1997). 30 MWGCs are shown here777NGC 6553 is additionally listed in Table 2 of Rutledge et al. (1997) compared to Table 7 of Kraft & Ivans (2003).. It seems that there are about 0.18 dex888This is noted in footnote ‘d’ in Table 1 of S05. In the literature, we note that the very recent [Fe/H] estimation of NGC 6388 by Carretta et al. (2007) is 0.44 and that of NGC 6441 by Gratton et al. (2007) is 0.34 compared to 0.68 and 0.65, respectively from Table 1 of S05. systematic differences between them. From the comparison between middle right panel (Kraft & Ivans 2003 [Fe/H] estimation based upon MARCS models) and bottoms panels (left: Kraft & Ivans 2003 [Fe/H] estimation based upon Kurucz models with convective overshooting, right: that without convective overshooting) of Figure 18, it seems that the [Fe/H] values in Table 1 of S05 correlate very well with [Fe/H] in Table 7 of Kraft & Ivans (2003) based on MARCS models.
5 Summary and Conclusions
We have presented scaled-solar and -enhanced SSP models as for several Lick/IDS indices using the Dotter et al. (2007b) stellar evolution models combined with high resolution synthetic spectra. A detailed systematic variation of HB morphology with age and metallicity is incorporated in order to represent the Milky Way GCs. Furthermore, we have investigated the effect of IMF variation on the Lick indices. It is realized that, among the elements, Mg significantly influences the spectral effects on Balmer and iron line indices. From the comparison of our models of Mg and Ca4227 with the Schiavon et al. (2005) dataset (Figure 13), we can confirm an enhancement of about 0.4 dex for Mg and about 0.2 dex for Ca, in agreement with the measured amounts from the high resolution spectra of individual stars in MWGCs (Pritzl, Venn, & Irwin 2005). Moreover, we note that our SSP model Lick iron indices comply with the Kraft & Ivans (2003) [Fe/H] based upon MARCS models. Balmer lines, particularly H and H, of MWGCs are also well reproduced by our -enhanced models not only because of the combination of isochrone and spectral effects but also because of our reasonable HB treatment. Finally, the investigation of IMF variations on Lick indices reveals that a giant-dominant IMF can be ruled out because the Balmer lines are too strong on the metal-poor side to be compatible with observations.
References
- Alves-Brito et al. (2006) Alves-Brito, A., et al. 2006, A&A, 460, 269
- Barbuy et al. (1999) Barbuy, B., Renzini, A., Ortolani, S., Bica, E., & Guarnieri, M. 1999, A&A, 341, 539
- Beaulieu et al. (2001) Beaulieu, S. F., et al. 2001, AJ, 121, 2618
- Brown et al. (2005) Brown, T. M., et al. 2005, AJ, 130, 1693
- Burstein et al. (1984) Burstein, D., Faber, S. M., Gaskell, C. M. & Krumm. N. 1984, ApJ, 287, 586
- Carretta et al. (2007) Carretta, E., Bragaglia, A., Gratton, R. G., et al. 2007, A&A, 464, 967
- Carretta et al. (2001) Carretta, E., Cohen, J. G., Gratton, R. G., & Behr, B. B. 2001, AJ, 122, 1469
- Carretta & Gratton (1997) Carretta, E., & Gratton, R. G. 1997, A&AS, 121, 95 (CG97)
- Cenarro et al. (2008) Cenarro, A. J., Cervantes, J. L., Beasley, M. A., Marín-Franch, A., & Vazdekis, A. 2008, ApJ, 689, 29
- Coelho et al. (2007) Coelho, P., Bruzual, G., Charlot, S., Weiss, A., Barbuy, B., & Ferguson, J.W. 2007, MNRAS, 382, 498
- Cohen, Blakeslee, & Ryzhov (1998) Cohen, J. G., Blakeslee, J. P., & Ryzhov, A. 1998, ApJ, 496, 808
- Cohen et al. (1999) Cohen, J. G., Gratton, R. G., Behr, B. B., & Carretta, E. 1999, ApJ, 523, 739
- Dotter (2008) Dotter, A. 2008, ApJ, 687, 21
- Dotter et al. (2007a) Dotter, A., Chaboyer, B., Ferguson, J. W., Lee, H.-c., Worthey, G., Jevremović, D., & Baron, E. 2007a, ApJ, 666, 403
- Dotter et al. (2007b) Dotter, A., Chaboyer, B., Jevremović, D., Baron, E., Ferguson, J. W., Sarajedini, A., & Anderson, J. 2007b, AJ, 134, 376
- Gibson et al. (1999) Gibson, B. K., Madgwick, D. S., Jones, L. A., Da Costa, D. S., & Norris, J. E. 1999, AJ, 118, 1268
- Gratton et al. (2007) Gratton, R. G., Lucatello, S., Bragaglia, A., Carretta, E., et al. 2007, A&A, 464, 953
- Gratton, Sneden, & Carretta (2004) Gratton, R., Sneden, C., & Carretta, E. 2004, ARA&A, 42, 385
- Harris (1996) Harris, W. E. 1996, AJ, 112, 1487
- Hazen (1993) Hazen, M. L. 1993, AJ, 106, 1055
- Houdashelt et al. (2002) Houdashelt, M. L., Trager, S. C., Worthey, G., & Bell, R. A. 2002, BAAS, 34, 1118
- Kim et al. (2002) Kim, Y.-C., Demarque, P., Yi, S. K. & Alexander, D. R. 2002, ApJS, 143, 499
- Korn et al. (2005) Korn, A. J., Maraston, C., & Thomas, D. 2005, A&A, 438, 685
- Kraft & Ivans (2003) Kraft, R. P., & Ivans, I. I. 2003, PASP, 115, 143 (KI)
- Lee et al. (2004) Lee, H.-c., Gibson, B. K., Flynn, C. Kawata, D., & Beasley, M. A. 2004, MNRAS, 353, 113
- Lee, Lee, & Gibson (2002) Lee, H.-c., Lee, Y.-W., & Gibson, B. K. 2002, AJ, 124, 2664
- Lee & Worthey (2005) Lee, H.-c., & Worthey, G. 2005, ApJS, 160, 176
- Lee et al. (2009) Lee, H.-c., Worthey, G., Dotter, A., Chaboyer, B., Jevremović, D., Baron, E., Briley, M. M., Ferguson, J. W., Coelho, P., & Trager, S. C. 2009, ApJ, 694, 902
- Lee, Yoon, & Lee (2000) Lee, H.-c., Yoon, S.-J., & Lee, Y.-W. 2000, AJ, 120, 998
- Percival et al. (2009) Percival, S. M., Salaris, M., Cassisi, S., & Pietrinferni, A. 2009, ApJ, 690, 427
- Pietrinferni et al. (2006) Pietrinferni, A., Cassisi, S., Salaris, M., & Castelli, F. 2006, ApJ, 642, 797
- Pietrinferni et al. (2009) Pietrinferni, A., Cassisi, S., Salaris, M., Percival, S. M., & Ferguson, J. W. 2009, ApJ, in press (arXiv:0903.0825)
- Piotto (2009) Piotto, G. 2009, arXiv:0902.1422
- Pipino et al. (2009) Pipino, A., et al. 2009, MNRAS, in press (arXiv:0904.2168)
- Poole et al. (2009) Poole, V., Worthey, G., Lee, H.-c. & Serven, J. 2009, AJ, submitted
- Pritzl, Venn, & Irwin (2005) Pritzl, B. J., Venn, K. A., & Irwin M. 2005, AJ, 130, 2140
- Proctor & Sansom (2002) Proctor, R. N., & Sansom, A. E. 2002, MNRAS, 333, 517
- Puzia et al. (2002) Puzia, T. H., et al. 2002, A&A, 395, 45
- Reddy et al. (2006) Reddy, B. E., Lambert, D. L., & Allende Prieto, C. 2006, MNRAS, 367, 1329
- Rich et al. (1997) Rich, R. M., et al. 1997, ApJ, 484, L25
- Rutledge, Hesser, & Stetson (1997) Rutledge, G., Hesser, J., & Stetson, P. 1997, PASP, 109, 907 (RHS)
- Salaris et al. (2004) Salaris, M., Riello, M., Cassisi, S., & Piotto, G. 2004, A&A, 420, 911
- Salaris & Weiss (2002) Salaris, M., & Weiss, A. 2002, A&A, 388, 492
- Salpeter (1955) Salpeter, E. E. 1955, ApJ, 121, 161
- Schiavon (2007) Schiavon, R. P. 2007, ApJS, 171, 146
- Schiavon et al. (2002) Schiavon, R. P., Faber, S. M., Rose, J. A., & Castilho, B. V. 2002, ApJ, 580, 873
- Schiavon et al. (2005) Schiavon, R. P., Rose, J. A., Courteau, S., & MacArthur, L. A. 2005, ApJS, 160, 163 (S05)
- Serven, Worthey, & Briley (2005) Serven, J., Worthey, G., & Briley, M. M. 2005, ApJ, 627, 754
- Spergel et al. (2003) Spergel, D. N., et al. 2003, ApJS, 148, 175
- Thomas et al. (2003) Thomas, D., Maraston, C., & Bender, R. 2003, MNRAS, 339, 897
- Thomas et al. (2004) Thomas, D., Maraston, C., & Korn, A. J. 2004, MNRAS, 351, L19
- Trager et al. (2000a) Trager, S. C., Faber, S. M., Worthey, G., González, J. J. 2000a, AJ, 119, 1645
- Trager et al. (2000b) Trager, S. C., Faber, S. M., Worthey, G., González, J. J. 2000b, AJ, 120, 188
- Tripicco & Bell (1995) Tripicco. M. J., & Bell, R. A. 1995, AJ, 110, 3035
- VandenBerg, Bergbusch, & Dowler (2006) VandenBerg, D. A., Bergbusch, P. A., & Dowler, P. D. 2006, ApJS, 162, 375
- Vazdekis et al. (2001) Vazdekis, A., Salaris, M., Arimoto, N., & Rose, J. A. 2001, ApJ, 549, 274
- Worthey (1998) Worthey, G. 1998, PASP, 110, 888
- Worthey et al. (1994) Worthey, G., Faber, S. M., González, J. J., & Burstein, D. 1994, ApJS, 94, 687
- Worthey & Ottaviani (1997) Worthey, G., & Ottaviani, D. L. 1997, ApJS, 111, 377
- Yi (2009) Yi, S. K. 2009, arXiv:0903.2891
- Yi, Demarque, & Kim (1997) Yi, S., Demarque, P., & Kim, Y.-C. 1997, ApJ, 482, 677
- Zinn & West (1984) Zinn, R., & West, M. J. 1984, ApJS, 55, 45 (ZW84)
- Zoccali et al. (2001) Zoccali, M., et al. 2001, AJ, 121, 2638
- Zoccali et al. (2004) Zoccali, M., et al. 2004, A&A, 423, 507
| Index | Index | I | I | I | I | I | I | I |
|---|---|---|---|---|---|---|---|---|
| Name | Value | (O) | (Mg) | (Si) | (S) | (Ca) | (Ti) | () |
| [Fe/H] = 1.0 | ||||||||
| Mg | 0.750 | 0.023 | 1.010 | -0.067 | 0.000 | 0.008 | 0.000 | 0.975 |
| Ca4227 | 0.288 | 0.064 | 0.012 | -0.004 | -0.001 | 0.352 | 0.005 | 0.431 |
| H | 2.228 | 0.013 | -0.047 | 0.011 | 0.002 | -0.004 | 0.052 | 0.024 |
| H | -1.713 | 0.246 | 0.408 | 0.213 | 0.001 | -0.060 | -0.333 | 0.476 |
| H | 0.393 | 0.148 | 0.193 | 0.114 | 0.000 | -0.030 | -0.008 | 0.419 |
| H | 1.122 | 0.093 | 0.225 | 0.209 | 0.001 | 0.079 | -0.100 | 0.508 |
| H | 1.364 | 0.003 | 0.054 | 0.262 | 0.001 | 0.089 | -0.073 | 0.333 |
| Fe5270 | 1.621 | -0.018 | -0.063 | -0.016 | 0.001 | 0.138 | 0.050 | 0.095 |
| Fe5335 | 1.432 | -0.009 | -0.057 | -0.013 | 0.000 | 0.007 | 0.024 | -0.049 |
| Fe5406 | 0.888 | -0.006 | -0.029 | -0.013 | 0.000 | -0.005 | -0.030 | -0.081 |
| Fe4383 | 2.611 | -0.068 | -0.235 | -0.176 | -0.001 | -0.112 | 0.121 | -0.472 |
| [Fe/H] = 0.0 | ||||||||
| Mg | 4.021 | 0.089 | 1.775 | -0.162 | 0.000 | -0.018 | 0.005 | 1.689 |
| Ca4227 | 1.357 | 0.213 | 0.007 | -0.032 | 0.001 | 0.841 | 0.000 | 1.028 |
| H | 1.809 | 0.040 | -0.220 | -0.021 | 0.000 | 0.005 | 0.064 | -0.134 |
| H | -6.245 | 0.614 | 1.165 | 0.447 | 0.001 | -0.099 | -0.681 | 1.445 |
| H | -1.679 | 0.338 | 0.452 | 0.189 | 0.001 | -0.064 | -0.045 | 0.870 |
| H | -2.603 | 0.290 | 0.861 | 0.531 | 0.001 | 0.397 | -0.217 | 1.862 |
| H | -0.056 | -0.019 | 0.184 | 0.552 | 0.000 | 0.219 | -0.150 | 0.787 |
| Fe5270 | 3.183 | -0.100 | -0.240 | -0.068 | 0.004 | 0.173 | 0.044 | -0.187 |
| Fe5335 | 2.958 | -0.042 | -0.236 | -0.075 | 0.000 | -0.030 | 0.025 | -0.356 |
| Fe5406 | 1.847 | -0.032 | -0.126 | -0.052 | 0.000 | -0.030 | -0.028 | -0.268 |
| Fe4383 | 5.838 | -0.076 | -0.729 | -0.434 | 0.000 | -0.328 | 0.094 | -1.472 |
Note. — 1. The units are Å of equivalent width. 2. The second column is the index of solar-scaled models without HB stars. 3. I = index of each element-enhanced by 0.4 dex at fixed [Fe/H] index of solar-scaled model, both without HB stars. 4. in the last column is the case that all of O, Mg, Si, S, Ca, and Ti are enhanced by 0.4 dex at fixed [Fe/H] without HB stars.