An Accurate Position for HDF 850.1: The Brightest Submillimeter Source in the Hubble Deep Field-North
Abstract
We report a highly significant Submillimeter Array (SMA) detection of the prototypical submillimeter source HDF 850.1, which is the brightest submillimeter source in the Hubble Deep Field-North proper. The detection yields an extremely precise position of RA(2000)=12h 36m 51.99s and Dec(2000)=+62∘ 12′ 25.83′′ with a positional uncertainty of . The position is consistent with the location of a millimeter wavelength interferometric detection and with the locations of weak Very Large Array detections at 1.4 and 8.4 GHz, but it is not consistent with any previous optical/near-infrared identifications. The source appears pointlike at the resolution of the SMA, and the detected flux of mJy is consistent with the measured Submillimeter Common-User Bolometer Array (SCUBA) fluxes. We tabulate fluxes and limits on HDF 850.1 at other wavelengths. Our redshift estimate for HDF 850.1 based on the radio through mid-infrared measurements is . The faintness of the source at optical/near-infrared wavelengths and the high estimated redshift suggest that HDF 850.1 may be an analog of the brighter submillimeter source GOODS 850-5, which is also thought to be at . The fact that a source like HDF 850.1 should have appeared in one of the very first blank-field SCUBA observations ever made suggests that such high-redshift sources are quite common. Thus, we are led to conclude that high-redshift star formation is dominated by giant dusty star-forming galaxies, just as it is at lower redshifts.
Subject headings:
cosmology: observations — galaxies: evolution — galaxies: formation — galaxies: starburst — infrared: galaxies1. Introduction
In the more than ten years since the first discoveries (Smail et al. 1997; Barger et al. 1998; Hughes et al. 1998; Eales et al. 1999) of distant submillimeter galaxies were made using the Submillimeter Common-User Bolometer Array (SCUBA; Holland et al. 1999) on the single-dish James Clerk Maxwell Telescope, we have learned a great deal about these sources and their contribution to the 850 m background light. We now know the background is dominated by sources with 850 m fluxes near 1 mJy (Blain et al. 1999; Cowie et al. 2002; Knudsen et al. 2008). In addition, stacking analyses suggest that much of this light arises from galaxies near redshift one (Wang et al. 2006; Serjeant et al. 2008). The large positional uncertainties of the SCUBA sources make direct spectroscopic measurements of potential optical counterparts time-consuming and ambiguous (Barger et al. 1999). However, many (%; Barger et al. 2000; Ivison et al. 2002; Chapman et al. 2003b) of the SCUBA sources with 850 m fluxes above 5 mJy have 1.4 GHz counterparts whose positions are known with subarcsecond accuracy. The optical and near-infrared (NIR) counterparts to many of these have been spectroscopically identified, most of which are found to lie in the redshift range (Chapman et al. 2003a, 2005).
Throughout the redshift range the submillimeter sources dominate the universal star formation history (e.g., Chapman et al. 2005; Wang et al. 2006). The key questions are whether this continues to higher redshifts, and how high in redshift one must go before one finds that smaller galaxies are dominating the universal star formation history. If giant submillimeter galaxies still make up the bulk of the star formation at very high redshifts ( or more), this could pose a severe challenge to the cold dark matter models of galaxy growth. At present there are only a very small number of spectroscopically identified submillimeter galaxies at , with the current highest redshifts being at (Capak et al. 2008; Coppin et al. 2009). However, this may in large part be an observational selection effect. First, unlike the submillimeter with its negative -correction, the radio dims at higher redshifts. Even at mJy roughly % of the sources do not have strong radio counterparts. Since these sources cannot be spatially localized, there is no simple route to obtaining a redshift. Second, it is the high-redshift sources that are most likely to be omitted from the spectroscopic samples, since they are likely to be optically fainter. Thus, while it is clear that submillimeter galaxies could continue to dominate the star formation history at , we are still in the uncomfortable position of not knowing the exact positions or counterparts of most of the submillimeter sources that are likely to lie at these redshifts.
Fortunately, the advent of the Submillimeter Array (SMA; Ho et al. 2004) has allowed accurate positions to be obtained for some of these sources (Iono et al. 2006; Wang et al. 2007; Younger et al. 2007). Of particular interest is the source GOODS 850-5, which may lie at a very high redshift (e.g., Wang et al. 2007, 2009; Dannerbauer et al. 2008). Daddi et al. (2009a) place GOODS 850-5 at based on a possible identification of a single CO line.
All of the SMA-detected sources are relatively bright, but it is now possible, with the improving sensitivity of the SMA, to study more typical sources. In the present paper we report on SMA observations of HDF 850.1 (Hughes et al. 1998). HDF 850.1 is the strongest submillimeter source in the Hubble Deep Field-North (HDF-N) proper, and, as such, it can almost be considered as the prototypical SCUBA source. It was also among the first SCUBA-selected sources to be detected with millimeter wavelength interferometry, giving an accurate position with an uncertainty of about (Downes et al. 1999). It is a measure of the difficulty of identifying the SCUBA sources that, despite this measurement and the extremely deep optical, NIR, and radio data available for the HDF-N, no convincing optical/NIR counterpart has been found for HDF 850.1. Indeed, several possible optical/NIR counterparts have been suggested, with the most recent identification being put forward by Dunlop et al. (2004).
We shall show in the present paper that none of the previous optical/NIR identifications is correct and that HDF 850.1 has no detectable optical or NIR light. It is a weak radio source with detections at both 1.4 and 8.4 GHz, and it may also be detected at 24 m. Overall, the far-infrared (FIR) and radio spectral energy distributions (SEDs) would place HDF 850.1 at a redshift of just above , if its rest-frame SED is similar to that of low-redshift ultraluminous infrared galaxies (ULIRGs).
Throughout this paper we assume km s, , and .
2. SMA Observations
Two full tracks of SMA observations of HDF 850.1 were obtained in 2008 February and April with, respectively, eight antennas in the compact configuration and seven antennas in the compact-north configuration. The receivers were tuned such that the central frequency of the observations was at 345 GHz. Callisto and Ceres were used as flux calibrators, and 3C454.3 was used as the bandpass calibrator. Quasars 1419+543 and 1048+717, which are, respectively, and away from the target, were observed after every 15 minutes of on-target integration for time-dependent complex gain calibrations. The averaged single-sideband system temperatures in the two tracks were 420 and 620 K.
The calibration and data inspection were performed with the Caltech package MIR modified for the SMA. Continuum data were generated by averaging the spectral channels after the passband calibration. Both gain calibrators were used to derive gain curves. Flux calibrations were performed using data taken under conditions (time, hour angle, and elevation) similar to that of the flux calibrator. The error in flux calibration is usually within 10% with this method. The calibrated visibility data were Fourier transformed and deconvolved in the package MIRIAD to form images. In the transformation we applied the “robust weighting” of Briggs (1995), with a robust parameter of +0.9 to obtain a better balance between beam size and S/N. We also weighted each visibility point inversely proportional to the system temperature. The synthesized beam has a FWHM of at a position angle of . The theoretical noise and the noise measured in the CLEAN deconvolved image are 0.94 and 1.05 mJy, respectively.
HDF 850.1 is detected in both the dirty and CLEANed images and is
unresolved. In MIRIAD a point-source fit to the image yields a flux of
7.8 mJy and a J2000 position of
RA 12h 36m 51.99s ()
Dec +62∘ 12′ 25.83′′ () .
Here the positional errors were obtained using the imfit routine in MIRIAD with a box size equal to 2.5 times the beam size. A more direct method of finding the position and error is to fit the visibilities. Fitting with the uvfit routine in MIRIAD gives a flux of mJy and a position of
RA 12h 36m 51.97s ()
Dec +62∘ 12′ 25.69′′ () .
The weighting of the flux extraction with uvfit may be less optimal than that with the imfit routine, so we adopt the imfit estimate of the flux and error. However, the error estimate in the imfit position is sensitive to the choice of box size, while the uvfit errors are not sensitive to such assumptions. We therefore adopt the uvfit position and positional errors.
In the images of the gain calibrators the measured positional offsets are all within the above errors. Thus, we do not consider the calibration error to be a significant source of error in the astrometry. More specifically, we note that the observations of the two quasars were interleaved with each other and that we used the measured phase of each to derive the astrometry. They are not each self-calibrated, i.e., placed at their VLA position. Combining the phases for both gives more accurate positions over a wider region of sky. We can make an estimate of the systematics by measuring the positional offsets of each quasar relative to their nominal positions, obtaining (,) for 1419+545 and (,) for 1048+717. Since HDF850.1 lies between the two quasars, the positional offset will, at some level, average these values. However, if we use the maximum values here as our estimate of the systematic error, our positional error becomes in RA and in Dec. We will use this error estimate, which we believe to be quite conservative, in the subsequent discussion.
The SMA flux of HDF 850.1 is consistent with the earliest SCUBA jiggle-map measurement of Hughes et al. (1998), who found a flux density of mJy, but it is larger than all of the later SCUBA results obtained with various mapping and source extraction methods (Serjeant et al. 2003; Borys et al. 2003; Wang et al. 2004). It lies about from the SCUBA position of Serjeant et al. (2003), which is reasonable given the expected positional error for a SCUBA source with this S/N (e.g., Wang et al. 2004).
3. Other Measurements of HDF 850.1
3.1. Millimeter and Radio
In Table 1 we list the other millimeter and radio measurements
(plus references) of HDF 850.1.
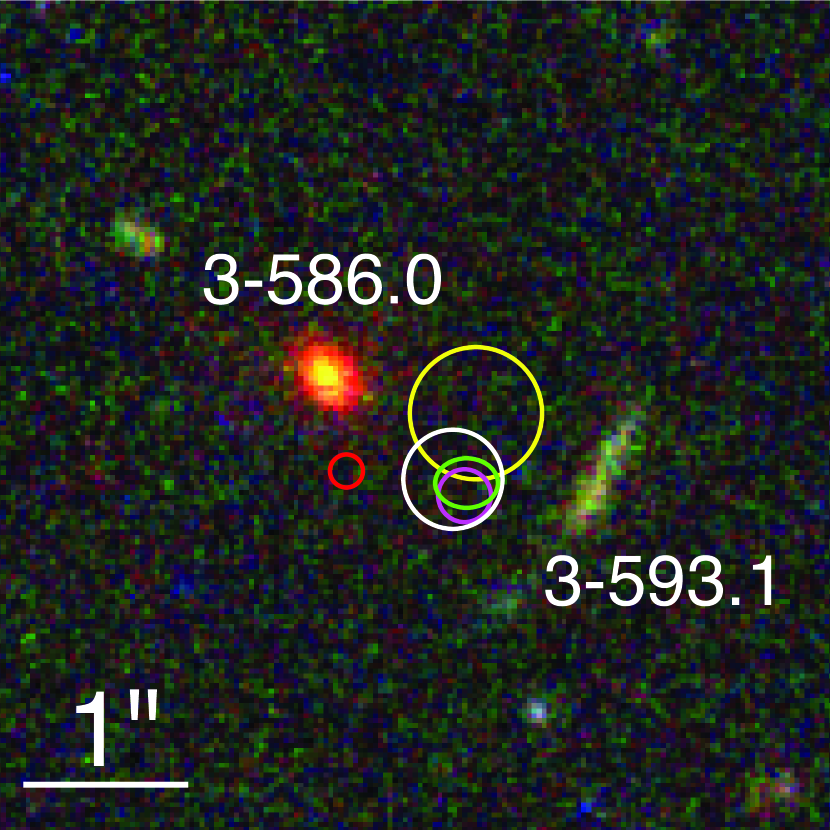
In Figure 1 we show the relative locations of some of those
measurements with circles indicating the 1 positional
uncertainties. The SMA position is shown with the green ellipse. It is
fully consistent with the 1.35 mm measurement of
Downes et al. (1999) obtained using the IRAM PdB with a
J2000 position (white circle in Fig. 1) of
RA 12h 36m 51.98s
Dec +62∘ 12′ 25.7′′ .
The beam for this measurement was approximately , and the published positional uncertainty of seems very conservative. In this regard the IRAM center lies only from our SMA position, well within the quoted errors. (If we use the image plane fit as opposed to the UV plane fit, this offset rises to , which is also well within the errors.)
The source is also weakly detected at 1.4 and 8.4 GHz. There is
a nearly detection at 1.4 GHz in the deep map of the
area obtained by G. Morrison et al. (2009, in preparation). The flux
is Jy and the J2000 position
(purple circle in Fig. 1) is
RA 12h 36m 51.97s
Dec +62∘ 12′ 25.6′′ ,
with a positional uncertainty of
(G. Morrison, private communication).
This source is also detected at the 3.5 level at
8.4 GHz (VLA 3651+1226 in the supplementary
list of sources in Richards et al. 1998).
The 8.4 GHz J2000 position (yellow circle in Fig. 1) is
RA(2000) 12h 36m 51.96s
Dec(2000) +62∘ 12′ 26.1′′ ,
which is consistent with the SMA position within the fairly substantial () positional uncertainty for this low significance source. We shall use the 8.4 GHz flux of Jy quoted by Dunlop et al. (2004) as a private communication from E. Richards. Given the low signal to noise of both the radio detections, we do not use their positional information in any of the subsequent discussion.
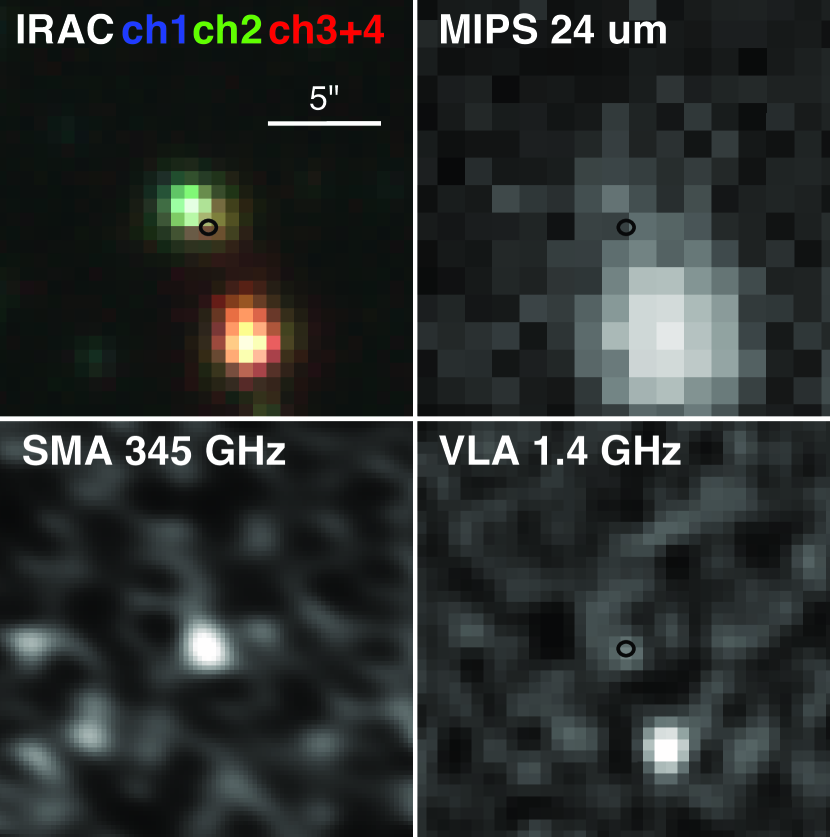
3.2. Mid-infrared
HDF 850.1 is not detected in Spitzer MIPS 70 m imaging (Huynh et al. 2007), so we adopt the nominal 2 mJy (3) upper limit. At 24 m (see Fig. 2) its flux is contaminated by a nearby radio source and possibly by the elliptical galaxy 3-856.0 from the Williams et al. (1996) catalog. We used the Spitzer 24 m in-flight point-spread function (PSF) to subtract the flux from the nearby radio source and then measured a aperture-corrected flux at the SMA position of HDF 850.1. The result is Jy. This is consistent with the value in Pope et al. (2006). This may be considered as an upper limit, since the contamination from 3-856.0 is unclear and the resolution of Spitzer does not allow a reliable separation between the two. We note that the level of contamination from 3-856.0 in the IRAC bands (see Fig. 2) is far too high to make any plausible flux estimates.
3.3. Optical and Near-infrared
As can be seen from Figure 1, HDF 850.1 lies between two neighboring galaxies: a red elliptical galaxy (3-586.0) and a blue arc-like galaxy (3-593.1). The elliptical galaxy lies at a spectroscopic redshift of (Barger et al. 2008) and has no strong emission lines. Dunlop et al. (2004) estimate a velocity dispersion of for this galaxy. The blue arc-like galaxy is very faint and has not been spectroscopically observed. Photometric redshift estimates place it at (Fernández-Soto et al. 1999; Rowan-Robinson 2003). Both of these sources have been suggested as counterparts to HDF 850.1, but the present high-precision observations give separations that are clearly too large for this to be the case. Similarly, the object HDF 850.1K, which Dunlop et al. (2004) claim to be the counterpart (red circle in Fig. 1), lies more than from the SMA and IRAM source positions. This identification is rejected at the level on positional grounds by the SMA data (using the RA error, since the separation is primarily along this axis) and at the level by the IRAM data. In combination, this identification is rejected at the level. We conclude that HDF 850.1 has no detectable optical or NIR light. We do not attempt to measure the optical and NIR fluxes at the SMA position, as was done in Wang et al. (2009) at the SMA position of GOODS 850-5, due to the inevitable contamination of any such measurements from the elliptical galaxy light.
| Band | Flux | Reference |
|---|---|---|
| Jy | MIPS; this work | |
| mJy | MIPS; Huynh et al. (2007) | |
| mJy | SCUBA; Hughes et al. (1998) | |
| mJy | SCUBA; Hughes et al. (1998) | |
| mJy | IRAM; Downes et al. (1999) | |
| mJy | SCUBA; Hughes et al. (1998) | |
| Jy | E. Richards (2004, priv. comm.) | |
| Jy | G. Morrison (2009, priv. comm.) |
4. SED and Redshift of HDF 850.1

In Figure 3 we show the observed SED of HDF 850.1 at radio through mid-infrared wavelengths. We fitted a variety of models to determine the optimal template and redshift of the source. We show the Arp 220 template at , which provides the best fit to the data, as the solid curve in Figure 3. This gives the most likely redshift of HDF 850.1 as with a 68% confidence interval of . This redshift estimate for HDF 850.1 is similar to the one made by Dunlop et al. (2004). However, the new 24 m measurement (or upper limit) provides a much tighter constraint on possible templates, reducing the redshift range slightly. It is possible that HDF 850.1 lies in the redshift sheet at , which Daddi et al. (2009b) have found in the GOODS-N region.
Wagg et al. (2007) did not detect any emission from HDF 850.1 in their Green Bank Telescope (GBT) wide bandwidth search for CO(1–0) from –5.4 and for CO(2–1) from –4.3. However, the sensitivity of the GBT is not sufficient to place a strong limit on the CO line strengths relative to the infrared luminosity of HDF 850.1 based on the CO–FIR correlation of high-redshift ULIRGs (see Fig. 6 of Wagg et al. 2007). Thus, the estimated redshift of is not ruled out by the GBT non-detection.
We note in passing that Hughes et al. (1998) and Dunlop et al. (2004) both suggested that HDF 850.1 may be being gravitationally lensed by the elliptical galaxy 3-586.0. While the effects of gravitational lensing may brighten HDF 850.1 to some extent, since we are not trying to use its flux to obtain a star formation rate, we do not discuss the possible lensing effects here.
5. Summary and Final Remarks
We have presented SMA observations of the submillimeter source HDF 850.1 first discovered by Hughes et al. (1998) in the HDF-N proper using SCUBA. The SMA detection yields an extremely accurate position, which is not consistent with previous optical/NIR identifications of the source, including the most recent one by Dunlop et al. (2004). In fact, there is no optical or NIR counterpart visible in the existing extremely deep imaging. The SMA position is consistent with the positions of the millimeter wavelength interferometric detection of Downes et al. (1999), the weak VLA detection at 1.4 GHz by G. Morrison et al. (2009, in preparation), and the weak VLA detection at 8.4 GHz by Richards et al. (1998). We estimated a millimetric redshift of for HDF 850.1 by fitting the available mid-infrared through radio imaging to the Arp 220 SED. HDF 850.1 may be an analog of the brighter submillimeter source GOODS 850-5 observed by Wang et al. (2007) with the SMA, which also has no optical or NIR counterpart in extremely deep imaging (Wang et al. 2009) and is thought to lie at (Wang et al. 2007, 2009; Dannerbauer et al. 2008; Daddi et al. 2009a).
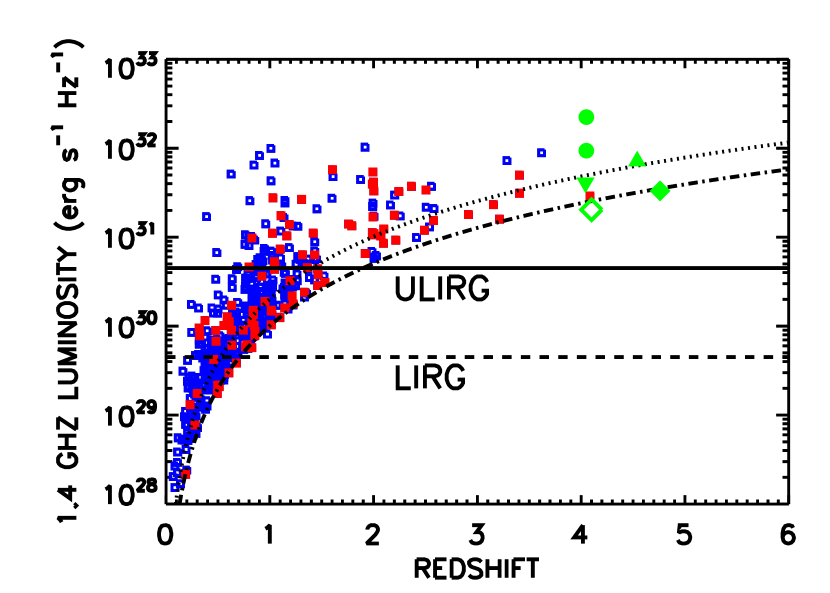
The increasing number of such high-redshift sources now being identified suggests that they play a major role in the high-redshift star formation history. In Figure 4 we compare the radio powers of HDF 850.1 (green open diamond) and other submillimeter sources at (green solid symbols; Capak et al. 2008 and Schinnerer et al. 2008; Coppin et al. 2009; Daddi et al. 2009a, 2009b) with the radio powers of a sample of spectroscopically identified radio-selected sources observed in several ultradeep fields (Cowie et al. 2004; Barger et al. 2007; A. Barger et al. 2009, in preparation). We use blue open squares to denote the optically bright radio sources () and red solid squares to denote the optically faint radio sources (). While some of the high-redshift sources may be optically bright, many are very faint. The submillimeter sources are comparable in radio power to the high-luminosity end of the radio sample at , and some lie close to the sensitivity limits of the deepest fields observed with the VLA (Jy, dot-dashed curve; e.g., Fomalont et al. 2006; Owen & Morrison 2008; G. Morrison et al. 2009, in preparation), emphasizing that with the gain in 1.4 GHz sensitivity anticipated with the Expanded Very Large Array (EVLA; Momjian et al. 2009), we may expect such sources to be routinely included and localized in deep 1.4 GHz samples. The EVLA will therefore enable the development of accurate number density and star formation estimates from the ULIRGs at these redshifts.
References
- (1)
- (2) Barger, A. J., Cowie, L. L., & Richards, E. A. 2000, AJ, 119, 2092
- (3)
- (4) Barger, A. J., Cowie, L. L., Sanders, D. B., Fulton, E., Taniguchi, Y., Sato, Y., Kawara, K., & Okuda, H. 1998, Nature, 394, 248
- (5)
- (6) Barger, A. J., Cowie, L. L., Smail, I., Ivison, R. J., Blain, A. W., & Kneib, J.-P., 1999, AJ, 117, 2656
- (7)
- (8) Barger, A. J., Cowie, L. L., & Wang, W.-H. 2007, ApJ, 654, 764
- (9)
- (10) Barger, A. J., Cowie, L. L., & Wang, W.-H. 2008, ApJ, 689, 687
- (11)
- (12) Blain, A. W., Kneib, J.-P., Ivison, R. J., & Smail, I. 1999, ApJ, 512, L87
- (13)
- (14) Borys, C., Chapman, S., Halpern, M., & Scott, D. 2003, MNRAS, 344, 385
- (15)
- (16) Briggs, D. S. 1995, BAAS, 187, 112.02
- (17)
- (18) Capak, P., et al. 2008, ApJ, 681, L53
- (19)
- (20) Chapman, S. C., Blain, A. W., Ivison, R. J., & Smail, I. R. 2003a, Nature, 422, 695
- (21)
- (22) Chapman, S. C., Blain, A. W., Ivison, R. J., & Smail, I. R. 2005, ApJ, 622, 772
- (23)
- (24) Chapman, S. C., et al. 2003b, ApJ, 585, 57
- (25)
- (26) Coppin, K., et al. 2009, MNRAS. in press (arXiv:0902.4464v1)
- (27)
- (28) Cowie, L. L., Barger, A. J., Fomalont, E. B., & Capak, P. 2004, ApJ, 603, L69
- (29)
- (30) Cowie, L. L., Barger, A. J., & Kneib, J.-P. 2002, AJ, 123, 2197
- (31)
- (32) Daddi, E., Dannerbauer, H., Krips, M., Walter, F., Dickinson, M., Elbaz, D., & Morrison, G. E. 2009a, ApJ, 695, L176
- (33)
- (34) Daddi, E., et al. 2009b, ApJ, 694, 1517
- (35)
- (36) Dannerbauer, H., Walter, F., & Morrison, G. 2008, ApJ, 673, L127
- (37)
- (38) Downes, D., et al. 1999, A&A, 347, 809
- (39)
- (40) Dunlop, J. S., et al. 2004, MNRAS, 350, 769
- (41)
- (42) Eales, S., Lilly, S., Gear, W., Dunne, L., Bond, J. R., Hammer, F., Le Fèvre, O., & Crampton, D. 1999, ApJ, 515, 518
- (43)
- (44) Fernández-Soto, A., Lanzetta, K. M., & Yahil, A. 1999, ApJ, 513, 34
- (45)
- (46) Fomalont, E. B., Kellermann, K. I., Cowie, L. L., Capak, P., Barger, A. J., Partridge, R. B., Windhorst, R. A., & Richards, E. A. 2006, ApJS, 167, 103
- (47)
- (48) Giavalisco, M., et al. 2004, ApJ, 600, L93
- (49)
- (50) Ho, P. T. P., Moran, J. M., & Lo, K. Y. 2004, ApJ, 616, L1
- (51)
- (52) Holland, W. S., et al. 1999, MNRAS, 303, 659
- (53)
- (54) Hughes, D. H., et al. 1998, Nature, 394, 241
- (55)
- (56) Huynh, M. T., Pope, A., Frayer, D. T., & Scott, D. 2007, ApJ, 659, 305
- (57)
- (58) Iono, D., et al. 2006, ApJ, 640, L1
- (59)
- (60) Ivison, R. J., et al. 2002, MNRAS, 337, 1
- (61)
- (62) Knudsen, K. K., van der Werf, P. P., & Kneib, J.-P. 2008, MNRAS, 384, 1611
- (63)
- (64) Momjian, E., Perley, R, Rupen, M., & McKinnon, M. 2009, AAS, 21347405
- (65)
- (66) Owen, F. N., & Morrison, G. E. 2008, AJ, 136, 1889
- (67)
- (68) Pope, A., et al. 2006, MNRAS, 370, 1185
- (69)
- (70) Richards, E.A., Kellerman, K.I., Fomalont, E.B., Windhorst, R.A., & Partridge, R.B. 1998, AJ, 116, 1039
- (71)
- (72) Rowan-Robinson, M. 2003, MNRAS, 345, 819
- (73)
- (74) Schinnerer, E., et al. 2008, ApJ, 689, L5
- (75)
- (76) Serjeant, S., et al. 2003, MNRAS, 344, 887
- (77)
- (78) Serjeant, S., et al. 2008, MNRAS, 386, 1907
- (79)
- (80) Silva, L., Granato, G. L., Bressan, A., & Danese, L. 1998, ApJ, 509, 103
- (81)
- (82) Smail, I., Ivison, R. J., & Blain, A. W. 1997, ApJ, 490, L5
- (83)
- (84) Wagg, J., Hughes, D. H., Aretxaga, I., Chapin, E. L., Dunlop, J. S., Gaztañaga, E., & Devlin, M. 2007, MNRAS, 375, 745
- (85)
- (86) Wang, W.-H., Barger, A. J., & Cowie, L. L. 2009, ApJ, 690, 319
- (87)
- (88) Wang, W.-H., Cowie, L. L., & Barger, A. J. 2004, ApJ, 613, 655
- (89)
- (90) Wang, W.-H., Cowie, L. L., & Barger, A. J. 2006, ApJ, 647, 74
- (91)
- (92) Wang, W.-H., Cowie, L. L., van Saders, J., Barger, A. J., & Williams, J. P. 2007, ApJ, 670, L89
- (93)
- (94) Williams, R. E., et al. 1996, AJ, 112, 1335
- (95)
- (96) Younger, J. D., et al. 2007, ApJ, 671, 1531
- (97)