Chemical composition of the young open clusters IC 2602 and IC 2391 ††thanks: Based on observations collected at La Silla and Paranal Observatory, ESO (Chile). Programs 55.E-0808, 66.D-0284.
Abstract
Context. Galactic open clusters have been long recognized as one of the best tools to investigate the chemical content of Galactic disk and its time evolution. In the last decade, many efforts have been directed to chemically characterize the old and intermediate age population; surprisingly, the chemical content of the younger and close counterpart remains largely undetermined.
Aims. In this paper we present the abundance analysis of a sample of 15 GK members of the young pre-main sequence clusters IC 2602 and IC 2391. Along with IC 4665, these are the first pre-main sequence clusters for which a detailed abundance determination has been carried out so far.
Methods. We analyzed high-resolution, high S/N spectra acquired with different instruments (UVES and CASPEC at ESO, and the echelle spectrograph at CTIO), using MOOG and equivalent width measurements. Along with metallicity ([Fe/H]), we measured Na i, Si i, Ca i, Ti i and Ti ii, and Ni i abundances. Stars cooler than show lower Ca i, Ti i, and Na i than warmer stars. By determining Ti ii abundances, we show that, at least for Ti, this effect is due to NLTE and over-ionization.
Results. We find average metallicities [Fe/H] =0 and [Fe/H]= for IC 2602 and IC 2391, respectively. All the [X/Fe] ratios show a solar composition; the accurate measurements allow us to exclude the presence of star-to-star scatter among the members.
Key Words.:
stars: abundances Galaxy: open clusters and associations: individual: IC 2602, IC 23911 Introduction
Open clusters (OCs) are widely recognized as excellent tracers of the chemical properties of the Galactic disk and of its evolution with time. In recent years, several studies have been devoted to the determination of the chemical composition of the older and intermediate age population, i.e. OCs with ages greater than 500 Myr, with the main goal of deriving the radial metallicity gradient across the Galactic disk (e.g., Carraro et al. 2004; Yong et al. 2005; Friel 2006; Randich et al. ran06 (2006); Carretta et al. car07 (2007); Sestito et al. 2007, 2008; Pace et al. pace (2008)). On the other hand, less attention has been paid to the abundances of younger clusters and, in particular, the so-called pre-main sequence (PMS) clusters (age 10-50 Myr). As we will discuss below, knowledge of the abundance pattern in these clusters is instead important to address different astrophysical issues, such as the evolution of debris disks, the common origin of young open clusters and associations, and the chemical evolution of the solar vicinity.
First, the age interval defined by PMS clusters is critical to trace the early stages of evolution of dusty debris disks around main-sequence stars. The fraction of debris disks in clusters and the level of 24 m excess emission rise for stars with ages between 5-10 Myr, reach a peak around 20-30 Myr, and then start decaying inversely with age (e.g., Currie et al. 2008). Planet formation models suggest that terrestrial planets also reach their final mass by 10-30 Myr; hence, a good characterization of debris disks in this critical age range provides an indirect tool to study planet formation and evolution (e.g Siegler et al. 2007). Several studies have focused on the detection and characterization of debris disks both in the field and in open clusters and on the existence of possible correlations between the frequency of dusty disks and the fundamental properties of the parent-star (spectral type, mass, and luminosity for instance). Given the metal-rich nature of stars with giant planets (e.g. Santos et al. 2004), the correlation between metallicity and frequency of debris disks has been (partially) investigated: the lack of such correlation (Beichman et al. 2006; Bryden et al. 2006; Trilling et al. 2008) might reflect the different formation histories of giant planets and debris disks. On the other hand, the latter studies have focused on old solar-type stars in the field (ages few Gyr) and the younger population has not been involved at all: there is instead the possibility of an initial correlation between dust production and metallicity around young stars, but this relationship might have disappeared as the stars age (Bryden et al. 2006; Dominik & Decin 2003). PMS clusters and their young population represent a unique tracer to address this topic. In particular, the determination of the metallicity of a large sample of PMS clusters with available information on debris disks would allow investigation of whether a correlation between metallicity and frequency of debris disks is indeed present at young ages.
In a different context, the identification of small close-by associations (within 100 pc from the Sun) along with the knowledge of several complexes (e.g. the Sco-Cen association and the Tucana/Horologium) a new impulse has been given to the investigation of the so-called superclusters. The concept of such stellar aggregates with parallel space motions and located in the solar surroundings was introduced by Eggen more than thirty years ago; one of these superclusters is the Local Association (Eggen 1975, 1983a,b): with the Pleiades, other clusters like Persei, Lyrae, NGC 1039, NGC 2516, and the Sco-Cen OB association, also IC 2602 would be contained within it (Ortega et al. 2007). The secure knowledge of the chemical composition and the detection of a common/different abundance pattern is critical to confirm or not a common origin, independently of dynamical/kinematical information.
Finally, young clusters in the solar vicinity allow us to chemically characterize our immediate surroundings in the disk, the solar neighborhood, at the present time; at variance with old field stars that may have moved from their original birthplace, these clusters are very likely born close to where they are now and thus their abundance pattern should be representative of the present-day composition of the solar vicinity. Therefore, the comparison of the abundance pattern with that of older stars, including the Sun, allows us to place constraints on models of Galactic evolution in the solar neighborhood.
To our knowledge, only one PMS cluster has an available metallicity determination. Shen et al. (2005) presented an abundance analysis of 18 FK dwarf members of the 30 Myr old open cluster IC 4665. They obtained a very close to solar metallicity ([Fe/H]=0.03) with no dispersion among the members (standard deviation 0.04 dex), within the observational uncertainties.
With this background in mind, we started a project aimed to derive the chemical composition in young clusters. As part of this effort, we present here an abundance analysis of G/K-type members of the two PMS clusters IC 2602 and IC 2391.
2 Target clusters, observations, and data reduction
IC 2602 and IC 2391 are both PMS clusters with estimated ages of 30 Myr (Stauffer et al. 1997) and 55 Myr (Barrado y Navascués et al. 1999, 2004), respectively. The age of IC 2602 has been estimated by classical isochrone fitting, while the age of IC 2391 has been derived using the lithium depletion boundary method.
Due to both their age and distance from the Sun, several studies have focused on these two clusters, aiming to determine different fundamental characteristics, such as membership, the lithium distribution among G/K-type stars, the X-ray properties, rotational velocities, chromospheric activity, and initial mass function (Randich et al. 1995, 1997, 2001; Stauffer et al. 1989, 1997; Prosser et al. 1996; Patten & Simon 1996; Spezzi et al. spezzi (2009)). More recently, Siegler et al. (sig (2007)) presented 24 m Spitzer MIPS observations of the central field of IC 2391, which allowed them to to determine the fraction of debris disks around stars across a wide range of spectral types, from A to K. The comparison with field stars and other clusters indicates that the fraction of disks among A-type stars is lower than expected.
Surprisingly, no extensive abundance study has been carried out for IC 2602 and IC 2391; Randich et al. (2001) derived the iron content ([Fe/H]) for a small sub-sample of stars in both clusters, finding close-to-solar metallicities with rather large standard deviation around the average. Our goal here is twofold: first, based on higher quality spectra, we will derive a more accurate [Fe/H] for the two clusters. Second, besides iron, we will also determine abundances of other elements. Our sample includes eight and seven members of IC 2602 and IC 2391, respectively, for a total of 15 stars. From the initial and larger sample of confirmed members in Randich et al. (ran01 (2001)), we selected only high-quality spectra of G- and K-type stars with rotational velocities (v) below 20 km/sec, since the analysis is much less reliable for stars with higher values.
The observations were carried out at the European Southern Observatory (ESO) and at the Cerro-Tololo Inter-American Observatory (CTIO). New observations were obtained for 12 stars using UVES on VLT/UT2 (Dekker et al. 2000) during three nights of observations on 16, 17 and 18 February of 2001; a slit of 0.8”, providing a resolving power of R40000, and the CD4 cross-disperser (5770 9420 ) were used. Only the blue part of the spectrum (5750 – 7450 Å) was employed for the analysis, for consistency with the analysis of the spectra obtained with other spectrographs (see below). For the remaining three stars we used the spectra already published by Stauffer et al. (stauf2 (1997)) and Randich et al. (ran97 (1997), ran01 (2001)). Specifically, two stars were observed at CTIO with the 4m telescope in conjunction with the Red Long-Camera echelle spectrograph (RLCeS) and a 31.6 lines mm-1. A 120 m slit width (0.8 arcsec on the sky) and a Tektronix 2048x2048 CCD provided a resolution of R 43800 and a spectral coverage between 5800 and 8200 . Finally, we also added one star, IC2602-R95, whose spectrum was acquired on April 1994 with the CASPEC echelle spectrograph mounted at the 3.6m ESO telescope. A 31.6 lines mm-1 grating together with the red cross disperser was used. The slit width was 300 m (2.25 arcsec on the sky), resulting in a resolving power of R18 000 and a spectral coverage from 5585 to 8400 .
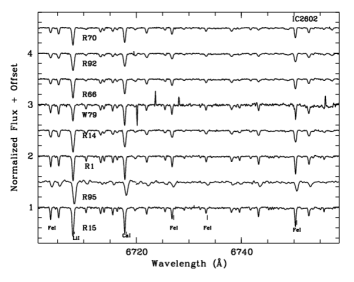
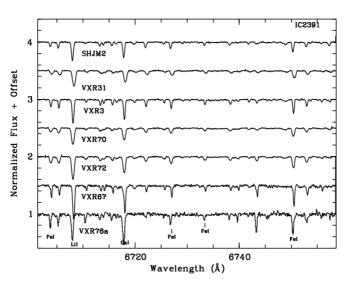
Information on the target stars is provided in Table 1, while their spectra are shown in Fig. 1 where we plot a 60 wide range from 6700 to 6760 .
| star | inst. | exp.time | S/N | V | BV | Teff | |
|---|---|---|---|---|---|---|---|
| (s) | (K) | (km/s) | |||||
| (1) | (2) | (3) | (4) | (5) | (6) | (7) | (8) |
| R1 | UVES | 5x870 | 200 | 11.6 | 0.91 | 5050 | 10 |
| R14 | UVES | 5x870 | 230 | 11.6 | 0.87 | 5150 | 13 |
| R15 | UVES | 10x870 | 200 | 11.7 | 0.93 | 4810 | 7 |
| R66 | UVES | 4x860 | 220 | 11.1 | 0.68 | 5560 | 12 |
| R70 | UVES | 5x900 | 250 | 10.9 | 0.69 | 5700 | 12 |
| R92 | UVES | 7x300 | 200 | 10.3 | 0.69 | 5630 | 14 |
| R95 | CASPEC | 1200 | 150 | 11.7 | 0.87 | 5020 | 12 |
| W79 | RLCeS | 900 | 100 | 11.6 | 0.83 | 5260 | 8 |
| VXR3 | UVES | 5x900 | 260 | 10.9 | — | 5590 | 10 |
| VXR31 | UVES | 7x900 | 280 | 11.2 | — | 5630 | 17 |
| VXR67 | UVES | 8x870 | 130 | 11.7 | — | 4750 | 8 |
| VXR70 | UVES | 5x900 | 260 | 10.8 | 0.64 | 5557 | 17 |
| VXR72 | UVES | 8x900 | 250 | 11.5 | 0.73 | 5260 | 15 |
| VXR76a | RLCeS | 900 | 70 | 12.8 | 1.05 | 4400 | 8 |
| SHJM2 | UVES | 7x300 | 270 | 10.3 | 0.57 | 5970 | 15 |
-
(1) Identifier from Randich et al. (ran95 (1995)) for IC 2602 stars with the exception of W79 (Whiteoak 1961), and from Patten and Simon (patten (1996)) for IC 2391 members; (2) instruments (UVES, CASPEC and Red Long-Camera echelle spectrograph -RLCeS); (3) exposure time and number of exposures; (4) S/N ratios at 6707.78 Å; (5) V magnitude from Randich et al. (2001); (6) BV colors from Randich et al.( 2001); (7) initial Teff from Randich et al. (ran01 (2001)), and (8) v from Stauffer et al. (1997).
For details on the reduction of CTIO and CASPEC spectra we refer to Stauffer et al. (1997) and Randich et al. (ran01 (2001)), respectively. The UVES data were reduced using the UVES pipeline Data Reduction Software (Modigliani et al. 2004). The software is designed to automatically reduce point source object spectra from raw frames to order extraction and final order merging, by following the standard procedure: background subtraction, flat-field correction, order extraction, sky subtraction and wavelength calibration.
3 Analysis
3.1 Line list and equivalent widths
The abundance analysis was carried out using the driver abfind of the spectral code MOOG (Sneden, 1973 -2000 version) and a grid of 1-D model atmospheres by Kurucz (1993). Radiative and Stark broadening are treated in a standard way; for the collisional damping we used the classical Unsöld (1955) approximation. As discussed by Paulson et al. (2003) this choice should not greatly affect the differential analysis with respect to the Sun. LTE abundance values were derived by means of the equivalent widths (EWs) which were measured using a Gaussian fitting procedure with the IRAF task SPLOT .
For the analysis we adopted as a basis the line list by Randich et al. (2006), but i) we selected only lines at greater than 5750 Å; ii) we integrated the list with a few lines from Sestito et al. (paola06 (2006)), choosing the lines included in our wavelength range and for which Sestito et al. obtained solar abundances in agreement with the standard values. We refer to those two papers for further details on atomic parameters () and their sources; our line list for all the elements with EWs measured both in the solar spectrum (see next section) and in the spectra of our sample stars is available as electronic table.
3.2 Solar analysis
Our analysis was carried out differentially with respect to the Sun; as a consequence, most of the systematic errors due to e.g. atomic parameters should be canceled out. We analyzed the solar spectrum obtained with UVES (see Randich et al. 2006) using the same code, line list, and model atmospheres employed for our sample stars. The following stellar parameters were adopted for the Sun: Teff=5770 K, g=4.44, =1.1, and [M/H]=0. We obtained n(Fe I) = 7.520.02 and n(Fe II)=7.52 0.03. The abundance values derived for the other elements are listed in Table 2 together with the the values by Anders & Grevesse (ande (1989)) that were used as input in MOOG. As the table shows, the agreement is very good for all elements.
| Element | n(X) | n(X)AG89 |
|---|---|---|
| Na i | 6.330.02 | 6.33 |
| Si i | 7.560.01 | 7.55 |
| Ca i | 6.350.02 | 6.36 |
| Ti i | 4.970.01 | 4.99 |
| Ti ii | 4.920.10 | 4.99 |
| Ni i | 6.260.02 | 6.25 |
3.3 Stellar parameters
Initial effective temperatures (Teff) were retrieved from Randich et al. (ran01 (2001)) who, in turn, derived them as using both BV and VI colors and the calibrations of Soderblom et al. (soder (1993)) and Bessell (bes (1991)), respectively –see Randich et al. (ran01 (2001)) for details.
We formally derived final temperatures by removing the trends between n(Fe) and the excitation potential (), after applying a 1- clipping criterion to the initial line list. In most cases, however, initial temperatures were already close to the final ones and only small adjustments were needed. This is shown in Fig. 2 where we compare our final Teff values with those derived by Randich et al. (ran01 (2001)): as one can see, the agreement is good.
For surface gravities, we adopted as initial values g=4.5 for all our sample stars. For the warmest stars in the sample (T K) and for the very slow rotators (v km/sec) we were able to check this assumption by imposing that the difference between the average n(Fe I) and n(Fe II) should be below 0.05 dex. More in detail, we were able to measure the Fe II for the stars R66, R70 and R92 (IC 2602) and VXR3 and SHJM2 (IC 2391): the final value that we derived for all these stars is g=4.45 and very agrees well with the initial assumption.
Initial microturbulence values () were estimated using the Nissen’s relationship (1981): = 3.2 x 10⁻⁴ (Teff 6390) 1.3(g 4.16) + 1.7 km/sec. Final values were retrieved by zeroing the slope between iron abundances and EWs in MOOG.

3.4 Errors
As usual, the final abundances are affected by random (internal) and systematic (external) uncertainties.
Internal errors due to uncertainties in oscillator strengths ()
should cancel out, since our analysis is strictly
differential with respect to the Sun.
Random errors due to EW measurements are instead
well represented by the standard
deviation from the mean abundance based on the whole set of lines
( in [Fe/H] -see Table 4).
The errors () in [X/Fe] listed in Table 4 were, in turn, obtained by quadratically adding the rms for [Fe/H]
and rms for [X/H].
Final abundances are also affected by the random errors due to uncertainties in
the adopted set of stellar parameters, namely T, g, and .
These sources of error were estimated by varying one parameter at time, while keeping the other ones unchanged;
then we took the quadratic sum of these three contributions in order to obtain , for [Fe/H] and for all [X/Fe] ratios.
We adopted random errors of 60 K and 0.2 km/sec in Teff
and , respectively:
variations in Teff larger than 60 K would have introduced
a trend in n(Fe) and ; similarly, variations in microturbulence velocities larger than 0.2 km would result in
spurious trends in abundances
versus EWs.
For the five stars for which we could optimize the surface gravities, the uncertainties in g were estimated by varying this quantity until the difference between
n(Fe i) and n(Fe ii) is larger than 0.05 dex, i.e. the ionization equilibrium condition is no longer verified; this is achieved for
a variation of 0.15 dex (R66 and VXR3) and 0.20 (R70, R92, SHJM2) dex.
For all the other stars, we adopted a conservative value of 0.25 dex.
In Table 3 we list the errors in [Fe/H] and [X/Fe] ratios due to uncertainties in stellar parameters for one of the coolest stars and for the warmest one in the sample.
The total random errors () were then calculated by quadratically adding and ; the standard deviation of the cluster mean, listed in Table 4, is always smaller than the for all our sample stars and all the elements, suggesting that our error estimates are conservative.
A global estimate of external errors due to the model atmospheres and to the code can be obtained by analyzing one star whose chemical content is well known in the literature; to this purpose, we derived abundances for the Hyades member vb187 whose spectrum was acquired with the same instrument (UVES -see Randich et al. 2007). The metallicity that we derived ([Fe/H]=0.14) is in excellent agreement with all previous determinations (e.g. Paulson et al. 2003), also [Si/Fe], [Ca/Fe] and [Ti/Fe] well agree within the uncertainties (see Table 4). We conclude that our analysis should not be affected by major systematic errors.
| SHJM2 | Teff=5970K | g=4.45 | =1.18 km/s |
|---|---|---|---|
| Teff=60 | g=0.25 | =0.2 | |
| (K) | dex | km/s | |
| [Fe/H] | 0.05/0.04 | 0.03/0.04 | 0.02/0.04 |
| 0.03/0.02 | 0.01/0.01 | 0.02/0.03 | |
| 0.04/0.03 | 0.03/0.03 | 0.03/0.03 | |
| 0.03/0.01 | 0.03/0.03 | 0.02/0.02 | |
| 0.01/0.02 | 0.01/0.01 | 0.01/0.03 | |
| 0.02/0.03 | 0.08/0.07 | 0.02/0.01 | |
| 0.02/0.01 | 0.02/0.01 | 0.01/0.02 | |
| R95 | Teff=5020K | g=4.5 | =0.82 km/s |
| Teff=60 | g=0.25 | ||
| (K) | dex | km/s | |
| 0.01/0.02 | 0.01/0.01 | 0.05/0.04 | |
| 0.01/0.03 | 0.04/0.01 | 0.05/0.03 | |
| 0.03/0.04 | 0.04/0.02 | 0.04/0.03 | |
| 0.05/0.06 | 0.05/0.04 | 0.01/0.01 | |
| 0.07/0.05 | 0.02/0.02 | 0.01/0.02 | |
| 0.05/0.04 | 0.09/0.08 | 0.03/0.04 | |
| 0.03/0.02 | 0.05/0.04 | 0.01/0.01 |
4 Results


| Star | Teff | g | [Fe/H] | [Na/Fe] | [Si/Fe] | [Ca/Fe] | [TiI/Fe] | [TiII/Fe] | [Ni/Fe] | |
| (K) | (km/sec) | |||||||||
| R1 | 5050 | 4.5 | 1.15 | 0.010.040.05 | 0.140.040.06 | 0.020.050.09 | 0.020.070.06 | 0.060.050.06 | 0.220.040.11 | 0.010.060.08 |
| R14 | 5100 | 4.5 | 1.1 | 00.050.05 | 0.070.060.06 | 0.050.060.09 | 0.010.060.06 | 0.020.070.06 | 0.110.040.11 | 0.010.080.06 |
| R15 | 4770 | 4.5 | 0.7 | 00.060.06 | 0.350.070.08 | 0.030.070.09 | 0.20.050.07 | 0.40.050.06 | 0.300.050.13 | 0.020.050.08 |
| R66 | 5590 | 4.45 | 1.15 | 0.010.030.06 | 0.030.040.05 | 0.020.050.05 | 00.050.02 | 0.030.040.04 | 0.010.080.09 | 0.030.050.04 |
| R70 | 5760 | 4.45 | 1.1 | 00.050.06 | 00.060.05 | 0.040.070.06 | 0.030.10.04 | 00.050.03 | 00.040.08 | 0.040.080.05 |
| R92 | 5630 | 4.45 | 1.2 | 0.020.040.06 | 0.020.040.05 | 0.020.060.05 | 0.020.050.03 | 0.010.070.02 | 0.020.010.08 | 0.020.060.04 |
| R95 | 5020 | 4.5 | 0.8 | 0.020.030.05 | 0.130.050.06 | 0.020.060.07 | 0.040.060.07 | 0.070.080.07 | 0.240.040.11 | 0.050.090.07 |
| W79 | 5260 | 4.5 | 1.1 | 0.080.06 | 0.090.06 | 0.010.080.07 | 00.080.07 | 0.020.080.05 | 0.120.010.10 | 0.120.04 |
| IC 2602 | 00.01 | 0.12 | 00.03 | 0.020.08 | 0.060.14 | 0.130.12 | 0.020.02 | |||
| 0 | ||||||||||
| VXR3 | 5590 | 4.45 | 1.15 | 00.040.07 | 0.020.050.05 | 0.020.060.05 | 0.010.050.02 | 0.000.060.03 | 0.030.030.09 | 0.020.060.04 |
| VXR31 | 5630 | 4.5 | 1.2 | 0.020.040.07 | 0.020.050.05 | 0.020.050.05 | 0.010.040.01 | 0.030.080.02 | 0.070.030.09 | 0.020.060.02 |
| VXR67 | 4680 | 4.5 | 0.7 | 0.010.050.06 | 0.310.090.07 | 00.090.09 | 0.210.110.08 | 0.380.040.06 | 0.250.070.13 | 0.020.060.06 |
| VXR70 | 5557 | 4.5 | 1.15 | 0.030.050.07 | 0.060.070.05 | 0.040.060.07 | 0.030.060.03 | 0.030.070.04 | 0.090.040.10 | 0.020.050.05 |
| VXR72 | 5257 | 4.5 | 1.1 | 0.020.030.06 | 0.120.050.06 | 0.010.040.08 | 0.030.080.05 | 0.020.050.05 | 0.170.050.11 | 0.010.040.05 |
| VXR76a | 4343 | 4.5 | 1.2 | 00.060.07 | 0.340.080.07 | 0.060.090.08 | 0.380.120.08 | 0.350.160.06 | 0.370.060.13 | 0.020.090.08 |
| SHJM2 | 5970 | 4.45 | 1.2 | 00.030.05 | 0.030.040.04 | 0.010.060.06 | 0.020.040.04 | 0.010.040.01 | 00.020.08 | 0.030.040.03 |
| IC 2391 | 0.010.02 | 0.120.14 | 0.010.02 | 0.070.16 | 0.100.18 | 0.140.13 | 00.02 | |||
| 0.02 | 0 | |||||||||
| vb 187 | 5339 | 4.5 | 0.92 | 0.140.040.06 | 00.030.05 | 0.060.020.08 | 00.040.05 | 0.070.040.05 | 0.120.090.09 | 0.040.030.05 |
| HyadesPaulson | 0.130.05 | 0.010.09 | 0.050.05 | 0.070.07 | 0.030.05 | — | — | |||
| HyadesFriel | 0.13 | 0.01 | 0.04 | 0.06 | 0.06 | — | — |
-
a
Average values were computed by discarding the coolest star R15. b VXR67 and VXR76a were not included in the average. c Average values by considering only stars with Teff 5500 K
Our results for [Fe/H] and all [X/Fe] ratios are reported in Table 4 along with errors due to EW measurements and stellar parameters, namely and . These final abundances were retrieved by applying a 1- clipping to the initial line list for the iron and for the other elements with a not too small number of lines (such as Ca i and Ti i). Adopted stellar parameters are also listed in Table 4.
As a verification of our method, we show in Fig. 3 the [X/Fe] ratios as a function of Teff for all our sample stars: as one can see, for [Fe/H], [Si/Fe] and [Ni/Fe] no obvious correlation is present in the diagram; on the other hand, sodium, calcium and titanium abundances are significantly lower than average for the coolest stars in the sample (R15, VXR67, and VXR76a). Trends of [X/Fe] vs. Teff for various elements were already found for old field stars by Bodaghee et al. (2003) and by Gilli et al. (2006), who explained them as due to NLTE effects. Also in our case NLTE is most likely the reason for the different abundance ratios obtained for warm and cool stars. However, we note that, while for Ca we obtain the same decreasing trend as in the literature studies, we also find that [Ti/Fe] ratios decrease with Teff, at variance with the increasing trend found by both Bodaghee et al. and Gilli et al. We propose that the different behaviour is due to the much younger age of our sample stars: they have enhanced levels of chromospheric activity and are more likely affected by NLTE overionization, rather than by over-recombination; as discussed by Takeda et al. (takeda (2007)), the latter would indeed cause enhancement toward lower Teff values.
To confirm that over-ionization is the reason for the low Ti i abundances of cool stars, we computed Ti abundances using a few Ti ii included in our spectral range; the results are shown in Fig. 4 where [Ti ii/Fe]-[Ti i/Fe] is plotted as a function of Teff. The figure shows that the three stars cooler than 5000 K characterized by lower Ti i abundances indeed have larger differences between Ti ii and Ti i, confirming the over-ionization hypothesis.
For Na, Mashonkina et al. (2000) computed standard NLTE effects for the lines used in this paper, finding that for g, NLTE corrections are small and do not greatly depend on Teff. Again, we suggest that the low [Na/Fe] ratios that we measure for the coolest sample stars, might be due to overionization due to chromospheric activity. We also note that, while Ti and Ca show lower abundances below K, the trend of decreasing Na already starts at K. Independently of the explanation for the discrepant abundance ratios for cool stars, we computed the mean [X/Fe] ratios for Na i, Ca i, and Ti i both considering all stars, and discarding the three coolest members (see Table 4). Average values for Na were also computed considering only stars warmer than 5500 K.
Average values of [Fe/H] and [X/Fe] ratios for all elements are shown in Table 4. The average metallicity is [Fe/H]=00.01 and [Fe/H]=0.010.02 for IC 2602 and IC 2391, respectively; the -elements, as well as sodium and nickel, also confirm a homogeneous solar composition, with no evidence of star-to-star scatter. Our results for [Fe/H] are in agreement with those of Randich et al. (2001) who, as mentioned, also obtained a solar metallicity for both clusters. We stress, however, that the higher quality data used here allow us to obtain better measurements for each star and thus to place tighter constraints on the average and the absence of any star-to-star variation.
5 Discussion
As mentioned in the Introduction, along with IC 4665, our IC clusters represent the only young PMS clusters for which a detailed and accurate chemical composition analysis is available so far. For both them we obtain a solar metallicity and global abundance pattern, similarly to the results of Shen et al. (2005) for IC 4665. In the following we will discuss the implications of our results for the three issues discussed in the introduction.
5.1 Metallicity and debris disks
Thanks to the Spitzer Space Telescope, the fraction of debris disks has now been determined in a number of open clusters and associations with ages up to 600 Myr (the Hyades). These observations have allowed investigators to derive the evolution with age of the fraction of debris disks. As mentioned in the introduction, this number reaches a peak around 20-30 Myr and both the decay and variation of 24 m excess ratios around FGK-type stars appear similar to those measured around A-type stars (Siegler et al. 2007). The question remains, however, whether this decay might depend on the metal content. Siegler et al. (2007) carried out 24 m observations of IC 2391 and found that the fraction of debris disks around stars of spectral type B5-A9 is below that measured in other samples of similar age and even in older clusters such as the Pleiades and NGC 2516. On the other hand, the fraction of debris disks around FGK (solar-type) stars is normal. IC 2602 also seems to have a lower than expected fraction of debris disks around B and A stars. This is shown in Figure 13 of Currie et al. (currie (2008)), although no reference is provided for observations of IC 2602. With the caveat that the lower than expected number of A stars hosting debris disks could be simply due to a statistical deviation, Siegler et al. (sig (2007)) suggested possible environment effects, among which metallicity, as responsible for this trend.
To our knowledge, only a minority of the open clusters observed by have an accurate metallicity determination available (Pleiades, NGC 2516, Hyades). Vice versa, several clusters in the age range Myr with metallicity measurements do not have observations. In order to reveal the possible role of metallicity in debris disk frequency and evolution, a large sample of clusters with both metallicity and measurements should be constructed; in particular, metallicity should be determined for additional PMS clusters observed by . Nevertheless, the comparison of IC 2391 with the Pleiades and NGC 2516 seems to suggest that the reason for the lower fraction of A-type stars with 24 m excess in IC 2391 is not metallicity. In fact, both NGC 2516 and the Pleiades have a fraction of stars showing an excess in agreement with the expected decay law from younger clusters and field stars, and larger than in IC 2391. Also, both clusters have a very close to solar metallicity (see Sect. 5.2 below and Terndrup et al. 2002). Our reliable confirmation of a solar metallicity for IC 2391 (and IC 2602) thus seems to rule out a metallicity effect.
5.2 Abundances as tracers of a common origin
We recall that a common origin has been suggested for several near-by OCs and young associations like the Pleiades, NGC 1039, and IC 2602, among others. In order to check whether their chemical composition supports the common origin scenario or not, in Fig. 6 the abundance pattern of IC 2602 is compared with those of Pleiades (both the King et al. 2000 and Wilden et al. 2002 analyses are considered), and of NGC 1039 (Schuler et al. 2003). Note that the two studies of the Pleiades yield different metallicities; namely, [Fe/H] (King et al. 2000), while Wilden et al. (2002) found n(Fe)=7.44. This translates into [Fe/H]=, 0.05, and , when assuming our solar Fe abundance, their solar model Fe abundance ( n(Fe)=7.49, their Table 3), or their adopted value for the Sun ( n(Fe)=7.54 –their Table 5). We also mention that the study of Wilden is based on a much large number of stars than that of King et al. Given the uncertainties on the derived abundances, the comparison between Pleiades and IC 2602 does not confirm nor exclude the presence of a common origin and a homogeneous analysis is needed. On the contrary, the abundance pattern of NGC 1039 appears to be significantly different from that of IC 2602, well beyond the observational uncertainties, not only for iron, but also for the other elements. In particular, NGC 1039 shows an iron content slightly over-solar, with [Fe/H]=+0.07 dex (Schuler et al. 2003) with respect to IC 2602; on the other hand, silicon, titanium and nickel seem to show a sub solar composition. The [Ca/Fe] ratio is instead close to the solar, although in this case the uncertainty is much larger, with a standard deviation of 0.1 dex .
To investigate if such a behaviour could be due to inhomogeneities in the abundance scales, we re-analyzed one member (JP133) of Schuler et al. (2003) using their published EWs and a) their atomic parameters, b) our atomic parameters for the lines in common with our list. Also, we analyzed one of our sample stars (R66), adopting their atomic parameters for the lines in common. The results of the different tests are listed in Table 5: both the [Fe/H] values and [X/Fe] ratios that we obtain for the JP133 are similar to those derived by Schuler and collaborators; also, for R66 we retrieve abundances very similar to our original ones. These results show that the two abundance scales are consistent with each other. In other words, we confirm that the observed discrepancy in abundance pattern is not related to the abundance analysis, but most likely reflects the different chemical composition of these two clusters. In turn, these different abundance patterns do not support a common origin for NGC 1039 and IC 2602.
| Star | Teff | g | [Fe/H] | [Si/Fe] | [Ca/Fe] | [Ti/Fe] | [Ni/Fe] | |
| (K) | (km/s) | |||||||
| JP133Schuler | 5710 | 4.54 | 1.88 | 0.070.05 | 0.020.08 | 0.020.08 | 0.170.08 | 0.130.05 |
| JP133a | 5710 | 4.54 | 1.88 | 0.080.06 | 0.090.07 | 0.020.1 | 0.170.11 | 0.160.08 |
| JP133b | 5710 | 4.54 | 1.88 | 0.050.14 | — | 0.020.16 | — | 0.180.11 |
| R66 | 5640 | 4.45 | 1.30 | 0.020.07 | 0.020.07 | 0.050.06 | 0.030.05 | 0.040.05 |
- a With the line list by Schuler et al. (2003) and our method
- b EWs by Schuler et al. and our for common lines.
5.3 IC clusters in the disk
Based on the fact that the average metallicity of solar-type in the solar neighborhood is about 0.2 dex below that of the Sun, Wielen et al. (wielen (1996)) suggested that the Sun might have been formed in the inner part of the disk and then migrated to its present position. The solar metallicity and solar abundance ratios for IC 2602, IC 2391, and IC 4665 do not support this hypothesis. As mentioned, given their young age, these clusters have had no time to move from their birthplace, the solar neighborhood; thus their abundances trace the chemical composition of the solar vicinity at the present time. The fact that they share the same composition as the Sun (both iron and other elements) provides support to the idea that the Sun was formed where it is now and, more in general, that the solar neighborhood underwent very little (if any) chemical evolution in the last Gyr.
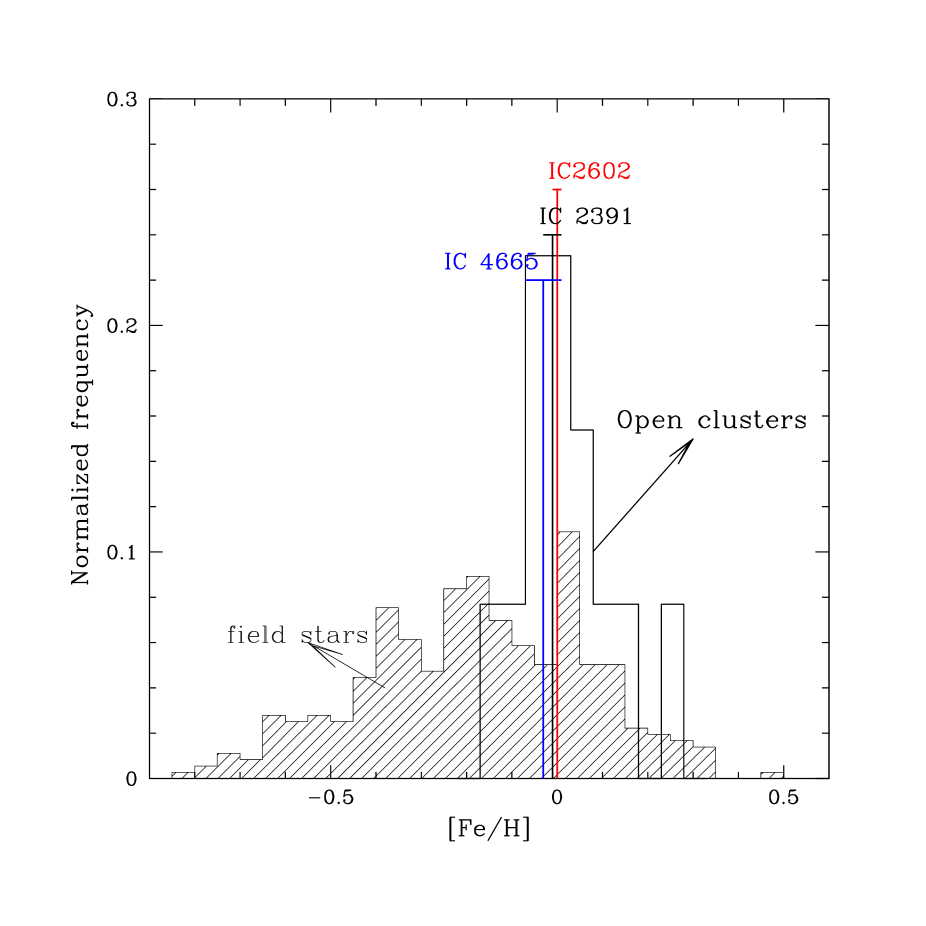
In Figure 5 we compare the metallicity distribution of thin disk stars from Soubiran & Girard (2005) with the average [Fe/H] values of IC 2602, IC 2391, and IC 4665, as well as with the distribution of metallicities of all clusters closer than 500 pc with a good quality measurement of [Fe/H]. The figure clearly shows that the metallicity distribution of open clusters is different from that of field stars; the last extends to significantly lower metallicities and is characterized by a larger dispersion. The cluster distribution peaks at the same solar metallicity of the three PMS clusters; the mean metallicity of all the clusters, including the PMS clusters, is [Fe/H], to be compared with [Fe/H] for field stars. The fraction of field stars with a very close-to-solar metallicity ([Fe/H]) is 14 % only, while almost 62 % have [Fe/H] below . Also, we note that the oldest cluster in the sample (NGC 752, Gyr) shares the solar metallicity of the IC clusters. In other words, the inclusion of IC 2602 and IC 2391 in the cluster sample not only reinforces the conclusion that most clusters in the solar neighborhood are characterized by a solar metallicity, but also reveals the lack of an age-metallicity relationship.
The difference between the young cluster and field stars [Fe/H] values suggests that a large fraction of field stars have not formed where they are now in the solar vicinity; rather they originated at larger distances from the Sun, in the outer part of the Galaxy, where the metallicity is lower because of the presence of a negative radial metallicity gradient (e.g., Magrini et al. 2009 and references therein). These stars then underwent radial mixing (see e.g. Prantzos 2008), moving to their present position.

6 Summary and conclusions
In this paper, we present a high-resolution spectroscopic study of the two young near-by PMS clusters IC 2602 and IC 2391; along with IC 4665, these are the only young OCs whose abundances have been determined so far. We measured elemental abundances of Fe i, Na i, Si i, Ca i, Ti i, Ti ii, and Ni i for a sample of 15 dwarf members of spectral types GK. The clusters show a highly homogeneous solar composition, with no hint of dispersion among the members, within the very small uncertainties.
Our results strongly favour the hypothesis that the Sun was born where it is now, rather than having migrated there from the inner disk, and that the solar neighborhood has undergone little evolution in the last 4.5 Gyr. On the other hand, the comparison with the metallicity distribution of field stars in the solar vicinity suggests that metal-poor stars in this sample originated from the outer parts of the Galactic disk.
The comparison between the abundance patterns of IC 2602 and NGC 1039 seems to exclude a common origin for the two clusters, as proposed in the literature; iron as well the overall abundance pattern are different, well beyond the measurement uncertainties.
Finally, our results seem to exclude metallicity as the reason for the low fraction of debris disks observed among A-type stars in IC 2391. We stress however that, in order to derive definitive conclusions on the relationship between metallicity and the evolution of debris disks, accurate metallicity determinations should be performed for PMS clusters with available observations.
Acknowledgements.
This work has made use of the WEBDA database, originally developed by J.C. Mermilliod and now maintained by E. Paunzen. We warmly thank the anonymous referee for her/his valuable comments. This project has been partially funded by PRIN INAF 2007 ”From active accretion to planetary debris disk: transitional disks and metallicities”.References
- (1) Anders, R., & Grevesse, N. 1989, Geochim. Cosmochim. Acta, 53, 197
- (2) Barrado y Navascués, D., Stauffer, J.R., Patten, S. 1999, ApJ, 522, L53
- (3) Barrado y Navascués, D., Stauffer, J.R., Jayawardhana, R. 2004, ApJ, 614, 386
- (4) Beichman, C. A., Bryden, G., Stapelfeldt, K. R. et al. 2006, ApJ, 652, 1654
- (5) Bessel, M.S. 1991, AJ, 101, 662
- (6) Bodaghee, A., Santos, N.C., Israelian, G., Mayor, M. 2003, A&A, 404, 715
- (7) Boesgaard, A.M., Friel, E.D. 1990, ApJ, 351, 467
- (8) Bryden, G., Beichman, C. A., Trilling, D. E., et al. 2006, ApJ, 636, 1098
- (9) Carraro, G., Bresolin, F., Villanova, S. 2004, AJ, 128, 1676
- (10) Carretta, E., Bragaglia, A., Gratton, R.G. 2007, A&A, 473, 129
- (11) Currie, T., Plavchan, P., Kenyon, S.J. 2008, ApJ, 688, 597
- (12) Dekker, H. et al. 2000, SPIE, 4008, 534
- (13) Dominik, C., Decin, G. 2003, ApJ, 598, 626
- (14) Ecuvillon, A., Israelian, G., Pont, F., Santos, N.C., Mayor, M. 2007, A&A, 461, 171
- (15) Eggen, O.J. 1975, PASP, 87, 137
- (16) Eggen, O.J. 1983a, MNRAS, 204, 377
- (17) Eggen, O.J. 1983b, MNRAS, 204, 391
- (18) Ford, A., Jeffries, R.D., Smalley, B. 2005, MNRAS, 364, 272
- (19) Friel, E.D., Boesgaard, A.M. 1992, ApJ, 387, 170
- (20) Friel E.D., Jacobson, H.R., Barrett, E., et al. 2003, AJ, 126, 2372
- (21) Friel, E.D. 2006, ESO ASTROPHYSICS SYMPOSIA, S. Randich & L. Pasquini (eds), Springer-Verlag, p. 3
- (22) Gilli, G., Isrealian, G., Ecuvillon, A., Santos, N.C., Mayor, M. 2006, A&A, 449, 723
- (23) Hünsch, M., Randich, S., Hempel, M., Weidner, C., Schmitt, J.H.M.M. 2004, A&A, 418, 539
- (24) Jacobson, H.R., Friel E.D., Pilachowski, C.A. 2007, AJ, 134, 1216
- (25) Jeffries, R.D., Totten, E.J., Harmer, S., Deliyannis, C.P. 2002, MNRAS, 336, 1109
- (26) King, J.R., Soderblom, D.R., Fischer, D., Jones, B.F. 2000, ApJ, 533, 944
- (27) Kurucz, R.L. 1993, CD-ROM Nr. 9
- (28) Magrini, L., Sestito, P., Randich, S., Galli, D. 2009, A&A, 494, 95
- (29) Mashonkina, L.I., Shimanskii, V.V., Sakhibullin, N.A. 2000, Astronomy Reports, 44, 790
- (30) Modigliani, A., Mulas, G., Porceddu, I., et al. ESO Messenger, 118, 8
- (31) Ortega, V. G., Jilinski, E., de la Reza, R., Bazzanella, B. 2007, MNRAS, 377, 441
- (32) Pace, G., Pasquini, L., François, P. 2008, A&A, 489, 403
- (33) Patten, B.M., & Simon, T. 1996, ApJS, 106, 489
- (34) Paulson, D.B., Sneden C., Cochran, W.D. 2003, AJ, 125, 3185
- (35) Piskunov N.E., Kupka F., Ryabchikova T.A., Weiss W.W., Jeffery C.S. 1995, A&AS 112, 525 (VALD-1)
- (36) Prantzos, N. 2008, IAU Symposium 254, in press (arXiv:0809.2507)
- (37) Prosser, C.F., Randich, S., Stauffer, J.R. 1996, AJ, 112, 649
- (38) Randich, S., Schmitt, J., Prosser, C. F., Stauffer, J.R. 1995, A&A, 300, 134
- (39) Randich, S., Aharpour, N, Pallavicini, R., Prosser, C.F., Stauffer, J.R. 1997, A&A, 323, 86
- (40) Randich, S., Pallavicini, R., Meola, G., Stauffer, J.R., Balachandran, S.C. 2001, A&A, 372, 862
- (41) Randich, S., Sestito, P., Primas, F., Pallavicini, R., Pasquini, L. 2006, A&A, 450, 557
- (42) Ryabchikova T.A., Piskunov N.E., Stempels H.C., Kupka F., Weiss W.W. Proc. of the 6th International Colloquium on Atomic Spectra and Oscillator Strengths, Victoria BC, Canada, 1998, Physica Scripta T83, 162-173
- (43) Santos, N.C., Israelian, G., Mayor, M., 2004, A&A, 415, 1153-1166
- (44) Schuler, S.C., King, J.R., Fischer, D.A., Soderblom, D.R. Jones, B.F 2003, AJ, 125, 2085
- (45) Sestito, P., Randich, S., Mermilliod, J.-C., Pallavicini, R. 2003, A&A, 407, 829
- (46) Sestito, P., Randich, S., Pallavicini, R. 2004, A&A, 426, 809
- (47) Sestito, P., Bragaglia, A., Randich, S., Carretta, E., Prisinzano, L., Tosi, M. 2006, A&A, 4568, 121
- (48) Sestito, P., Randich, S., Bragaglia, A. 2007, A&A, 465, 185
- (49) Sestito, P., Bragaglia, A., Randich, S., et al. 2008, A&A, 488, 943
- (50) Shen, Z.-X., Jones, B., Lin, D. N. C., Liu, X.-W., Li, S.L. 2005, ApJ, 635, 608
- (51) Siegler, N., Muzerolle, J., Young, E., et al. 2007, ApJ, 654, 580
- (52) Sneden, C.A. 1973, ApJ, 184, 839
- (53) Soderblom, D.R., Stauffer, J.R., Hudon, J.D., & Jones, B.F. 1993, ApJS, 85, 313
- (54) Soubiran, C., Girard, P. 2005, A&A, 438, 139-151
- (55) Spezzi, L., Pagano, I., Marino, G., et al. 2009, A&A, in press (arXiv:0902.4571)
- (56) Stauffer, J.R., Hartmann, L.W., Jones, B.F., McNamara, B.R. 1989, ApJ, 342, 285S
- (57) Stauffer, J.R., 1997, Hartmann, L.W., Prosser, C.F., et al. 1997, ApJ, 479,776
- (58) Takeda, Y. 2007, PASJ, 59, 335
- (59) Terndrup, D.M., Pinsonneault, M., Jeffries, R.D., Ford, A., Stauffer, J.R., Sills, A. 2002, ApJ, 576, 950
- (60) Trilling, D.E., Bryden, G., Beichman, C.A., et al. 2008, ApJ, 674, 1086
- (61) Unsöld, A., 1955, Physik der Sternatmosphären (Berlin: Springer-Verlag)
- (62) Whiteoak, J.B. 1961, MNRAS, 123, 245
- (63) Wielen, R., Fuchs, B., Dettbarn, C. 1996, A&A, 314, 438
- (64) Wilden, B.S., Jones, B.F., Lin, D.N.C., Soderblom, D.R. 2002, AJ, 124, 2799
- (65) Yong, D., Carney, B.W., de Almeida, L. 2005, AJ, 130, 597.