Killing of targets by effector CD8+T cells in the mouse spleen follows the law of mass action
Abstract
It has been difficult to measure efficacy of T cell-based vaccines and to correlate efficacy of CD8+T cell responses with protection against viral infections. In part, this difficulty is due to our poor understanding of the in vivo efficacy of CD8+T cells. Using a recently developed experimental method of in vivo cytotoxicity we investigated quantitative aspects of killing of peptide-pulsed targets by effector and memory CD8+T cells, specific to three epitopes of lymphocytic choriomeningitis virus (LCMV), in the mouse spleen. By analyzing data on killing of targets with varying number of epitope-specific effector and memory CD8+T cells, we find that killing of targets by effectors follows the law of mass-action, that is the death rate of peptide-pulsed targets is proportional to the frequency of CTLs in the spleen. In contrast, killing of targets by memory CD8+T cells does not follow the mass action law because the death rate of targets saturates at high frequencies of memory CD8+T cells. For both effector and memory cells, we also find no support for a killing term that includes the decrease of the death rate of targets with increasing target cell density. Importantly, we find that at low CD8+T cell frequencies, effector and memory CD8+T cells on the per capita basis are equally efficient at killing peptide-pulsed targets. Our framework provides the guideline for the calculation of the level of memory CD8+T cells required to provide sterilizing protection against viral infection. Our results thus form a basis for quantitative understanding of the process of killing of virus-infected cells by T cell responses in tissues and can be used to correlate the phenotype of vaccine-induced memory CD8 T cells with their killing efficacy in vivo .
Short running title: Killing by CD8+T cells in tissues
Abbreviations: LCMV, lymphocytic choriomeningitis virus, CTLs, cytotoxic T lymphocytes, CIs, confidence intervals, RSS, residual sum of squares
1 Introduction
Vaccination is often considered as one of the greatest medical achievements of the last century but due our limited understanding of the correlates of protection, most vaccines have been developed by a trial and error approach and we have failed to deliver vaccines for important diseases like AIDS or malaria. It is generally believed that most of the currently used vaccines provide protection by inducing high titers of pathogen-neutralizing antibodies (1). The efficacy of an antibody-inducing vaccine is generally proportional to the titer of neutralizing antibodies after vaccination (2). Several vaccines that are currently being developed for chronic infections such as HIV and malaria, are aimed to stimulate T cell responses. It is unclear, however, what parameters of the T cell memory that is induced by vaccination, best correlate with protection (1). It has been suggested that polyfunctional memory CD4 T cells may be superior in providing protection following infection with Leishmania (3) and polyfunctional memory CD8+T cells are protective against SIV infection (4), but for some important human infections, such as HIV infection, evidence is still lacking (5, 6).
In part, our limited understanding of how memory T cells provide protection comes from the fact that most effector functions of effector and memory T cells are measured in vitro (after short- or long-term restimulation), and there is very little quantitative details of how T cells control pathogen growth in tissues (e.g., (7)). Recently, a new experimental technique to measure cytotoxic efficacy of CD8+T cells in vivo has been introduced (8, 9, 10, 11, 12). In this assay, peptide-pulsed and unpulsed target cells are transferred into mice harboring peptide-specific effector or memory CD8+T cells, and elimination of pulsed targets is used as indication of Ag-specific killing in vivo (13, 14, 15, 16, 17). We use the data from recently published experiments (14) and use a recently developed mathematical model (19, 20, 18) to investigate quantitative details how of effector and memory CD8+T cells, specific for three epitopes of lymphocytic choriomeningitis virus (LCMV), kill peptide-pulsed targets in the mouse spleen.
Unexpectedly, our results suggest that killing of targets by effector CD8+T cells (present at the peak of the immune response) follows the law of mass action: the rate of killing is simply proportional to the density of targets and the frequency of effector CD8+T cells in the spleen. Such a linear dependence of the death rate of targets on the frequency of effectors was observed over 100 fold range of effector frequencies. In contrast, killing of targets by LCMV-specific memory CD8+T cells does not follow the law of mass action as the death rate of peptide-pulsed targets saturates at high frequencies of memory CD8 T cells. This saturation suggests that there might be an upper bound level of efficacy of the total memory T cell response, and this may potentially limit the efficacy of T-cell based vaccines. Interestingly, we found that at low CD8+T cell frequencies, effector and memory CD8+T cells are equally efficient at clearing peptide-pulsed targets. This suggests that T-cell based vaccines would provide sterilizing immunity if memory CD8+T cells, that are generated by vaccination, were to remain present at high enough frequencies (21, 22).
This analysis may form a basis for quantitative understanding of efficacy of T cell-based vaccines. By correlating expression of various cell surface and intracellular markers with the in vivo killing efficacy of memory T cells of different specificities in mice, we may better understand which qualities of memory cells provide best protection. For example, one could ask if polyfunctional CD8+T cell induced by vaccination are better killers in vivo than monofunctional memory T cells (23). Such information can potentially be further used to predict efficacy of T cell-based vaccines in humans.
2 Material and Methods
2.1 Cytotoxicity in vivo
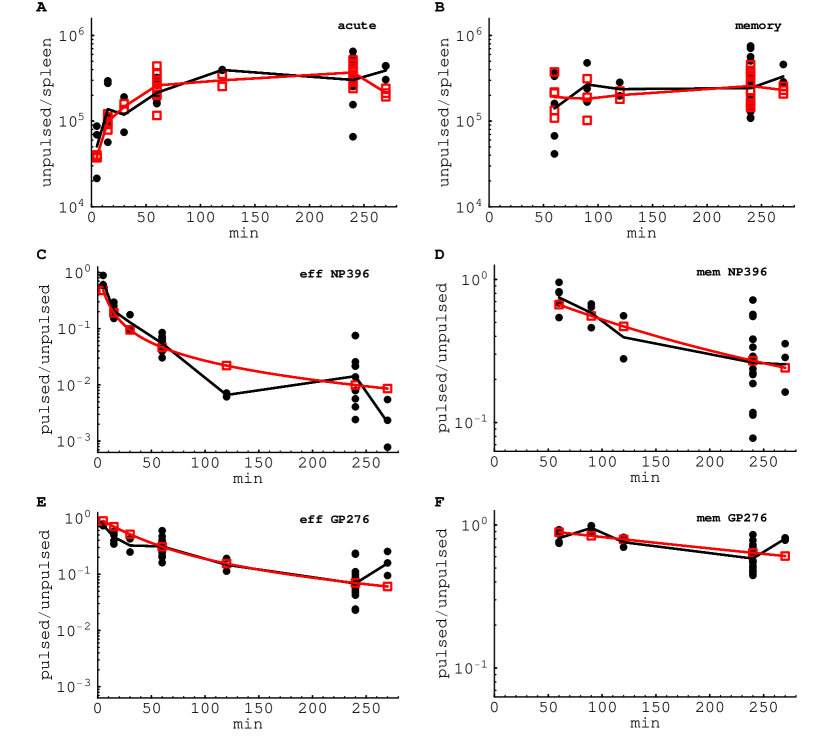
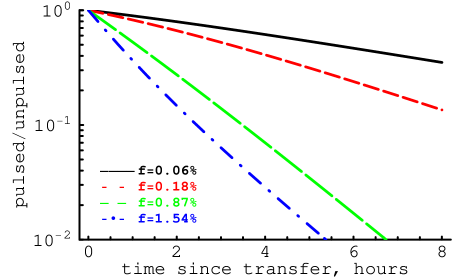
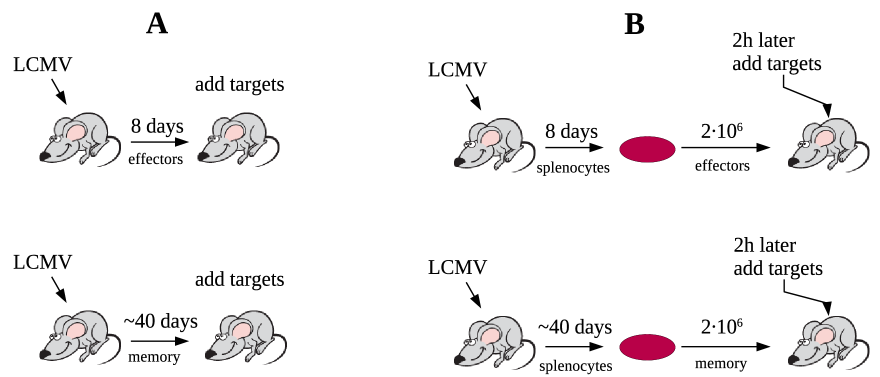
Experimental method of measuring cytotoxicity of CD8+ T cells in vivo has been describes in great detail elsewhere (e.g., (17)). In this report, we analyze recently published data on killing of peptide-pulsed splenocytes by LCMV-specific effector and memory CD8+ T cells (14, & see Figure 1). The reader is referred to the original publication for more detail. In the first set of experiments (“in vivo LCMV infection”), target splenocytes were pulsed with NP396 or GP276 peptides of LCMV (M) or left unpulsed. Targets were subsequently transferred into syngenic mice either infected with LCMV 8 days previously (“acutely infected” mice) or recovered from LCMV infection (LCMV-immune or “memory” mice). At different times after the transfer, spleens were harvested, and the number of pulsed and unpulsed targets, splenocytes, and peptide-specific CD8+T cells was calculated.
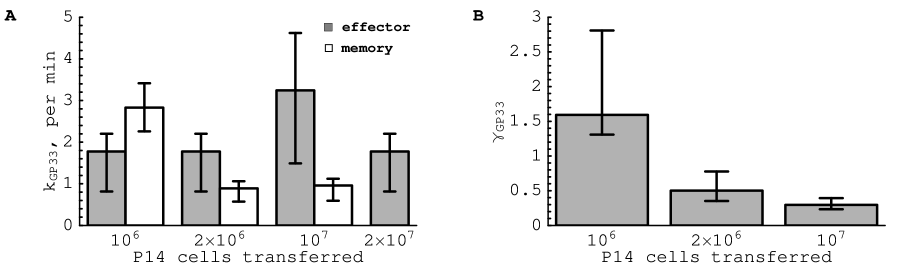
In the second set of experiments (“adoptive transfer”), of P14 CD8+T cells, expressing a TCR specific for the GP33 epitope of LCMV, were adoptively transferred into recipient B6 mice which were then infected i.p. with LCMV-Arm (24). Eight (for effectors) or 40 (for memory T cells) days later, different numbers of P14 CD8+T cells harvested from these mice were transferred into new naive recipients (Figure 1B). The number of effector CD8+T cells transferred into different recipients was , , , and . The number of memory CD8+T cells transferred into different recipients was , , and . Two hours later, two populations of CFSE labeled splenocytes, one of which was pulsed with the GP33 peptide of LCMV (1 M), were transferred into these recipient mice, harboring the transferred GP33-specific effector or memory CD8+T cells. Percent targets killed was calculated at different times after target cell transfer as described earlier (14, 17). The ratio of the frequency of pulsed to unpulsed targets, used in fitting of the data, was calculated as where is the percent of peptide-pulsed targets killed (17, 18).
2.2 Mathematical model for the cytotoxicity in vivo assay
Details of the mathematical model proposed to describe migration of injected targets from the blood to the spleen and killing of peptide-pulsed targets in the spleen are given in great detail elsewhere (18, see also Supplementary Information). In short, target cells injected i.v. migrate from the blood to the spleen at a rate , die at a rate due to preparation techniques (independent of CD8+T cell mediated killing), or migrate to other tissues and/or die elsewhere at a rate . In the spleen, targets die due to preparation-induced death rate , and peptide-pulsed targets also die due to CD8+T cell mediated killing, described by the rate . The dynamics of unpulsed targets and the ratio of the frequency of peptide-pulsed to unpulsed targets in the spleen is given by equations (18)
| (1) | |||||
| (2) |
where is the rate of removal of cells from the blood and is the initial number of unpulsed targets in the blood (14).
We have shown previously that the rate of recruitment of target cells from the blood to the spleen depends on the spleen size (18). Therefore, to describe recruitment of targets into the spleen we let the rate of recruitment be where is the number of splenocytes in the mouse and is a coefficient (18).
In our previous study we estimated the death rate of targets , pulsed with NP396 or GP275 peptides of LCMV, due to killing by the total effector or memory CD8+T cell response (18). To estimate the per capita killing efficacy of CD8+T cells, we have to relate the death rate of peptide pulsed targets to the density of epitope-specific CD8+T cells in the mouse spleen. It is generally assumed that killing of targets follows the law of mass action, that is the death rate of peptide-pulsed targets is proportional to the frequency of peptide-specific CD8+T cells (19, 20). However, spleen tissue has a complicated structure and the assumption of mass-action like encounter of targets and CD8+T cells need not hold. Therefore, here we test several different killing terms in how well they describe the data from the in vivo cytotoxicity assay. In a mass-action model, killing occurs at a rate that is proportional to the frequency of targets and the frequency of epitope-specific CD8+T cells in the spleen of the mouse, i.e., the death rate of peptide-pulsed targets in the mouse due to CD8+T cell mediated killing is
| (3) |
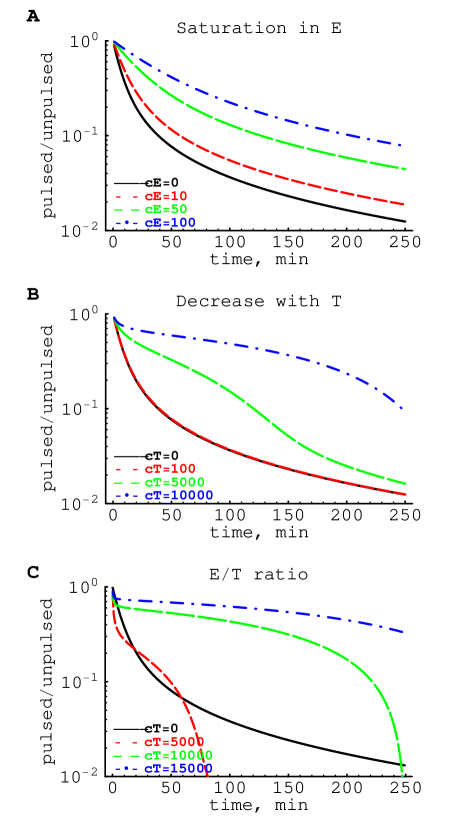
Alternatively, it is possible that the encounter rate between targets and killers does not follow the law of mass-action and is affected by the frequency or the number of CD8+T cells and/or the number of frequency of targets. For example, the death rate of peptide-pulsed targets may saturate with increasing killer frequencies of decrease with increasing target cell frequencies (see Supplementary Information for more detail).
To fit the data on recruitment of targets into the spleen and on killing of peptide-pulsed targets in the spleen at the same time we -transform the data and the model predictions. To access lack of fit of the data with repeated measurements we use the F-test (25, p. 29). To compare nested models we also use the F-test (25, p. 104). Fittings were done in Mathematica 5.2 using the routine FindMinimum.
3 Results
3.1 Killing efficacy of T cells following acute LCMV infection
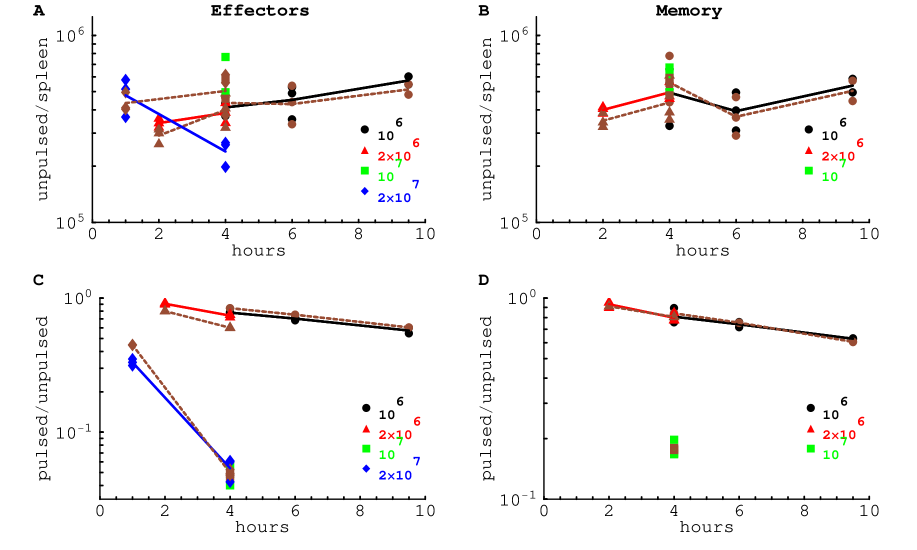
To investigate quantitative aspects of how effector and memory CD8+T cells kill their targets in a mouse spleen we analyze data from recently published experiments on killing of targets pulsed with either NP396, GP276, or GP33 peptides from LCMV by peptide-specific effector or memory CD8+T cells (14). Mice, infected with LCMV-Armstrong develop a vigorous CD8+T cell response that peaks 8 days after the infection (26, 27). By 15-30 days after the infection, most of effectors die and a population of LCMV-specific memory CD8+T cells persists for the life of the animal (27). To measure the efficacy of effector and memory CD8+T cells, target cells pulsed with LCMV-specific peptides (NP396 or GP276) were transferred into mice infected 8 or days previously (14), and the percent of targets killed by effectors or memory CD8+T cells was calculated (see Materials and Methods and Figure 1).
We have previously developed a mathematical model to estimate the killing efficacy of LCMV-specific T cell responses from the data obtained in such in vivo cytotoxicity assay (18). The model describes the most important processes: recruitment of target cells from the blood to the spleen, death of targets due to preparation, and killing of peptide-pulsed targets by the total peptide-specific CD8+T cell response in the spleen (18, see Materials and Methods). From these data we estimated the death rate of peptide-pulsed targets due to killing by the total effector or memory CD8+T cell response (18).
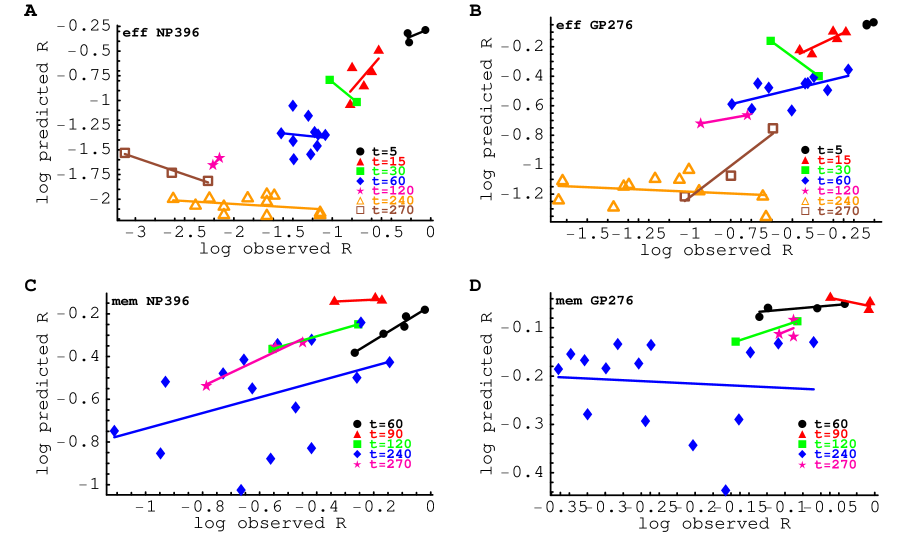
Here we extend this model by allowing different terms for the killing of targets by epitope-specific CD8+T cells (see Materials and Methods). Using the approach of a previous study (19), we first fitted the data from acutely infected and LCMV-immune mice assuming that killing of targets is proportional to the frequency of epitope-specific CD8+T cells in the spleen of a given mouse. Although this model fits the data, the quality of the fit to the data was rather poor (lack of fit test: , ). Assuming that the death rate of peptide-pulsed targets is dependent on the total number of epitope-specific CD8+T cells, rather than their frequency, led to even worse fits of the data (lack of fit test: , ). The reason for the poor fit is that the frequency (or total number) of epitope-specific CD8+T cells measured in an individual mouse predicted poorly killing of targets in the same mouse (Figure S1 in Supplementary Information).
We therefore explored several modifications of the model to improve the fit of the model to the data (see Supplementary Information). The best description of the data was obtained by assuming that killing of targets is determined by the average frequency of NP396- and GP276-specific effector or memory CD8+T cells in the spleen and not values measured in individual mice (lack of fit test: , ; see Table 1 and Figure S2 in Supplementary Information). The good fit of this model to data suggests that variation in the frequency of epitope-specific CD8+T cells measured in different mice is largely due to measurement noise. The absence of a positive correlation between the number of targets killed and the CD8+T cell frequency in a given mouse further supports this conclusion (Figure S3). This analysis suggested that LCMV-specific CD8+T cells are half as efficient as are effector CD8+T cells of the same specificity (Table 1).
Another version of the model in which the death rate of targets due to CD8+T cell killing saturates with increasing T cell frequency (see eqn. (A.10) in Supplementary Information) significantly improved the fit of the model to data (F-test for nested models: , ). This model predicted that memory CD8+T cells are 10 fold less efficient killers than effector T cells of the same specificity (see Supplemental Information). It should be noted, however, that if measurements of CD8+T cell frequencies in individual mice are noisy, saturation in killing with T cell frequency is expected to be important since it allows for smoothing of noisy data.
| Parameter | Mean | 95% CIs | , % | , cells | cell type | |
|---|---|---|---|---|---|---|
| 0.49 | ||||||
| 5.50 | 2471 | 6.3 | 10.4 | NP396-spec effectors | ||
| 2.35 | 130 | 2.1 | 3.6 | GP276-spec effectors | ||
| 2.68 | 4.9 | 0.54 | 0.32 | NP396-spec memory | ||
| 1.14 | 1.5 | 0.35 | 0.21 | GP276-spec memory |
3.2 Killing efficacy of T cells following adoptive transfer of T cells
Thus, we generated two alternative models that provided a good description of the data but generated highly distinct predictions on the efficiency and nature of killing of targets in the mouse spleen. To discriminate between these alternative models we analyzed novel data from additional experiments involving transfer of different numbers of effector or memory CD8+T cells specific to the GP33 epitope of LCMV (14, see Figure 1B). Two hours after transfer of CD8+T cells, GP33-pulsed and unpulsed target cells were transferred into mice harboring GP33-specific CD8+T cells, and killing of peptide-pulsed targets was measured longitudinally (14, Figure 2). Approximately 2 to 10% of the adoptively transferred CD8+T cells accumulated in the mouse spleen (Table 2). Since the transfer of different numbers of epitope-specific CD8+T cells led to different frequencies of these cells in the spleen as well as to different effector to target ratios (Table 2), these data allowed for a unique opportunity to investigate whether the per capita killing efficacy of LCMV-specific effector and memory CD8+T cells is independent of these two quantities.
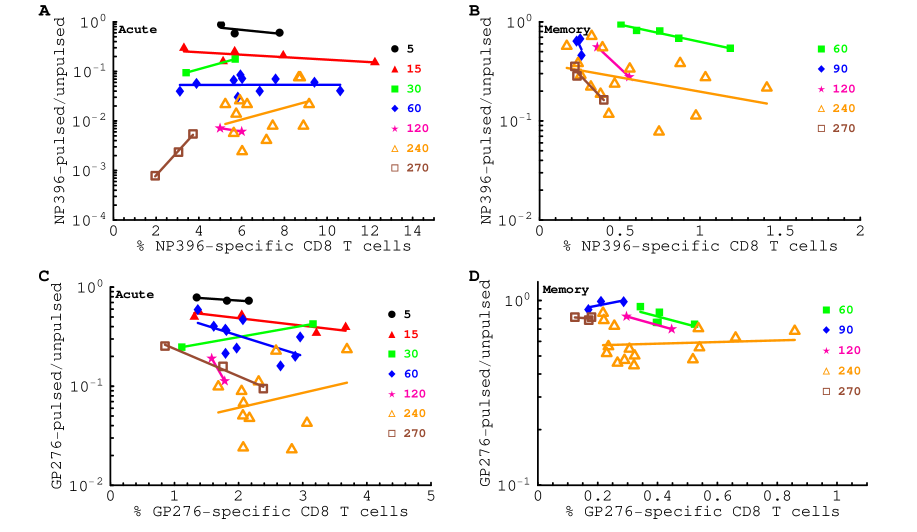
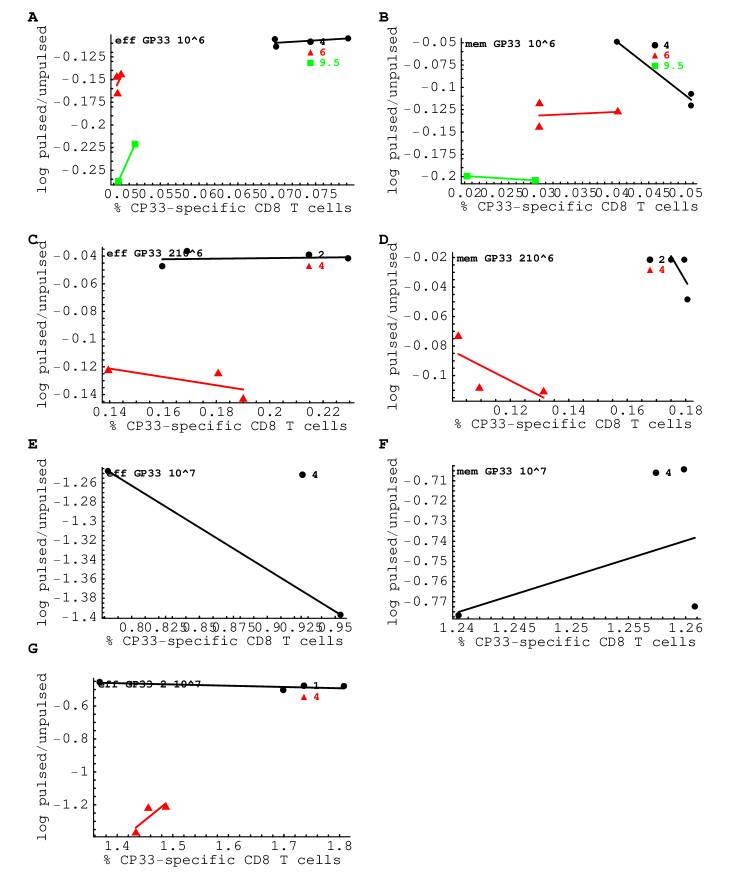
Therefore, we fitted the mathematical model given in eqn. (1)-(2) to these data assuming that the death rate of peptide-pulsed targets depends on the average frequency of GP33-specific CD8+T cells in the spleen (i.e., killing follows the law of mass action). The model described the data very well with the exception of one time point with very few unpulsed targets being recruited into the spleen (Figure 2A at effector CD8+T cell transferred; lack of fit test with this time point removed: , ). By fitting the model, we estimated parameters determining the rate of migration of targets from the blood to the spleen as well as the per capita killing efficacy of GP33-specific effector (given by ) and memory (given ) CD8+T cells, at different frequencies of effectors of memory CD8+T cells in the spleen (Table 2 and Figure 3). Surprisingly, the model fits predicted that the per capita killing efficacy of effector CD8+T cells was largely independent of the frequency of effectors in the spleen equaling on average . Most importantly, this estimate is almost identical to the estimate of the killing efficacy of GP276-specific effectors obtained above by fitting the data from acute LCMV infection using the average frequency of epitope-specific CD8+T cells in the spleen (see Table 1). Thus, this analysis suggests that changing the frequency of epitope-specific CD8+T cells in the mouse spleen from (transfer of GP33-specific effectors, see Table 2) to (GP276-) or (NP396-specific effectors, see Table 1) does not affect the per capita killing efficacy of LCMV-specific effector CD8+T cells. In other words, this implies that killing of targets in the mouse spleen by effector CD8+T cells follows the law of mass action where the rate of killing is proportional to the frequency of epitope-specific CD8+T cells. This conclusion was further confirmed by the lack of improvement of the data fit with the model assuming saturation in the death rate of peptide-pulsed targets with CTL frequency (F-test for nested models: , ). Thus, for LCMV-specific effectors, the correct model is the one in which killing of targets is simply proportional to the average frequency of CTLs in the spleen.
In contrast with effectors, we estimated that the per capita killing efficacy of memory CD8+T cells declines with an increasing number of memory T cell transferred (Table 2 and Figure 3). The killing efficacy of memory CD8+T cells was somewhat higher than that of effectors at the lowest number of epitope-specific CD8+T cell transferred, and lower when larger numbers of memory T cells were transferred (Figure 3). This suggests that the death rate of peptide-pulsed targets due to killing by memory CD8+T cells saturates as the function of the frequency of CD8+T cells (or the effector to target ratio) in the mouse spleen. Including saturation in the death rate of targets with memory CD8+T cell frequency (see eqn. (A.10)) significantly improved the quality of the model fit to data on killing of peptide-pulsed targets by NP396- and GP276-specific memory CD8+T cells (F-test for nested models: , ). These fits also predicted that at low T cell frequencies, memory T cells are at least as efficient as effectors of the same specificity (for memory CD8+T cells assuming saturation in killing: , , ; compare these estimates to the killing efficacy of effectors given in Table 1), confirming the result from the adoptive transfer experiment. Moreover, the estimated saturation constant implies that killing efficacy of memory T cells is reduced by half at the cell frequency equal which is again observed in both following LCMV infection (Table 1) and after adoptive transfer of GP33-specific memory T cells (Table 2). Thus, these results suggest that the death rate of peptide-pulsed targets saturates with increasing the frequency of memory CD8+T cells in the mouse spleen.
Assuming that the death rate of peptide-pulsed targets is proportional to the total number of epitope-specific CD8+T cells in the mouse spleen, we found that following acute LCMV infection effector and memory CD8+T cells have a similar per capita killing efficacy (results not shown). This is contrast to the result obtained from the adoptive transfer experiments where at frequencies of epitope-specific effector and memory CD8+T cells in the spleen of , memory T cells are only 30% to 50% as efficient as effectors. This suggests that killing targets in the spleen is proportional to the frequency, and not the total number of epitope-specific CD8+T cells confirming a previously made assumption (19, 20).
| Parameter | Mean | 95% CIs | , % | , cells | Cells transferred | |
| 2.14 | 1.88–6.16 | |||||
| 1.1 | 0.4–1.6 | |||||
| 1.0 | 0.7–4.3 | |||||
| 1.77 | 0.91–2.12 | 0.14 | 0.06 | 0.05 | ||
| 3.26 | 2.54–3.83 | 0.09 | 0.04 | 0.03 | ||
| 1.77 | 0.91–2.12 | 0.34 | 0.18 | 0.10 | ||
| 0.98 | 0.54–1.22 | 0.25 | 0.15 | 0.09 | ||
| 3.08 | 1.6–3.9 | 23.7 | 0.87 | 0.68 | ||
| 0.93 | 0.61–1.07 | 9.48 | 1.25 | 1.05 | ||
| 1.77 | 0.91–2.12 | 44.4 | 1.54 | 1.43 |
4 Discussion
Recent interest in T cell based vaccines against several chronic infections of humans requires the development of experimental and theoretical tools to access the efficacy of such vaccines (29, 30). It is generally believed that memory CD8+T cells induced by vaccination are not able to provide sterilizing immunity, because T cells react only to infected cells, i.e., after the infection has been established. However, a recent study has shown an example where generation of a large population of memory CD8+T cells by vaccination in mice did provide sterilizing immunity against malaria (21).
Quantitative approaches aimed at estimating the in vivo efficacy of effector and memory CD8+T cells, and at quantitative details of how CD8+T cells control growth of pathogens are necessary to understand how protection induced by T cell-based vaccines is achieved. This study utilized a recently developed experimental technique of in vivo cytotoxicity to investigate how effector and memory CD8+T cells, specific to LCMV, kill peptide-pulsed targets in the mouse spleen. Using a novel mathematical model we have analyzed data from experiments on in vivo killing of targets following LCMV infection of mice and experiments involving adoptive transfer of different numbers of LCMV-specific effector or memory CD8+T cells. Results of our analysis suggest that death rate of targets due to LCMV-specific effectors is simply proportional to the average frequency of epitope-specific CD8+T cells in the mouse spleen. This is a rather surprising result. Even for frequencies of LCMV-specific effectors in the spleen ranging over 100 fold from 0.06% to 6%, we find no evidence in saturation in the death rate of peptide-pulsed targets with CD8+T cell frequency. This in turn suggests that killing of targets by CTLs follows the law of mass action (31) and that CTLs do not compete for access to targets at least when their frequency in the spleen is as high as 6%.
We found that killing of targets is dependent on the frequency of epitope-specific CD8+T cells in the spleen and not their total number. This has important implications for vaccination since this suggests that inducing high numbers of virus-specific CD8+T cells may not be highly advantageous if their frequency in tissues is low. The observation that the death rate of peptide-pulsed targets is mainly determined by the average frequency of epitope-specific CTLs suggests that a large variation in the frequency of CD8+T cells in the spleen, as measured in individual mice, represents measurement noise.
We found that at low CD8+T cell frequencies, memory CD8+T cells are at least as efficient at killing peptide-pulsed targets as are effector CD8+T cells. This contradicts the widely accepted view that memory CD8+T cells, especially those residing in lymphoid tissues, are not very efficient killers and generally require restimulation to exhibit cytotoxicity (32). Our study as well as the original work of Barber et al. (14) illustrates the limitation of the in vitro chromium release assay to assess cytotoxic efficacy of memory CD8+T cells.
We also found that at high frequencies (e.g., following acute LCMV infection), LCMV-specific memory T cells are only half as efficient as are effector CD8+T cells of the same specificity. The reduction in the killing efficacy of memory CD8+T cells with increasing their frequency may limit the overall efficacy of T cell-based vaccines, since boosting the frequency of memory T cells may not lead to a proportional increase in the efficacy of the memory T cell response. Different efficacies of effector and memory CD8+T cells following LCMV infection may be due to different localization of these two subsets in the spleen. A recent study suggests that LCMV-specific effectors localize mainly in the red pulp, while memory CD8+T cells reside in the T cell zones of the white pulp of the mouse spleen (33). Since white pulp occupies the minority of the space in the spleen (5-20%, (34)), memory CD8+T cells indeed are expected to compete for the access to targets if their density in the white pulp is high. However, additional studies addressing the question of localization of target cells in the mouse spleen are needed to investigate this issue further.
We found that NP396-specific effector CD8+T cells present at the peak of the immune response have a per capita killing efficacy . This value has a simple interpretation as the death rate of targets when the frequency of CTLs in the spleen is close to 1. For example, if most of splenocytes were NP396-specific CD8+T cells, NP396-pulsed targets would have a half-life of seconds in the spleen. Another interesting parameter that can be calculated from our study is the number of targets killed by one CTL per unit of time. In an extreme situation where all splenocytes are targets for a single CTL a NP396-specific CTL is expected to kill targets per minute (or targets per day). In our experiments, the number of targets was generally much smaller than the number of splenocytes, and since the number of targets killed per day per CTL depends on the number of targets, we previously estimated that following LCMV infection, CTLs kill only a few targets per day at these high effector to target ratios (18).
The time taken by a CTL to kill its target is a sum of the time required by a CTL to find its target and the time to deliver the lethal hit. By assuming that the rate of killing of peptide-pulsed targets is limited mainly by the time required by an effector T cell to find its target, we calculated an approximate upper bound estimate for the killing efficacy of T cells. Given the estimated motility of activated T cells in lymph nodes and the size of targets, the maximum killing efficacy of CD8+T cells is , although this value does depend on the several parameters that have not been measured in our experiments (see Supplementary Information). Since the estimated killing efficacy of effector T cells is much lower than this value, our result suggests that the main limiting step of killing of peptide-pulsed targets is the actual process of killing, and not finding the target. This is consistent with a recent study on imaging of killing of B cells by effector CD8+T cells where the process of killing of targets took 10 to 20 minutes (7). The observation that killing efficacy of effector CD8+T cells is the same at low and high effector frequencies in the spleen also suggests that finding the target is not the limiting step in the killing process.
Effector CD8+T cells, specific to two other epitopes of LCMV, are estimated to have a lower killing efficacy (, ). Since we do not expect these cells to behave differently from NP396-specific effectors, a lower killing efficacy of GP276- and GP33-specific CD8+T cells is likely because of longer times required by effectors to kill their targets. This may arise because of the reduced affinity of T cell receptors, specific to these peptides, to their ligands or a shorter half-life time of peptide-MHC complexes on target cells.
Reduced killing efficacy of memory CD8+T cells as compared to effectors of the same specificity is expected as memory T cells generally express low levels of molecules such as perforin, granzymes, and FasL that are required for mediating cytotoxicity (14). Even though memory CD8+T cells may have a reduced motility in lymphoid tissues as compared to activated, effector T cells, this is an unlikely reason for their reduced killing efficacy. We have found that at low T cell frequencies GP33-specific memory CD8 T cells are at least as efficient killers as are effectors. This may imply that high levels of granzymes and perforin that are expressed by effector CD8+T cells are not required for high degree of cytotoxicity in vivo .
Our results have important implication for the loss of protection by memory CD8+T cells. It has been suggested that infection with new pathogens leads to attrition (loss) of memory CD8+T cells specific to previously encountered pathogens (35, 36, 37, 38). A recent study has challenged this conclusion by showing that infection of mice with Vesicular stomatitis virus (VSV) and Vaccinia virus (VV) can also lead to an increase in the total number of memory T cells, and as the result, to a very moderate loss of the total number of memory CD8+T cells, specific to previously encountered virus (LCMV), in the spleen (39). However, this study has also shown a dramatic reduction in the frequency of LCMV-specific memory CD8+T cells in the spleen and in peripheral tissues following infection with VSV and VV. Our results suggest that reduction in the frequency of virus-specific memory CD8+T cells may have a dramatic affect on the efficacy of the memory response even if the total number of virus-specific CD8+T cells is not dramatically reduced. Reduction in the cytotoxic efficacy of Vaccinia virus- or Pichindie virus-specific memory CD8+T cell responses has indeed been observed after exposure to LCMV (40, 38).
Our results suggest a simple procedure of estimating the frequency of memory CD8+T cells at which T cells may provide sterilizing immunity upon re-exposure to a virus. From a simple equation governing the growth of the virus , this frequency of memory CD8+T cells is given by the ratio where is the rate of replication of the virus, is the killing efficacy of memory CD8+T cells, and is the half-saturation constant. For a virus such as LCMV that doubles its population size in hours (41, 42, 43), the protective frequency of memory CD8+T cells which have a killing efficacy is of all splenocytes. This is below the level of memory CD8+T cells induced by vaccination with LCMV-Armstrong (see Table 1), suggesting that LCMV-immune mice should be protected following infection with other strains of LCMV even in the absence of LCMV-specific antibodies. Future studies will be necessary to address this quantitative prediction.
Our study may provide practical guidelines for estimating the efficacy of T cell based vaccines. It has been recently shown that cytotoxic potential of HIV-specific CD8+T cells may be one of the most important components of effective control of viral growth (44). Because of practical difficulties in performing in vivo cytotoxicity assay in humans, it would be interesting to correlate the in vivo killing efficacy of murine CD8+T cells with their phenotype measured ex vivo by flow cytometry (e.g., cell surface and intra-cellular markers). This may allow for quantitative understanding of what constitutes an effective memory T cell; this understanding can be further applied to compare efficacy of T cell-based vaccines in humans.
In our analysis, we used the ratio of the frequency of peptide-pulsed to unpulsed targets as a measure of killing. It has been shown previously that the ratio is indeed a less biased estimator than, for example, the frequency of peptide-pulsed targets in the spleen (20). The use of the ratio, however, precludes the analysis of whether killing of targets depends on the total number of targets or their frequency in the spleen. Addressing this question will be explored elsewhere. We have investigated quantitative aspects of killing of peptide-pulsed targets in the spleen. It would be important to investigate if killing of virally infected cells and/or targets in other organs such as the lung or the gut follows the same principle. Including these processes may require the use of more sophisticated mathematical models, and as such will hopefully lead to more collaborations between experimentalists and theoreticians.
Acknowledgments
We thank Joost Beltman, John Wherry, Andrew Yates, Anton Zilman, Ruy Ribeiro and Alan Perelson for comments and suggestions during this work. This work was supported by the VICI grant 016.048.603 from NWO, Marie Curie Incoming International Fellowship (FP6), and the U.S. Department of Energy through the LANL/LDRD Program.
References
- Pantaleo and Koup (2004) Pantaleo, G. and R.A. Koup. 2004. Correlates of immune protection in HIV-1 infection: what we know, what we don’t know, what we should know. Nat Med 10: 806–10.
- Plotkin (2008) Plotkin, S. A. 2008. Vaccines: correlates of vaccine-induced immunity. Clin Infect Dis 47: 401–9.
- Darrah et al. (2007) Darrah, P.A., D.T. Patel, P.M. De Luca, R.W. Lindsay, D.F. Davey, B.J. Flynn, S.T. Hoff, P. Andersen, S.G. Reed, S.L. Morris, M. Roederer, and R.A. Seder. 2007. Multifunctional TH1 cells define a correlate of vaccine-mediated protection against Leishmania major. Nat Med 13: 843–50.
- Liu et al. (2009) Liu, J., K. L. O’Brien, D. M. Lynch, N. L. Simmons, A. La Porte, A. M. Riggs, P. Abbink, R. T. Coffey, L. E. Grandpre, M. S. Seaman, G. Landucci, D. N. Forthal, D. C. Montefiori, A. Carville, K. G. Mansfield, M. J. Havenga, M. G. Pau, J. Goudsmit, and D. H. Barouch. 2009. Immune control of an SIV challenge by a T-cell-based vaccine in rhesus monkeys. Nature 457: 87–91.
- Rehr et al. (2008) Rehr, M., J. Cahenzli, A. Haas, D.A. Price, E. Gostick, M. Huber, U. Karrer, and A. Oxenius. 2008. Emergence of polyfunctional CD8+ T cells after prolonged suppression of human immunodeficiency virus replication by antiretroviral therapy. J Virol 82: 3391–404.
- Streeck et al. (2008) Streeck, H., Z. L. Brumme, M. Anastario, K. W. Cohen, J. S. Jolin, A. Meier, C. J. Brumme, E. S. Rosenberg, G. Alter, T. M. Allen, B. D. Walker, and M. Altfeld. 2008. Antigen load and viral sequence diversification determine the functional profile of HIV-1-specific CD8+ T cells. PLoS Med 5: e100.
- Mempel et al. (2006) Mempel, T.R., M.J. Pittet, K. Khazaie, W. Weninger, R. Weissleder, H. von Boehmer, and U.H. von Andrian. 2006. Regulatory T cells reversibly suppress cytotoxic T cell function independent of effector differentiation. Immunity 25: 129–41.
- Aichele et al. (1997) Aichele, P., K. Brduscha-Riem, S. Oehen, B. Odermatt, R.M. Zinkernagel, H. Hengartner, and H. Pircher. 1997. Peptide antigen treatment of naive and virus-immune mice: antigen-specific tolerance versus immunopathology. Immunity 6: 519–29.
- Oehen and Brduscha-Riem (1998) Oehen, S. and K. Brduscha-Riem. 1998. Differentiation of naive CTL to effector and memory CTL: correlation of effector function with phenotype and cell division J Immunol 161: 5338–46.
- Barchet et al. (2000) Barchet, W., S. Oehen, P. Klenerman, D. Wodarz, G. Bocharov, A. L. Lloyd, M. A. Nowak, H. Hengartner, R. M. Zinkernagel, and S. Ehl. 2000. Direct quantitation of rapid elimination of viral antigen-positive lymphocytes by antiviral CD8(+) T cells in vivo Eur J Immunol 30: 1356–63.
- Mueller et al. (2002) Mueller, S.N., C.M. Jones, C.M. Smith, W.R. Heath, and F.R. Carbone. 2002. Rapid cytotoxic T lymphocyte activation occurs in the draining lymph nodes after cutaneous herpes simplex virus infection as a result of early antigen presentation and not the presence of virus. J Exp Med 195: 651–6.
- Coles et al. (2002) Coles, R.M., S.N. Mueller, W.R. Heath, F.R. Carbone, and A.G. Brooks. 2002. Progression of armed CTL from draining lymph node to spleen shortly after localized infection with herpes simplex virus 1. J Immunol 168: 834–8.
- Byers et al. (2003) Byers, A.M., C.C. Kemball, J.M. Moser, and A.E. Lukacher. 2003. Cutting edge: rapid in vivo CTL activity by polyoma virus-specific effector and memory CD8+ T cells. J Immunol 171: 17–21.
- Barber et al. (2003) Barber, D.L., E.J. Wherry, and R. Ahmed. 2003. Cutting edge: rapid in vivo killing by memory CD8 T cells. J Immunol 171: 27–31.
- Curtsinger et al. (2003) Curtsinger, J.M., D.C. Lins, and M.F. Mescher. 2003. Signal 3 determines tolerance versus full activation of naive CD8 T cells: dissociating proliferation and development of effector function. J Exp Med 197: 1141–51.
- Hermans et al. (2004) Hermans, I.F., J.D. Silk, J. Yang, M.J. Palmowski, U. Gileadi, C. McCarthy, M. Salio, F. Ronchese, and V. Cerundolo. 2004. The VITAL assay: a versatile fluorometric technique for assessing CTL- and NKT-mediated cytotoxicity against multiple targets in vitro and in vivo. J Immunol Methods 285: 25–40.
- Ingulli (2007) Ingulli, E. 2007. Tracing Tolerance and Immunity In Vivo by CFSE-Labeling of Administered Cells. Methods Mol Biol 380: 365–76.
- Ganusov and De Boer (2008) Ganusov, V. V. and R. J. De Boer. 2008. Estimating in vivo death rates of targets due to CD8 T-cell-mediated killing. J Virol 82: 11749–57.
- Regoes et al. (2007) Regoes, R.R., D.L. Barber, R. Ahmed, and R. Antia. 2007. Estimation of the rate of killing by cytotoxic T lymphocytes in vivo. Proc Natl Acad Sci U S A 104: 1599–603.
- Yates et al. (2007) Yates, A., F. Graw, D. L. Barber, R. Ahmed, R. R. Regoes, and R. Antia. 2007. Revisiting Estimates of CTL Killing Rates In Vivo. PLoS ONE 2: e1301.
- Schmidt et al. (2008) Schmidt, N. W., R. L. Podyminogin, N. S. Butler, V. P. Badovinac, B. J. Tucker, K. S. Bahjat, P. Lauer, A. Reyes-Sandoval, C. L. Hutchings, A. C. Moore, S. C. Gilbert, A. V. Hill, L. C. Bartholomay, and J. T. Harty. 2008. Memory CD8 T cell responses exceeding a large but definable threshold provide long-term immunity to malaria. Proc Natl Acad Sci U S A 105: 14017–22.
- Hansen et al. (2009) Hansen, S.G., C. Vieville, N. Whizin, L. Coyne-Johnson, D.C. Siess, D.D. Drummond, A.W. Legasse, M.K. Axthelm, K. Oswald, C.M. Trubey, M. Piatak, Jr, J.D. Lifson, J.A. Nelson, M.A. Jarvis, and L.J. Picker. 2009. Effector memory T cell responses are associated with protection of rhesus monkeys from mucosal simian immunodeficiency virus challenge. Nat Med 15: 293–9.
- Harari et al. (2006) Harari, A., V. Dutoit, C. Cellerai, P. A. Bart, R. A. Du Pasquier, and G. Pantaleo. 2006. Functional signatures of protective antiviral T-cell immunity in human virus infections. Immunol Rev 211: 236–54.
- Kaech and Ahmed (2001) Kaech, S. M. and R. Ahmed. 2001. Memory CD8+ T cell differentiation: initial antigen encounter triggers a developmental program in naive cells Nat Immunol 2: 415–22.
- Bates and Watts (1988) Bates, D. M. and D. G. Watts. 1988. Nonlinear regression analysis and its applications. John Wiles & Sons, Inc. 365 .
- Murali-Krishna et al. (1998) Murali-Krishna, K., J.D. Altman, M. Suresh, D.J.D. Sourdive, A.J. Zajac, J.D. Miller, J. Slansky, and R. Ahmed. 1998. Counting antigen-specific CD8+ T cells: A re-evaluation of bystander actiation during viral infection Immunity 8: 177–187.
- Homann et al. (2001) Homann, D., L. Teyton, and M.B. Oldstone. 2001. Differential regulation of antiviral T-cell immunity results in stable CD8+ but declining CD4+ T-cell memory. Nat Med 7: 913–919.
- Efron and Tibshirani (1993) Efron, B. and R. Tibshirani. 1993. An introduction to the bootstrap Chapman & Hall, New York 436 .
- Sekaly (2008) Sekaly, R.P. 2008. The failed HIV Merck vaccine study: a step back or a launching point for future vaccine development? J Exp Med 205: 7–12.
- De Boer (2007) De Boer, R.J. 2007. Understanding the failure of CD8+ T-cell vaccination against simian/human immunodeficiency virus. J Virol 81: 2838–48.
- Chandrasekhar (1943) Chandrasekhar, S. 1943. Stochastic problems in physics and astronomy Rev. Mod. Phys. 15: 1–89.
- Masopust et al. (2001) Masopust, D., V. Vezys, A. L. Marzo, and L. Lefrançois. 2001. Preferential localization of effector memory cells in nonlymphoid tissue Science 291: 2413–7.
- Dauner et al. (2008) Dauner, J.G., I.R. Williams, and J. Jacob. 2008. Differential microenvironment localization of effector and memory CD8 T cells. J Immunol 180: 291–9.
- Freitas (2003) Freitas, R.A. 2003. Nanomedicine Landes Biosciences www.nanomedicine.com.
- Selin et al. (1999) Selin, L. K., M. Y. Lin, K. A. Kraemer, D. M. Pardoll, J. P. Schneck, S. M. Varga, P. A. Santolucito, A. K. Pinto, and R. M. Welsh. 1999. Attrition of T cell memory: selective loss of LCMV epitope-specific memory CD8 T cells following infections with heterologous viruses [In Process Citation] Immunity 11: 733–42.
- Antia et al. (1998) Antia, R., S.S. Pilyugin, and R. Ahmed. 1998. Models of immune memory: on the role of cross-reactive stimulation, competition, and homeostasis in maintaining immune memory. Proc Natl Acad Sci USA 95: 14926–14931.
- Ganusov and De Boer (2006) Ganusov, V.V. and R.J. De Boer. 2006. Estimating Costs and Benefits of CTL Escape Mutations in SIV/HIV Infection. PLoS Comput Biol 2: e24.
- Welsh and Selin (2009) Welsh, R. M. and L. K. Selin. 2009. Attrition of memory cd8 t cells. Nature Under review.
- Vezys et al. (2008) Vezys, V., A. Yates, K. A. Casey, G. Lanier, R. Ahmed, R. Antia, and D. Masopust. 2008. Memory CD8 T-cell compartment grows in size with immunological experience. Nature .
- Kim and Welsh (2004) Kim, S.K. and R.M. Welsh. 2004. Comprehensive early and lasting loss of memory CD8 T cells and functional memory during acute and persistent viral infections. J Immunol 172: 3139–50.
- Ehl et al. (1997) Ehl, S., P. Klenerman, P. Aichele, H. Hengartner, and R.M. Zinkernagel. 1997. A functional and kinetic comparison of antiviral effector and memory cytotoxic T lymphocyte populations in vivo and in vitro. Eur J Immunol 27: 3404–13.
- Bocharov et al. (2004) Bocharov, G., B. Ludewig, A. Bertoletti, P. Klenerman, T. Junt, P. Krebs, T. Luzyanina, C. Fraser, and R.M. Anderson. 2004. Underwhelming the immune response: effect of slow virus growth on CD8+-T-lymphocyte responses. J Virol 78: 2247–54.
- Althaus et al. (2007) Althaus, C.L., V.V. Ganusov, and R.J. De Boer. 2007. Dynamics of CD8+ T cell responses during acute and chronic lymphocytic choriomeningitis virus infection. J Immunol 179: 2944–51.
- Migueles et al. (2008) Migueles, S. A., C. M. Osborne, C. Royce, A. A. Compton, R. P. Joshi, K. A. Weeks, J. E. Rood, A. M. Berkley, J. B. Sacha, N. A. Cogliano-Shutta, M. Lloyd, G. Roby, R. Kwan, M. McLaughlin, S. Stallings, C. Rehm, M. A. O’Shea, J. Mican, B. Z. Packard, A. Komoriya, S. Palmer, A. P. Wiegand, F. Maldarelli, J. M. Coffin, J. W. Mellors, C. W. Hallahan, D. A. Follman, and M. Connors. 2008. Lytic Granule Loading of CD8(+) T Cells Is Required for HIV-Infected Cell Elimination Associated with Immune Control. Immunity 29: 1009–21.
- Borghans et al. (1996) Borghans, J.A., R.J. de Boer, and L.A. Segel. 1996. Extending the quasi-steady state approximation by changing variables. Bull Math Biol 58: 43–63.
- Merrill (1982) Merrill, S. J. 1982. Foundations of the use of an enzyme-kinetic analogy in cell-mediated cytotoxicity Math Bio 62: 219–35.
- Abrams and Ginzburg (2000) Abrams, P.A. and L.R. Ginzburg. 2000. The nature of predation: prey dependent, ratio dependent or neither? Trends Ecol Evol 15: 337–341.
- Layne et al. (1989) Layne, S. P., J. L. Spouge, and M. Dembo. 1989. Quantifying the infectivity of human immunodeficiency virus. Proc Natl Acad Sci U S A 86: 4644–8.
- Perelson et al. (1993) Perelson, A.S., D.E. Kirschner, and R. De Boer. 1993. Dynamics of HIV infection of CD4+ T cells. Math Biosci 114: 81–125.
- Miller et al. (2003) Miller, M.J., S.H. Wei, M.D. Cahalan, and I. Parker. 2003. Autonomous T cell trafficking examined in vivo with intravital two-photon microscopy. Proc Natl Acad Sci U S A 100: 2604–9.
- Miller et al. (2004) Miller, M.J., O. Safrina, I. Parker, and M.D. Cahalan. 2004. Imaging the single cell dynamics of CD4+ T cell activation by dendritic cells in lymph nodes. J Exp Med 200: 847–856.
- Miller et al. (2002) Miller, M.J., S.H. Wei, I. Parker, and M.D. Cahalan. 2002. Two-photon imaging of lymphocyte motility and antigen response in intact lymph node. Science 296: 1869–73.
- Goldsby et al. (2002) Goldsby, R. A., T. J. Kindt, B.A. Osborne, and J. Kuby. 2002. Immunology, 4th edition W. H. Freeman.
5 Supplementary Information
5.1 Mathematical model for estimating the killing efficacy of CD8+T cell responses
The dynamics of unpulsed and peptide-pulsed targets in the blood and in the spleen are given by equations
| (A.1) | |||||
| (A.2) | |||||
| (A.3) | |||||
| (A.4) |
where and are the numbers of unpulsed and peptide-pulsed target cells in the blood, respectively, and and is the number of unpulsed and pulsed targets in the spleen, respectively, is the rate of migration of target cells from the blood into the spleen, and is the rate of cell migration/death from blood to other organs, is the extra death rate of transferred splenocytes due to preparation (independent of epitope-specific CD8+T cells), and is the death rate of peptide-pulsed targets due to CD8+T cell mediated killing in the spleen. For our experiments, the initial conditions for the model are cells and (14). In the case when all model parameters, including the death rate of targets due to CD8+T cell mediated killing, are independent of time, the model can be solved analytically (18); and the particular solution for is shown in eqn. (1) and (2).
5.2 Deriving the general killing term
In tissues, CD8+T cells scan many cells to find virus-infected targets, and many of the cells scanned are uninfected (7). Scanning uninfected cells also takes some time (7), and if the majority of cells in a tissue is uninfected, a CD8+T cell can spend a substantial amount of time “looking” for the infected targets. The process of scanning of uninfected targets and killing peptide-expressing targets can described mathematically to enzyme kinetics (e.g., (45)). We let , , and be the number of killer CD8+T cells, uninfected (bystander) and peptide-expressing targets, respectively. Effector CD8+T cells by scanning uninfected targets form a complex , and form a complex when they scan infected cells. Both complexes can dissociate. The kinetic diagram of cell interactions is then (46)
| (A.5) | |||||
| (A.6) |
where and are the rates for binding and dissociation of a killer T cell and peptide-expressing cell; is the dissociation rate of a complex of a killer T cell and a bystander (uninfected) cell; is the dissociation rate of the complex of killer T cell and an infected cell resulting in the death of the infected cell (denoted as ). The rate of removal of pulsed targets is then simply . Making a quasi-steady state assumption for and , we obtain
| (A.7) | |||||
| (A.8) |
where and . If the number of killers is much larger than the number of target (i.e., , where is the total number of killer T cells), then rewriting eqn. (A.7) and (A.8) in terms of the total number of unpulsed and pulsed targets, , and , respectively, after simple algebra for the complex we find
| (A.9) |
This suggests that the death rate of peptide-pulsed targets, , saturates at high numbers of killer CD8+T cells approaching the rate of dissociation of the complex . Then the death rate of targets is given by
| (A.10) |
where is the inverse frequency of CD8+T cells at which killing is half maximal.
Similarly, if the number of pulsed targets is much larger than the number of killers , then rewriting eqn. (A.7) and (A.8) in terms of the total number of killer CD8+T cells, , we find
| (A.11) |
where and are defined above. This expression shows that 1) the death rate of peptide-pulsed targets, , may decrease at high numbers of targets, and 2) if the number of bystander (unpulsed) targets is high, , the killing of targets depends on the frequency of effectors in the spleen, , and not on their absolute number. Simplifying eqn. (A.11) by letting we obtain
| (A.12) |
where is the inverse frequency of pulsed targets at which killing is half maximal.
Finally, the death rate of a single target may depend on the effector to target ratio, (47). Then assuming saturation in the death rate with the ratio of effectors to targets, we obtain
| (A.13) |
Note that in those cases, when the death rate of targets due to CD8+T cell mediated killing depends on the target cell density (, see eqn. (A.12) and (A.13)), eqn. (2) is not the correct solution. Instead, we numerically solve the model given by differential equations (see Supplementary Information) and fit the numerical solution of the model to data.
5.3 Deriving the killing rate constant
Based on the assumption that the speed of a chemical reaction may be limited by rate at which chemicals are colliding, it has been derived from basic physical principles how the rate of reaction depends on the properties of interacting chemicals (31). Similar approaches have been applied in biology to model infection of target cells by a virus (48, 49). Bearing on these studies, killing of peptide-pulsed target cells by peptide-specific CD8+T cells can described by a simple diagram
| (A.14) |
with the kinetics of target cells given simply as
| (A.15) |
Note that in eqn. (A.15), and are given as cell concentrations in the spleen (i.e., number of cells per unit of volume). From a fundamental result of Smoluchowski (31), the rate of the reaction is given by
| (A.16) |
where and are the diffusion (or motility) coefficients of effectors and targets, respectively, and and are radii of the cells. The rate needs to be converted to be comparable with the killing efficacy that we have estimated from the data (see Table 1 and 2). Because in eqn. (A.15), concentration of effectors is given as cells/volume, converting the cell concentration to the frequency of cells in the spleen yields
| (A.17) |
where is the number of splenocytes and is the volume of the spleen. Since spleen is packed mainly with lymphocytes, the simplest assumption is that the spleen volume can be calculated as where is the average volume of a splenocyte given by a sphere with the radius . Then
| (A.18) |
since volume of a splenocyte is simply . Motility (diffusion) coefficients of T cells in lymph nodes have been estimated in several studies employing in vivo two photon microscopy (50, 51). Depending on type of cells, presence of the antigen and activation status of cells, the motility coefficient has been estimated to range from 10 to 100 (52, 51). The average size of a mouse lymphocyte is about (53). Assuming that motility of activated effectors is higher than that of targets, we let and . Given that targets used in our experiments are splenocytes, we also let , and for effectors . Then the diffusion limited estimate for the killing efficacy of CD8+T cells in vivo is given by
| (A.19) |
However, many of the parameter values are unknown for LCMV-specific CD8+T cells, and changes in these values can affect the estimate of the killing efficacy dramatically. For example, if motility coefficient for effector T cells , then which is still several fold higher than the value in eqn. (A.19).
5.4 Alternative ways of fitting the data on killing following in vivo infection
It is generally unknown what killing terms one should use to describe the process of killing of targets by effector and memory CD8+T cells. Assuming that killing of targets in a given mouse is determined the frequency of epitope-specific CD8+T cells in that mouse led to a poor description of the data (see Main text). Therefore, we investigated whether using different killing terms can improve the model fit to data.
Including a decrease in the death rate of targets with an increasing frequency of targets (see eqn. (A.12)) failed to improve the quality of the model fit to data (F-test for nested models, , ). This was not surprising since this change in the killing term predicts an increased rate of loss of peptide-pulsed targets with time as more targets are killed, but the opposite trend is observed in the data (e.g., Figure S2C and Figure S4).
We tested whether the average frequency of epitope-specific CD8+T cells in all mice, rather than values measured in individual mice, would be predictive of the rate of killing of peptide-pulsed targets. Therefore, we fitted the data on killing of peptide-pulsed targets using the mass-action type term where is the average frequency of epitope-specific CD8+T cells in acutely infected or LCMV-immune mice. This resulted in a significantly better fit with reasonably small confidence intervals for the estimates of the model parameters (lack of fit test: , ; see also Figure S2).
We allowed the death rate of peptide-pulsed targets due to CD8+T cell mediated killing to saturate with the measured frequency of epitope-specific CD8+T cells (see eqn. (A.10)). This also led to a significantly improved fit of the data (F-test for nested models: , ). The fit predicted very high maximal killing efficacy of effector CD8+T cells (, , ; compare these estimates to values for effectors given in Table 1). Moreover, this model predicted that memory CD8+T cells are only 6% (NP396) or 14% (GP276) as efficient as effectors. Such an improvement of the fit by including saturation of the death rate of peptide-pulsed targets with CTL frequency is expected if measurements of the frequency of epitope-specific CD8+T cells are noisy.
Finally, by allowing the death rate of peptide-pulsed targets to depend on the ratio of the frequency of killers to targets (see eqn. (A.13)) we could also obtain an improved fit of the model to data (lack of fit test: , ). Interestingly, we found a relatively small estimate for the parameter (). Because effector to target ratios are rather high in most mice (e.g., for NP396- and for GP276-specific effectors and epitope-expressing targets, see Table 1), a small estimate for the constant suggests that the death rate of peptide-pulsed targets saturates with the frequency of CD8+T cells (compare eqn. (A.13) for and eqn. (A.10) for ). Therefore, the last two models appear to be similar with respect to these in vivo data since both models require saturation in the death rate of peptide-pulsed targets with the frequency of epitope-specific CD8+T cells for a satisfactory description of the data. Such a saturation can simply result from the reduction of the influence of variation of the measured frequency of epitope-specific effector and memory CD8+T cells on the death rate of peptide-pulsed targets.