The observational signature of the first H ii regions
Abstract
We use three-dimensional smoothed particle hydrodynamics simulations together with a dynamical ray-tracing scheme to investigate the build-up of the first H ii regions around massive Population III stars in minihaloes. We trace the highly anisotropic breakout of the ionizing radiation into the intergalactic medium, allowing us to predict the resulting recombination radiation with greatly increased realism. Our simulations, together with Press-Schechter type arguments, allow us to predict the Population III contribution to the radio background at via bremsstrahlung and 21-cm emission. We find a global bremsstrahlung signal of around , and a combined 21-cm signature which is an order of magnitude larger. Both might be within reach of the planned Square Kilometer Array experiment, although detection of the free-free emission is only marginal. The imprint of the first stars on the cosmic radio background might provide us with one of the few diagnostics to test the otherwise elusive minihalo star formation site.
keywords:
cosmology: observations – cosmology: theory – early Universe – stars: formation1 Introduction
One of the most important questions in modern cosmology is to understand how the first stars, the so-called Population III (Pop III), ended the cosmic dark ages at redshifts (Barkana & Loeb, 2001; Bromm & Larson, 2004; Ciardi & Ferrara, 2005). Their emergence led to a fundamental transformation in the early Universe, from its simple initial state to one of ever-increasing complexity. The emission from the hot, , photospheres of Pop III stars began the reionization of primordial hydrogen and helium in the intergalactic medium (IGM), although this process was completed only later on, when more massive galaxies formed (Fan et al., 2006). In addition, the supernova explosions that ended the lives of massive Pop III stars distributed the first heavy elements into the IGM (Bromm et al., 2003; Greif et al., 2007; Tornatore et al., 2007; Wise & Abel, 2008). This latter process might have had a significant impact on the physics of early star formation, as metal-enriched gas can cool more efficiently than primordial gas (Bromm & Loeb, 2003; Omukai et al., 2005; Jappsen et al., 2007, 2009).
Based on numerical simulations, a general consensus has emerged that the first stars formed in dark matter minihaloes at , in isolation or at most as a small stellar multiple, and with typical masses of (for a recent review, see Bromm et al., 2009). It is crucial to observationally test this key prediction. However, it has become evident that this will be very challenging. Even the exquisite near-IR () sensitivity of the upcoming James Webb Space Telescope (JWST) will not suffice to directly image such massive, single Pop III stars (Bromm et al., 2001; Gardner et al., 2006), unless they explode as energetic pair-instability supernovae (Heger & Woosley, 2002; Scannapieco et al., 2005). The direct spectroscopic detection of recombination line emission from the H ii region surrounding the Pop III star, as well as from the relic H ii region left behind once the star had died, is beyond the capability of JWST as well, although such line emission might be detectable from primordial stellar populations inside more massive host haloes (Schaerer, 2002, 2003; Johnson et al., 2009).
An alternative approach is to search for the global signature from many Pop III stars that formed in minihaloes over large cosmic volumes (Haiman & Loeb, 1997). One such probe is the optical depth to Thomson scattering of cosmic microwave background (CMB) photons off free electrons along the line of sight, determined by the five-year Wilkinson Microwave Anisotropy Probe (WMAP) measurement to be (Komatsu et al., 2009). This signal, however, is dominated by ionizing sources that must have formed closer to the end of reionization, with only a small contribution from Pop III stars formed in minihaloes (Greif & Bromm, 2006; Schleicher et al., 2008). A second empirical signature is the combined bremsstrahlung emission from the H ii regions in their active and relic states around those minihaloes that hosted Pop III stars. The resulting free-free radio emission leads to spectral distortions that might be detectable in the Rayleigh-Jeans part of the CMB spectrum. Recently, the ARCADE 2 experiment has attempted to measure such a free-free contribution from the epoch of the first stars (Kogut et al., 2006). The surprisingly strong signal found, however, cannot originate in early Pop III stars, and in any case would overwhelm the much weaker contribution from the first stars and galaxies (Seiffert et al., 2009). The most promising detection strategy might be to scrutinize the background from the redshifted 21-cm line of neutral hydrogen (Furlanetto et al., 2006). Once the central Pop III star has died, the relic H ii region left behind would provide a bright source of 21-cm emission (Tokutani et al., 2009). Again, individual sources are much too weak to leave a detectable imprint, but the planned Square Kilometer Array (SKA) might be able to detect the cumulative signal (Furlanetto, 2006; Lazio, 2008).
We here carry out radiation hydrodynamics simulations of the evolution of H ii regions around massive Pop III stars in minihaloes, giving us a detailed understanding of the properties of individual sources. We combine this with an approximate, Press-Schechter type analysis of the cosmological number density of minihaloes as a function of redshift to derive the observational signature of the first H ii regions as well as relic H ii regions, where we specifically focus on the free-free and 21-cm probes. We note that we do not include the feedback effects exerted by black holes or supernovae, which are possible end products of massive Pop III stars (Heger & Woosley, 2002). In this sense, we organize our work as follows. In Section 2, we describe the simulation setup and our implementation of the radiative transfer scheme in the smoothed particle hydrodynamics (SPH) code GADGET-2 (Springel, 2005). In Section 3, we discuss the properties of the first H ii regions in their active as well as relic states and their observational signature in terms of recombination radiation, bremsstrahlung and 21-cm emission. Finally, in Section 4 we summarize our results and assess their implications. For consistency, all quoted distances are physical, unless noted otherwise.
2 Numerical methodology
Our treatment of ionizing and photodissociating radiation emitted by massive Pop III stars is very similar to the methodology introduced in Johnson et al. (2007) and Yoshida et al. (2007), with the exception that we here take the hydrodynamical response into account, self-consistently coupled to the chemical and thermal evolution of the gas. This allows us to model dense (D-type) as well as rarefied (R-type) ionization fronts, which is crucial for a proper treatment of the breakout of ionizing radiation. In the following, we describe our simulation setup, as well as the numerical implementation of the ray-tracing algorithm.
2.1 Simulation set-up
We perform our simulations in a cosmological box with linear size (comoving), and particles per species, corresponding to a particle mass of for dark matter and for gas. The simulations are initialized at with a fluctuation power spectrum determined by a cold dark matter (CDM) cosmology with matter density , baryon density , Hubble parameter , where is the Hubble expansion rate today, and spectral index (Komatsu et al., 2009). We use an artificially high fluctuation power of to accelerate structure formation in our relatively small box, although the cosmological mean is given by . We take the chemical evolution of the gas into account by following the abundances of H, H+, H-, H2, H, He, He+, He++, and e-, as well as the three deuterium species D, D+, and HD. We include all relevant cooling mechanisms, i.e. H and He collisional ionization, excitation and recombination cooling, bremsstrahlung, inverse Compton cooling, and collisional excitation cooling via H2 and HD (Glover & Jappsen, 2007). We explicitly include H2 cooling via collisions with protons and electrons, which is important for the chemical and thermal evolution of relic H ii region gas (Glover & Abel, 2008).
We run the simulations until the first minihalo in the box has collapsed to a density of , at which point the gas has cooled to and becomes Jeans-unstable (Abel et al., 2002; Bromm et al., 2002). The first halo that fulfils this criterion collapses at and has a virial mass of and a virial radius of . Highly resolved simulations have shown that at later times, the gas condenses further under the influence of self-gravity to , where it becomes optically thick and forms a protostellar seed (Yoshida et al., 2008). Due to its residual angular momentum, the central clump flattens and likely evolves into an accretion disk. In our case, we find a flattened structure already at a density of (see Fig. 1). Subsequently, the star grows to as massive as within its lifetime of a few million years (Bromm & Loeb, 2004). However, we note that under certain conditions the disk may fragment to form multiple objects of smaller masses (Clark et al., 2008). Unfortunately, the details of the accretion phase and the concomitant radiative feedback are poorly understood, although some analytic investigations have been carried out (Tan & McKee, 2004; McKee & Tan, 2008). Under these circumstances, it seems best to initialize the calculation of the H ii region at the onset of the initial Jeans-instability, when the density exceeds .
2.2 Ray-tracing scheme
The procedure used to calculate the Strömgren sphere around the star for a given time-step is similar to the ray-tracing scheme used in Johnson et al. (2007). We first designate an individual SPH particle as the source of ionizing radiation and create a spherical grid with typically rays and logarithmically spaced radial bins around the source particle. The minimum radius is set by the smoothing length of the central particle, while the maximum radius is chosen appropriately to encompass the entire H ii region. This approach may seem crude compared to existing methods that use adaptive grids (e.g. HEALPIX; Górski et al., 2005), but the increased angular and radial resolution towards the center tend to mirror the existing density profile. However, one must proceed with care if the ionization front encounters dense clumps far from the source, where the resolution may no longer be sufficient.
In a single, parallel loop, the Cartesian coordinates of all particles are converted to spherical coordinates, such that their density and chemical abundances are mapped to the bins corresponding to their radius, zenith angle and azimuth, denoted by , and , respectively. The volume of each particle is approximately given by , which transforms to , and . If the volume element of a particle intersects with the volume element of a bin, the particle contributes to the bin proportional to the density of the particle squared. This dependency ensures that overdense regions are not missed if the bin size is much larger than the smoothing length, which could occur far from the source where the grid resolution is poor. Accidental flash-ionization of minihaloes is thus avoided. Once the above steps are complete, it is straightforward to solve the ionization front equation along each ray:
| (1) |
where denotes the position of the ionization front, the number of ionizing photons emitted per second, the case B recombination coefficient, and , and the number densities of neutral particles, electrons and positively charged ions, respectively. We assume that the recombination coefficient remains constant at its value for , which is roughly the temperature of the H ii and He iii region.
The numbers of H i/He i and He ii ionizing photons are given by
| (2) |
where from now on denotes Planck’s constant, denotes Boltzmann’s constant, and is the minimum frequency corresponding to the ionization threshold of H i and He ii. We assume that massive Pop III stars emit a blackbody spectrum (in ) with an effective temperature , , and luminosity , , for a , and star, respectively (Schaerer, 2002). This yields
| (3) |
and
| (4) |
We do not distinguish between the H ii and He ii region, which is a good approximation for massive Pop III stars (Osterbrock & Ferland, 2006). The lifetimes of the stars are given by , and , respectively. We neglect the effects of stellar evolution, which might lead to a decrease of the number of ionizing photons emitted at the end of the main sequence (Marigo et al., 2001; Schaerer, 2002), although recent investigations have shown that rotating Pop III stars remain on bluer evolutionary tracks and this effect might not be so strong (Yoon & Langer, 2005; Woosley & Heger, 2006; Vázquez et al., 2007).
To obtain a discretisation of the ionization front equation, we replace the integral on the right-hand side of equation (1) by a discrete sum:
| (5) |
where is the radial extent of bin , and the sum extends from the origin to the position of the ionization front at the end of the current time-step . The above equation describes the advancement of the ionization front due to an excess of ionizing photons compared to recombinations. Similarly, the left-hand side of equation (1), which models the propagation of the ionization front into neutral gas, is discretized by
| (6) |
where the sum now extends from the position of the ionization front at the previous time-step to its position at the end of the current time-step. We perform the above steps separately for the H ii and He iii region, since they require distinct heating and ionization rates. For the He iii region, we replace the quantities and in equation (1) with and , where is the number density of species relative to . We adopt a case B recombination rate of for He iii recombinations to He ii (Osterbrock & Ferland, 2006). Applying the same prescription to the H ii region, we find and . Similarly, we adopt a case B recombination rate of for hydrogen and helium recombinations from their first ionized states to the ground state (Osterbrock & Ferland, 2006). We initialize the calculation of the H ii region at the boundary of the He iii region, since hydrogen and helium are maintained in their first ionization states by recombinations of He iii to He ii (Osterbrock & Ferland, 2006). We note that the exact position of the ionization front is not restricted to integer multiples of our pre-defined radial bins, but may instead lie anywhere in between. For this purpose we adopt a simple linear scaling of the number of ionizations and recombinations as a function of the relative position of the ionization front. The most expensive step in terms of computing time is the assignment of the density and the chemical abundances to the grid, while the ray-tracing itself requires only a negligible amount of time.
2.3 Photoionization and photoheating
Once the extent of the H ii and He iii region have been determined, the SPH particles within these regions are assigned an additional variable that stores their distance from the source. This information is then passed to the chemistry solver, which determines the ionization and heating rates, given by
| (7) |
and
| (8) |
where and denote the incoming specific flux and ionization cross section, respectively. For the case of a blackbody,
| (9) |
where is the distance from the source. The resulting rates are given by
| (10) |
| (11) |
| (12) |
| (13) |
| (14) |
| (15) |
for a , and Pop III star, respectively. These are taken into account every time-step, while the ray-tracing is performed only every fifth time-step. Since the hydrodynamic time-step is generally limited to one-twentieth of the sound-crossing time through the kernel, our treatment of the coupled evolution of the ionization front and the hydrodynamic shock is roughly correct. The computational cost of runs with and without ray-tracing are typically within a factor of a few.
2.4 Photodissociation and photodetachment
The final ingredient in our algorithm is the inclusion of molecule-dissociating radiation. This effect turns out to be of only minor importance in the present study, but will render our algorithm capable of addressing a general set of early Universe applications. Molecular hydrogen is the most important coolant in low-temperature, primordial gas, but is easily destroyed by radiation in the Lyman-Werner (LW) bands between and . The small residual H2 fraction in the IGM leads to a very small optical depth over cosmological distances, such that even a small background can have a significant effect (Haiman et al., 2000; Glover & Brand, 2001; Johnson et al., 2007). In our implementation, we do not take self-shielding into account, which becomes important for H2 column densities (Draine & Bertoldi, 1996). Such a high column density is difficult to achieve in minihaloes, and is more likely to occur within the virial radius of the first galaxies (Oh & Haiman, 2002). However, the onset of turbulence in the first galaxies likely leads to a reduction of self-shielding via Doppler shifting (Wise & Abel, 2007; Greif et al., 2008). For this reason we treat the photodissociation of H2 in the optically thin limit, such that the dissociation rate in a volume limited by causality to a radius is given by , where is the integral of the specific flux over the LW bands, resulting in
| (16) |
for a , and Pop III star, respectively. We equate the photodissociation rate of hydrogen deuteride to that of molecular hydrogen. In the present work, we do not explicitly include photodetachment of H- and photodissociation of H, which might be problematic outside of the H ii region, where molecules survive collisional destruction. However, in the context discussed here, this caveat is not important (see Johnson et al., 2007).
3 Observational signature
In the following, we discuss the direct observational signature of the first H ii regions and relic H ii regions in terms of recombination radiation, as well as their indirect signature in terms of a global radio background produced by bremsstrahlung and 21-cm emission.
3.1 Build-up of H ii and He iii region
The build-up of the first H ii regions by Pop III stars in minihaloes was treated in one dimension by Kitayama et al. (2004) and Whalen et al. (2004), and in three dimensions by Alvarez et al. (2006), Abel et al. (2007) and Yoshida et al. (2007). The latter also treated the build-up of a smaller He iii region, which is created by the very hard spectrum of massive Pop III stars. The consensus was that recombinations initially balanced ionizations within the virial radius of the host halo, leading to the formation of a D-type ionization front. Breakout occured after the density dropped sufficiently for the ionization front to race ahead of the hydrodynamic shock, becoming R-type. The hydrodynamic response of the gas is self-similar, since minihaloes approximately resemble singular isothermal spheres (Shu et al., 2002; Alvarez et al., 2006). The relevant parameters are set by the temperature of the singular isothermal sphere and the H ii region, which in our case are and , respectively.
In Fig. 2, we compare the density profile of the Shu et al. (2002) solution to the simulation for the case of a Pop III star. Interestingly, we find a clear deviation from the ideal, spherically symmetric solution already during the D-type phase, which is caused by the anisotropic collapse of the minihalo. Due to angular momentum conservation, the gas spins up and forms a flattened, disk-like structure at a density of , which can be seen in the right panel of Fig. 1, and in the left panel of Fig. 2, where it is evident that the density dispersion is almost an order of magnitude within the central . In response to this anisotropy, which is further amplified by the density-squared dependence of recombinations, the ionization front first breaks out perpendicular to the disk, where the column density is lowest. This is visible in the left and middle panels of Fig. 3, as well as in Fig. 2, where the Shu et al. (2002) solution is approximately reproduced perpendicular to the disk, while the plane of the disk remains neutral and dense. Once the ionization front becomes R-type, spherical symmetry is asymptotically restored and the H ii region expands to , and for the , and Pop III star, respectively. We find that He ii ionizing photons within the He iii region increase the central temperature by a factor of , leaving only a small imprint on the dynamical evolution of the H ii region (see Yoshida et al., 2007). However, the He ii recombination line within the He iii region may be used as a distinct probe for the presence of massive Pop III stars (Bromm et al., 2001; Oh, 2001; Tumlinson et al., 2001; Schaerer, 2002). In the following, we use the results obtained in this section to determine the recombination signature of the first H ii and He iii regions in their active as well as relic states.
3.2 Recombination radiation from individual H ii and He iii regions
The strongest direct signature of the first H ii and He iii regions is likely generated by recombination radiation, since ionizing photons are absorbed by dense gas in the host halo. We here concentrate on the H and He ii lines, since more energetic photons photons are scattered out of resonance by the neutral IGM, creating extended haloes around high-redshift sources (e.g. Loeb & Rybicki, 1999). The resulting fluxes may then be compared to the expected sensitivity of the Mid-Infrared Instrument (MIRI) on JWST at wavelengths (Gardner et al., 2006). The spatial resolution is limited by diffraction, such that a scale of at is marginally resolved, which allows us to approximate the region of emission as a point source. Using the simulation output, the total luminosities are given by
| (17) |
and
| (18) |
where and are the emissivity of the H and He ii lines at (Osterbrock & Ferland, 2006), is the primordial mass fraction of hydrogen, is the mass of the hydrogen atom, and are the mass and density of particle , respectively, and the sum is over all particles in the simulation box. From the total luminosity, we determine the observed flux with the inverse-square law
| (19) |
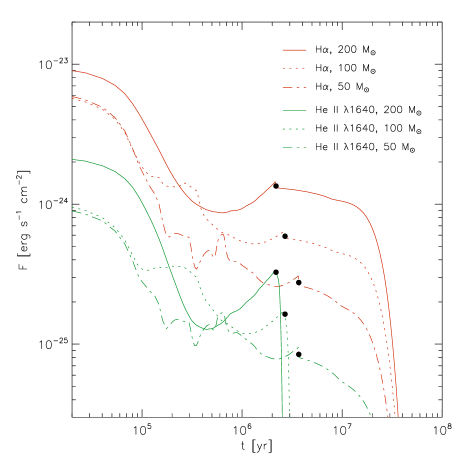
where is the cosmological luminosity distance. In Fig. 4, we show the observed flux for a , and Pop III star as a function of time. The emission peaks before breakout, when the density in the host halo is still high, reaching a maximum flux of . Once the star turns off, the H emission drops quite rapidly over the course of a few , while the He ii emission drops almost instantaneously in the and cases, due to the high recombination coefficient of He iii to He ii. It is noteworthy that the emission in the He ii line is generally not much lower than that in the H line, which may be used as an indicator for massive Pop III stars (Bromm et al., 2001; Oh, 2001; Tumlinson et al., 2001; Schaerer, 2002).
For a detection with an exposure time of hours, the spectrograph on MIRI exhibits a typical limiting sensitivity of (Panagia, 2005), implying that the first H ii regions are typically five orders of magnitude too faint for a direct detection. We must therefore resort to indirect methods that rely on their cumulative signal. One such signature is the cosmic infrared background (CIB), where the redshifted Ly recombination photons from – might contribute at a detectable level (Santos et al., 2002; Kashlinsky et al., 2005). Minihaloes, however, are not expected to be important sources for the CIB, as opposed to more massive dark matter haloes that host the first galaxies (Greif & Bromm, 2006). This leads us to consider the radio background as a key diagnostic of the Pop III minihalo formation site.
3.3 Radio background produced by bremsstrahlung
The first H ii regions in their active as well as relic states also emit bremsstrahlung via thermal motions of electrons in an ionized medium. In line with our conlusions of the previous section, the signature from an individual source is much too faint to be detected. However, the cumulative radio signal might be strong enough to be detected by the upcoming SKA. We will here further explore this possibility (for a review of earlier work, see Furlanetto et al., 2006).
Solving the cosmological radiative transfer equation, it is straightforward to derive a simple expression for the observed radio background (in ):
| (20) |
where is the present Hubble time and is the specific emissivity of bremsstrahlung, given by
| (21) |
where , is the volume-averaged electron density, and is the temperature (Rybicki & Lightman, 1979). We universally assume , since the relic H ii region cools quite rapidly to via inverse Compton losses and adiabatic expansion once the star has died (e.g. Greif et al., 2007; Yoshida et al., 2007). Furthermore, we assume at , since photoheating during reionization evaporates minihaloes (Dijkstra et al., 2004). This leads to:
| (22) |
where we relate to the number density of minihaloes according to:
| (23) |
Here, denotes the recombination time for hydrogen atoms, the case B recombination rate for , the background density, the number of minihaloes per comoving volume, the comoving volume of an individual H ii region in its active as well as relic state, which is independent of redshift, and the total number of ionizing photons emitted per Pop III star (see Section 2). In the above equation, we have implicitly assumed that (relic) H ii regions survive for a recombination time, and that all ionizing photons escape into the IGM, which is a good approximation for massive Pop III stars in minihaloes (Alvarez et al., 2006). We note that in the range of redshifts considered here, the recombination time is larger than the stellar lifetime and smaller than the age of the Universe. In principle, one must also account for the clustering of minihaloes (biasing), which reduces the net volume filling factor of H ii regions (Mo & White, 1996; Iliev et al., 2003; Gao et al., 2005; Reed et al., 2005; Greif & Bromm, 2006). However, it is extremely difficult to determine the importance of this effect, since (i) the actual overlap depends on the relative separation of minihaloes, and (ii) previous ionization allows a nearby H ii region to become larger than usual. We therefore neglect biasing, but keep in mind that the actual signal may be somewhat lower.
In equation (23), the number density of minihaloes is given by
| (24) |
where is the well-known Press-Schechter mass function (Press & Schechter, 1974). The minimum mass required for efficient cooling within a Hubble time may be found in Yoshida et al. (2003) and Trenti & Stiavelli (2009):
| (25) |
while the maximum mass is set by the requirement that cooling must be dominated by molecular hydrogen, i.e. the virial temperature must not exceed for atomic hydrogen cooling, resulting in (e.g. Barkana & Loeb, 2001)
| (26) |
We have found that our results are only marginally affected by the upper mass limit, but depend sensitively on the lower mass limit, since most minihaloes reside at the lower end of the halo distribution function.
After combining the above equations, we obtain
| (27) |
which, for an IMF consisting solely of Pop III stars, yields
| (28) |
The brightness temperature, , is given by
| (29) |
In the following, we investigate whether a signal of this magnitude is observable by the upcoming SKA.
The sensitivity of radio instruments is generally defined by the ratio of the effective collecting area to the system temperature . For the SKA with its proposed aperture array configuration at low frequencies, at 111http://www.skatelescope.org. In this range, the system temperature is dominated by Galactic synchrotron emission, for which a useful approximation is given by (Furlanetto et al., 2006), resulting in and . The minimum angular resolution for an array filling factor of unity at is approximately . At higher resolutions, the sensitivity decreases much too rapidly for effective imaging. In Fig. 5, we compare the sensitivity of the SKA for a detection, a bandwidth of , and an integration time of to the brightness temperature and specific flux expected for free-free emission. Although the figure implies that the free-free signal is detectable by the SKA, we have neglected biasing as well as radiative feedback in the form of a global LW background, which attenuates star formation in minihaloes (Johnson et al., 2007, 2008). Another complicating issue is the overlap with 21-cm emission, which makes it nearly impossible to isolate the contribution from bremsstrahlung. In consequence, we do not believe that this signal will be observable in the near future.

3.4 Radio background produced by 21-cm emission
Perhaps the most promising observational signature comes from 21-cm emission of the relic H ii region gas once the star has died, a prospect that was already investigated by Tokutani et al. (2009). An emission signal requires the spin temperature of neutral hydrogen to be greater than the temperature of the CMB, with its relative brightness determined by and the size of the relic H ii region. The spin temperature is set by collisional coupling with neutral hydrogen atoms, protons and electrons, as well as radiative coupling to the CMB. Furthermore, it may be modified by the so-called Wouthuysen-Field effect, which describes the mixing of spin states due to the absorption and re-emission of Ly photons (Wouthuysen, 1952; Field, 1959). The color temperature of the Ly background is determined by the ratio of excitations to de-excitations, which approaches the kinetic gas temperature at high redshifts, where the optical depth to Ly scattering is very large (Furlanetto et al., 2006). In this case, adopting the Rayleigh-Jeans approximation and assuming , where is the temperature associated with the 21-cm transition, the spin temperature may be written as (Madau et al., 1997)
| (30) |
where is the temperature of the CMB. The collisional coupling coefficient is approximately given by
| (31) |
where is the Einstein A-coefficient for the 21-cm transition, and and are the effective single-atom rate coefficients for collisions with neutral hydrogen atoms and electrons, respectively. Good functional fits in the temperature range are given by
| (32) |
and
| (33) |
which we have obtained from the rates quoted in Kuhlen et al. (2006). At , the electron fraction in the IGM remains above for most of the lifetime of the relic H ii region. In this case, the collisional coupling coefficient is given by
| (34) |
A derivation of the Ly coupling coefficient requires radiative transfer of local as well as global Ly radiation, which is beyond the scope of this work. We therefore consider two limiting cases: one in which we only consider collisional coupling, and the other in which a strong Ly background drives the spin temperature towards the gas temperature (i.e. or ).
The differential brightness temperature with respect to the CMB may then be derived as follows. In the Rayleigh-Jeans limit and for , the monochromatic radiative transfer equation for a ray passing through a cloud, evaluated in its comoving frame, may be written in terms of the brightness temperature :
| (35) |
where the optical depth at the 21-cm line is given by
| (36) |
Here, is the normalized line profile at the resonance frequency and is the distance traveled by the ray. In our case, the line profile is dominated by thermal broadening, with a Doppler width given by
| (37) |
The amplitude of the line profile at the resonance frequency may be replaced by the Doppler width, i.e. . With this definition, equation (35) yields the differential brightness temperature , which becomes particularly simple for a constant spin temperature and the fact that the relic H ii regions considered here are optically thin:
| (38) |
The observed differential brightness temperature is then simply given by .
In Fig. 6, we show the observed differential brightness temperature for a star and the two limiting cases discussed above. Note that we have only taken into account ionized gas along the line of sight. For collisional coupling, the observed differential brightness temperature is of order a few for , while for perfect coupling the signal is elevated by an order of magnitude to a few for well over . In reality, the expected signal lies between these extremes and is a function of redshift, since collisional coupling becomes weaker as the background density drops, while Ly coupling becomes stronger as the Ly background rises. At , where the observationally accessible signal is produced, the Ly background is likely strong enough for the latter to be more important (Furlanetto, 2006; Pritchard & Furlanetto, 2007).
Next, we determine the radio background produced by the integrated 21-cm emission of relic H ii regions. The differential specific flux observed at the redshifted 21-cm line from a single relic H ii region with differential brightness temperature is given by
| (39) |
where denotes the solid angle subtended by the relic H ii region, its area, its radius, and the angular diameter distance. The average differential specific flux within a beam size and bandwidth is then given by
| (40) |
where , is the Press-Schechter mass function defined in equation (24), , and is the comoving volume per unit redshift and solid angle:
| (41) |
where is the Hubble expansion rate. With the definition of the brightness temperature, the average differential antenna temperature is given by
| (42) |
Based on our argument above, we assume that the Ly background is strong enough for perfect coupling at all redshifts. In this case, and for , the average differential antenna temperature becomes independent of electron fraction and temperature:
| (43) |
where we have set in equation (36). We note that the observed frequency is related to the redshift via . We have further assumed that the relic H ii region produced by each star-forming minihalo persists until the Universe is reionized (i.e. ), which is a good approximation for perfect coupling and . Equation (43) thus provides a robust upper limit for the collective 21-cm emission from the first relic H ii regions.
In Fig. 7, we compare the average differential antenna temperature and specific flux for a beam size of to the sensitivity of the SKA, assuming a detection, a bandwidth of , and an integration time of . At all frequencies, the maximum 21-cm signal from the first relic H ii regions is of order , which is well detectable by the SKA. The effects of biasing and radiative feedback will reduce this signal, but probably not enough to fall below the sensitivity of the SKA. Compared to free-free emission, the 21-cm signal is typically an order of magnitude stronger, and offers the best prospect for indirectly probing the first stars. Furthermore, the 21-cm signal is explicitly frequency-dependent, while this is not the case for bremsstrahlung, where a flat spectrum is produced (see equation 28). This dependency might allow for a better distinction from other sources of radio emission at these wavelengths.

4 Summary and conclusions
We have introduced a general-purpose radiative transfer scheme for cosmological SPH simulations that treats ionizing and photodissociating radiation from massive Pop III stars in the early Universe. Based on this methodology, we have investigated the build-up of the first H ii regions and relic H ii regions around Pop III stars formed in minihaloes, and predicted their contribution to the extragalactic radio background via bremsstrahlung and 21-cm emission. Although recombination radiation from individual H ii regions in their active as well as relic states is too faint to be directly detectable even with JWST, their collective radio emission might be strong enough to be within reach of the planned SKA. In particular, we have found that the integrated free-free emission results in a maximum differential antenna temperature of , while the 21-cm emission is an order of magnitude stronger. Considering the effects of biasing and negative radiative feedback, which would act to reduce the predicted signal, the free-free signal is likely beyond the capability of the SKA, while the 21-cm signal will most likely be observable, providing an excellent opportunity for indirectly probing the first stars.
We note that an analysis of the angular fluctuation power spectrum will be essential to isolate the 21-cm signal from other backgrounds (Furlanetto & Oh, 2006), although the frequency-dependence of the 21-cm signal might already prove useful. Among these are neutral minihaloes, which appear in emission due to their enhanced density and temperature (Iliev et al., 2002), or IGM gas heated by X-rays from supernovae (Oh, 2001), X-ray binaries (Glover & Brand, 2003), or the first quasars (Madau et al., 2004; Kuhlen et al., 2006). A strong absorption signal might originate from cold, neutral gas if the Ly background effectively couples the spin temperature to the gas temperature (Pritchard & Furlanetto, 2007). In addition, there is the signal produced by stars (primordial or already metal-enriched) formed in the first dwarf galaxies (e.g. Naoz & Barkana, 2008). All of these compete with each other, and more work is required to understand their relative importance. One important task is to extend the simulations to larger cosmological volumes, to measure the aggregate signal from many sources in a more robust way.
Minihaloes may not have been the dominant formation sites for primordial stars, in terms of producing the bulk of the radiation that drove reionization, or of being the source for the majority of the heavy elements present at high redshifts (Greif & Bromm, 2006; Schleicher et al., 2008). Nevertheless, they are the ideal laboratory to test our current standard model of the first stars, by providing an exceedingly simple environment for the star formation process (Bromm et al., 2009). The next step in the hierachical build-up of structure is already highly complex, due to the presence of metals, turbulent velocity fields, and possibly dynamically significant magnetic fields (Wise & Abel, 2007, 2008; Greif et al., 2008; Schleicher et al., 2009). It is therefore crucial to empirically probe the minihalo environment, and the signature left in the radio background might provide us with one of the few avenues to accomplish this in the foreseeable future.
Acknowledgments
The authors would like to thank the referee Naoki Yoshida for his valuable comments and suggestions that greatly improved this work. TG thanks Matthias Bartelmann and Simon Glover for many stimulating discussions. TG acknowledges financial support by the Heidelberg Graduate School of Fundamental Physics (HGSFP). The HGSFP is funded by the Excellence Initiative of the German government (grant number GSC 129/1). RSK acknowledge subsidies from the Deutsche Forschungsgemeinschaft via the priority program SFB 439 “Galaxies in the Early Universe” as well as via grants KL1358/1, KL1358/4 and KL1358/5. In addition, RSK also acknowledges partial support from a Frontier grant of Heidelberg University funded by the German Excellence Initiative. VB acknowledges support from NSF grant AST-0708795 and NASA ATFP grant NNX08AL43G. The simulations presented here were carried out at the Texas Advanced Computing Center (TACC).
References
- Abel et al. (2002) Abel T., Bryan G. L., Norman M. L., 2002, Sci, 295, 93
- Abel et al. (2007) Abel T., Wise J. H., Bryan G. L., 2007, ApJ, 659, L87
- Alvarez et al. (2006) Alvarez M. A., Bromm V., Shapiro P. R., 2006, ApJ, 639, 621
- Alvarez et al. (2006) Alvarez M. A., Shapiro P. R., Ahn K., Iliev I. T., 2006, ApJ, 644, L101
- Barkana & Loeb (2001) Barkana R., Loeb A., 2001, Phys. Rep., 349, 125
- Bromm et al. (2002) Bromm V., Coppi P. S., Larson R. B., 2002, ApJ, 564, 23
- Bromm et al. (2001) Bromm V., Kudritzki R. P., Loeb A., 2001, ApJ, 552, 464
- Bromm & Larson (2004) Bromm V., Larson R. B., 2004, ARA&A, 42, 79
- Bromm & Loeb (2003) Bromm V., Loeb A., 2003, Nat, 425, 812
- Bromm & Loeb (2004) Bromm V., Loeb A., 2004, New Astron., 9, 353
- Bromm et al. (2003) Bromm V., Yoshida N., Hernquist L., 2003, ApJ, 596, L135
- Bromm et al. (2009) Bromm V., Yoshida N., Hernquist L., McKee C. F., 2009, Nat, 459, 49
- Ciardi & Ferrara (2005) Ciardi B., Ferrara A., 2005, Space Sci. Rev., 116, 625
- Clark et al. (2008) Clark P. C., Glover S. C. O., Klessen R. S., 2008, ApJ, 672, 757
- Dijkstra et al. (2004) Dijkstra M., Haiman Z., Rees M. J., Weinberg D. H., 2004, ApJ, 601, 666
- Draine & Bertoldi (1996) Draine B. T., Bertoldi F., 1996, ApJ, 468, 269
- Fan et al. (2006) Fan X., Carilli C. L., Keating B., 2006, ARA&A, 44, 415
- Field (1959) Field G. B., 1959, ApJ, 129, 536
- Furlanetto (2006) Furlanetto S. R., 2006, MNRAS, 371, 867
- Furlanetto & Oh (2006) Furlanetto S. R., Oh S. P., 2006, ApJ, 652, 849
- Furlanetto et al. (2006) Furlanetto S. R., Oh S. P., Briggs F. H., 2006, Phys. Rep., 433, 181
- Gao et al. (2005) Gao L., White S. D. M., Jenkins A., Frenk C. S., Springel V., 2005, MNRAS, 363, 379
- Gardner et al. (2006) Gardner J. P., et al., 2006, Space Sci. Rev., 123, 485
- Glover & Abel (2008) Glover S. C. O., Abel T., 2008, MNRAS, 388, 1627
- Glover & Brand (2001) Glover S. C. O., Brand P. W. J. L., 2001, MNRAS, 321, 385
- Glover & Brand (2003) Glover S. C. O., Brand P. W. J. L., 2003, MNRAS, 340, 210
- Glover & Jappsen (2007) Glover S. C. O., Jappsen A.-K., 2007, ApJ, 666, 1
- Górski et al. (2005) Górski K. M., Hivon E., Banday A. J., Wandelt B. D., Hansen F. K., Reinecke M., Bartelmann M., 2005, ApJ, 622, 759
- Greif & Bromm (2006) Greif T. H., Bromm V., 2006, MNRAS, 373, 128
- Greif et al. (2007) Greif T. H., Johnson J. L., Bromm V., Klessen R. S., 2007, ApJ, 670, 1
- Greif et al. (2008) Greif T. H., Johnson J. L., Klessen R. S., Bromm V., 2008, MNRAS, 387, 1021
- Haiman et al. (2000) Haiman Z., Abel T., Rees M. J., 2000, ApJ, 534, 11
- Haiman & Loeb (1997) Haiman Z., Loeb A., 1997, ApJ, 483, 21
- Heger & Woosley (2002) Heger A., Woosley S. E., 2002, ApJ, 567, 532
- Iliev et al. (2003) Iliev I. T., Scannapieco E., Martel H., Shapiro P. R., 2003, MNRAS, 341, 81
- Iliev et al. (2002) Iliev I. T., Shapiro P. R., Ferrara A., Martel H., 2002, ApJ, 572, L123
- Jappsen et al. (2007) Jappsen A.-K., Glover S. C. O., Klessen R. S., Mac Low M.-M., 2007, ApJ, 660, 1332
- Jappsen et al. (2009) Jappsen A.-K., Klessen R. S., Glover S. C. O., MacLow M.-M., 2009, ApJ, 696, 1065
- Johnson et al. (2007) Johnson J. L., Greif T. H., Bromm V., 2007, ApJ, 665, 85
- Johnson et al. (2008) Johnson J. L., Greif T. H., Bromm V., 2008, MNRAS, 388, 26
- Johnson et al. (2009) Johnson J. L., Greif T. H., Bromm V., Klessen R. S., Ippolito J., 2009, MNRAS, in press (arXiv:0902.3263)
- Kashlinsky et al. (2005) Kashlinsky A., Arendt R. G., Mather J., Moseley S. H., 2005, Nat, 438, 45
- Kitayama et al. (2004) Kitayama T., Yoshida N., Susa H., Umemura M., 2004, ApJ, 613, 631
- Kogut et al. (2006) Kogut A., et al., 2006, New Astron. Rev., 50, 925
- Komatsu et al. (2009) Komatsu E., et al., 2009, ApJS, 180, 330
- Kuhlen et al. (2006) Kuhlen M., Madau P., Montgomery R., 2006, ApJ, 637, L1
- Lazio (2008) Lazio J., 2008, in Minchin R., Momjian E., eds, AIP Conf. Ser. Vol. 1035, The Evolution of Galaxies Through the Neutral Hydrogen Window. Am. Inst. Phys., New York, p. 303
- Loeb & Rybicki (1999) Loeb A., Rybicki G. B., 1999, ApJ, 524, 527
- Madau et al. (1997) Madau P., Meiksin A., Rees M. J., 1997, ApJ, 475, 429
- Madau et al. (2004) Madau P., Rees M. J., Volonteri M., Haardt F., Oh S. P., 2004, ApJ, 604, 484
- Marigo et al. (2001) Marigo P., Girardi L., Chiosi C., Wood P. R., 2001, A&A, 371, 152
- McKee & Tan (2008) McKee C. F., Tan J. C., 2008, ApJ, 681, 771
- Mo & White (1996) Mo H. J., White S. D. M., 1996, MNRAS, 282, 347
- Naoz & Barkana (2008) Naoz S., Barkana R., 2008, MNRAS, 385, L63
- Oh (2001) Oh S. P., 2001, ApJ, 553, 499
- Oh & Haiman (2002) Oh S. P., Haiman Z., 2002, ApJ, 569, 558
- Omukai et al. (2005) Omukai K., Tsuribe T., Schneider R., Ferrara A., 2005, ApJ, 626, 627
- Osterbrock & Ferland (2006) Osterbrock D., Ferland G., 2006, Astrophysics of Gaseous Nebulae and Active Galactic Nuclei. University Science Books, Sausalito
- Panagia (2005) Panagia N., 2005, in Corbelli E., Palla F., Zinnecker H., eds, The Initial Mass Function 50 Years. Springer, Berlin, p. 479
- Press & Schechter (1974) Press W. H., Schechter P., 1974, ApJ, 187, 425
- Pritchard & Furlanetto (2007) Pritchard J. R., Furlanetto S. R., 2007, MNRAS, 376, 1680
- Reed et al. (2005) Reed D. S., Bower R., Frenk C. S., Gao L., Jenkins A., Theuns T., White S. D. M., 2005, MNRAS, 363, 393
- Rybicki & Lightman (1979) Rybicki G. B., Lightman A. P., 1979, Radiative Processes in Astrophysics. Wiley-Interscience, New York
- Santos et al. (2002) Santos M. R., Bromm V., Kamionkowski M., 2002, MNRAS, 336, 1082
- Scannapieco et al. (2005) Scannapieco E., Madau P., Woosley S., Heger A., Ferrara A., 2005, ApJ, 633, 1031
- Schaerer (2002) Schaerer D., 2002, A&A, 382, 28
- Schaerer (2003) Schaerer D., 2003, A&A, 397, 527
- Schleicher et al. (2008) Schleicher D. R. G., Banerjee R., Klessen R. S., 2008, Phys. Rev. D, 78, 083005
- Schleicher et al. (2009) Schleicher D. R. G., Galli D., Glover S. C. O., Banerjee R., Palla F., Schneider R., Klessen R. S., 2009, submitted (arXiv:0904.3970)
- Seiffert et al. (2009) Seiffert M., et al., 2009, submitted (arXiv:0901.0559)
- Shu et al. (2002) Shu F. H., Lizano S., Galli D., Cantó J., Laughlin G., 2002, ApJ, 580, 969
- Springel (2005) Springel V., 2005, MNRAS, 364, 1105
- Tan & McKee (2004) Tan J. C., McKee C. F., 2004, ApJ, 603, 383
- Tokutani et al. (2009) Tokutani M., Yoshida N., Oh S. P., Sugiyama N., 2009, MNRAS, 395, 777
- Tornatore et al. (2007) Tornatore L., Ferrara A., Schneider R., 2007, MNRAS, 382, 945
- Trenti & Stiavelli (2009) Trenti M., Stiavelli M., 2009, ApJ, 694, 879
- Tumlinson et al. (2001) Tumlinson J., Giroux M. L., Shull J. M., 2001, ApJ, 550, L1
- Vázquez et al. (2007) Vázquez G. A., Leitherer C., Schaerer D., Meynet G., Maeder A., 2007, ApJ, 663, 995
- Whalen et al. (2004) Whalen D., Abel T., Norman M. L., 2004, ApJ, 610, 14
- Wise & Abel (2007) Wise J. H., Abel T., 2007, ApJ, 665, 899
- Wise & Abel (2008) Wise J. H., Abel T., 2008, ApJ, 685, 40
- Woosley & Heger (2006) Woosley S. E., Heger A., 2006, ApJ, 637, 914
- Wouthuysen (1952) Wouthuysen S. A., 1952, AJ, 57, 31
- Yoon & Langer (2005) Yoon S.-C., Langer N., 2005, A&A, 443, 643
- Yoshida et al. (2003) Yoshida N., Abel T., Hernquist L., Sugiyama N., 2003, ApJ, 592, 645
- Yoshida et al. (2007) Yoshida N., Oh S. P., Kitayama T., Hernquist L., 2007, ApJ, 663, 687
- Yoshida et al. (2008) Yoshida N., Omukai K., Hernquist L., 2008, Sci, 321, 669