Fresnel Interferometric Imager: ground-based prototype
Denis Serre1,2, Paul Deba1, Laurent Koechlin1
1Laboratoire d’Astrophysique de Toulouse-Tarbes, Université de Toulouse, CNRS, 14 avenue Edouard Belin, 31400 Toulouse, France
2Leiden Observatory, Leiden University, PO Box 9513, 2300RA Leiden, The Netherlands
To be published in Applied Optics Vol. 48, Iss. 15, pp. 2811-2820 (2009)
Abstract
The Fresnel Interferometric Imager is a space-based astronomical telescope project yielding milli-arc second angular resolution and high contrast images with loose manufacturing constraints. This optical concept involves diffractive focusing and formation flying: a first ”primary optics” space module holds a large binary Fresnel Array, and a second ”focal module” holds optical elements and focal instruments that allow for chromatic dispersion correction.
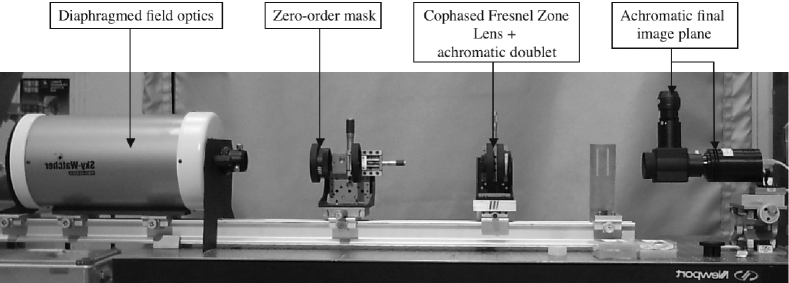
We have designed a reduced-size Fresnel Interferometric Imager prototype and made optical tests in our lab, in order to validate the concept for future space missions. The Primary module of this prototype consists of a square, 8 cm side, 23 m focal length Fresnel array. The focal module is composed of a diaphragmed small telescope used as ”field lens”, a small cophased diverging Fresnel Zone Lens (FZL) that cancels the dispersion and a detector. An additional module collimates the artificial targets of various shapes, sizes and dynamic ranges to be imaged.
In this paper, we describe the experimental setup, different designs of the primary Fresnel array, and the cophased Fresnel Zone Lens that achieves rigorous chromatic correction. We give quantitative measurements of the diffraction limited performances and dynamic range on double sources. The tests have been performed in the visible domain, = 400 - 700 nm.
In addition, we present computer simulations of the prototype optics based on Fresnel propagation, that corroborate the optical tests. This numerical tool has been used to simulate the large aperture Fresnel arrays that could be sent to space with diameters of 3 to 30 m, foreseen to operate from Lyman (121 nm) to mid I.R. (25m).
1 Introduction
The Fresnel Interferometric Imager is a space-based telescope concept providing high angular resolution images, and on sparse fields very high dynamic range. Its operational range spans the U.V, visible and I.R domains, from typ. 100 nm to 25 m. This telescope uses no reflective nor refractive devices (no mirrors, no lenses) as entrance pupil, but instead an interferometric array, involving hundreds thousands of ”basic” subapertures, i.e., mere holes punched in a large and thin opaque foil. Their positioning law, which is close to that of a Soret (or Fresnel) Zone Plate (FZP), causes focalisation by diffraction and interference.
Using Fresnel Zone Plates for high angular resolution imaging in astronomy is not in itself a novel idea. Already Baez in 1960 and 1961 [1, 2] proposed the use of FZP especially for UV and X-ray imaging, and since the 1990’s many authors have assessed their potential for visible and infrared imaging, e.g., Chesnokov in 1993 [3], Hyde in 1999 [4], Massonnet in 2003 [5]. One of the limitations of the concept usually considered is the narrow spectral bandwidth due to the high dependance of the focal length with the wavelength.
In the concept presented in Koechlin et al 2005 [6] and in this article, the improvements are directed toward two points:
1. the use of an orthogonal geometry for the FZP and correlatively that of the vacuum for its ’void’ elements instead of a transparent material provides a very high quality wavefront, e.g., typically , with strongly relaxed manufacturing and positioning constraints compared to interferometers or solid aperture devices;
2. the spectral bandwidth problem is adressed using a complimentar optical device in a focal module, forming an achromatic image onto a final focal plane (Fig. 1, following Faklis & Morris 1989 [7] and Hyde 1999 [4]).
A previous paper (Koechlin et al 2005 [6]) presents the optical principle, manufacturing tolerances and exoplanet detection capabilities of a space-based Fresnel Interferometric Imager. Another previous one (Koechlin et al 2008 [8]) presents the potential astrophysical targets and the sensibilities required for different astrophysical targets. As a prerequisite for sending an innovative kind of instrument into space is thorough validation, during the last two years and thanks to a CNES111Centre National d’Etudes Spatiales funding, we have built and tested a ground-based prototype equipped with the elements constituting a space-borne Fresnel Imager. In a recent paper (Serre, Koechlin, Deba 2007 [9]), we have published the first qualitative results of this 8 cm aperture prototype.
In the first part of this paper, we describe the elements constituting the prototype: an improved transmission binary Fresnel array, and the design of the chromatic corrector with a diverging Fresnel Zone Lens, which is a small but essential element in the focal optics. In the second part, we present measurements of the optical performances: achromatisation efficiency, angular resolution (actually diffraction limited) and dynamic range ( for this 8 cm prototype).
We compare them to numerical simulations based on Fresnel propagation. These numerical simulations can be used for the much larger Fresnel arrays that would be used in a full fledged space mission, predicting a , or better, dynamic range. These simulations are just approached in this paper, as another publication will be dedicated to them in more detail.
2 Prototype design: Fresnel Array module
This Fresnel array is a combination of opaque and void (transparent) elements. Starting with the description of the 1-Dimensional case where is the position of a point within the array, the transmission function is either (opaque) or (void). At the center, and the optical path to the focus is . From a point at position , the optical path to the focus is and the Optical Path Difference OPD compared to the point at is:
| (1) |
Assuming with an arbitrary wavelength and , the transmission function is constructed as follows:
if modulo[1] ,
if modulo[1] ,
is related to a constant phase offset, and induces a slight increase in the size of the opaque elements versus that of the void ones.
is a pseudoperiodic function with a period corresponding to the width of a Fresnel zone.
To construct a two dimensional Fresnel array, we have designed two types of geometries: a pure orthogonal one presented in Sect.A, and a radial-based one presented in Sect.B.
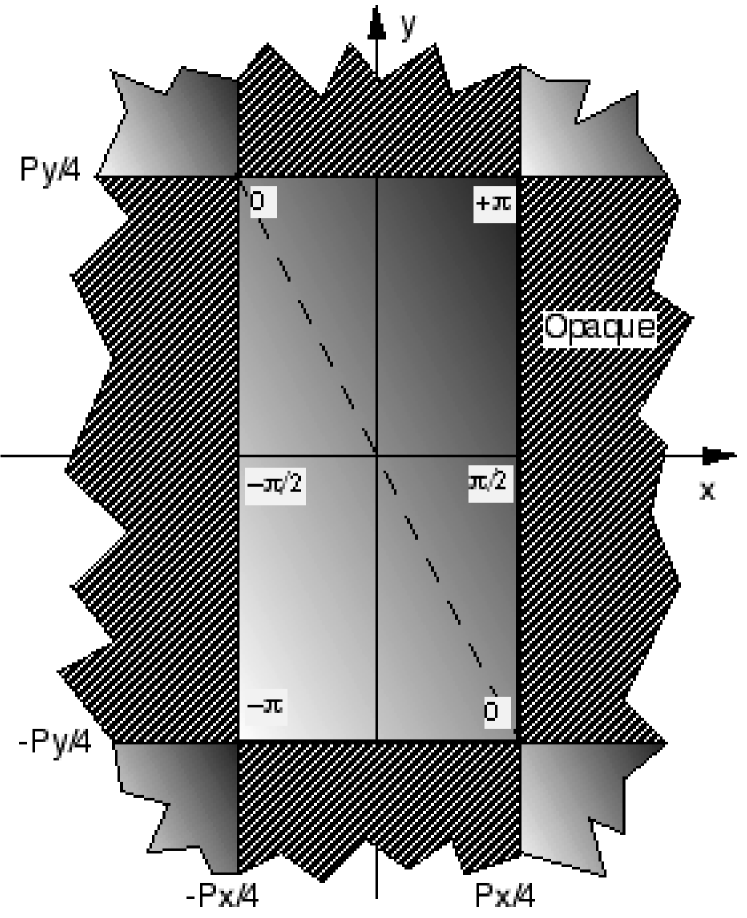
A Orthogonal development
This geometry has been used since october 2005 (see Fig. 3) and is presented in ref. Koechlin et al 2005 [6]. Defining , the two-dimensional transmission function can be constructed as:
| (2) |
or its complementary
| (3) |
This orthogonal layout has three main consequences. First, the mechanical cohesion (assming ) allows the use of vacuum instead of transparent material for the transmissive zones. Second, the aperture edges are all in the same two directions. Last but not least, the light from an incident plane wave is split by diffraction into different wavefronts: convergent, plane or divergent.
Our Fresnel Imager uses the wavefront issued from diffraction order . Seen from the focus of this wavefront, there is a phase shift from one subaperture to the next, as increments by 1. The different wavefront elements emerging from the subapertures are in phase and interfere constructively to form a compact point spread function (PSF). Outside the PSF, the field is very dark and the residual scattered light is confined into two orthogonal spikes. Defining the efficiency as the ratio between the energy in the the central peak of the PSF and the quantity of energy falling on the array, this efficiency is (Koechlin et al 2005 [6]).
The dynamic range can further be improved by apodization: modulating as a function of in the Fresnel array, or applying a transmission modulation in a pupil plane downstream, as in the Apodized Square Aperture technique (Nisenson & Papaliolios 2001 [10]). A Phased Induced Amplitude Apodization (PIAA) scheme could also be used (Guyon 2003 [11]): either by the remapping of the intensity distribution in the pupil, or (at least partly) by the application of a shift to the centers of the subapertures, this shift being applied within the plane of the array. In this case, the amplitude of this shift will depend on the distance of the individual subapertures to the center of the array, leading to a mean phase of the emerging wavefront varying from the center to the edges: a result similar to that of the first mirror in a PIAA system.
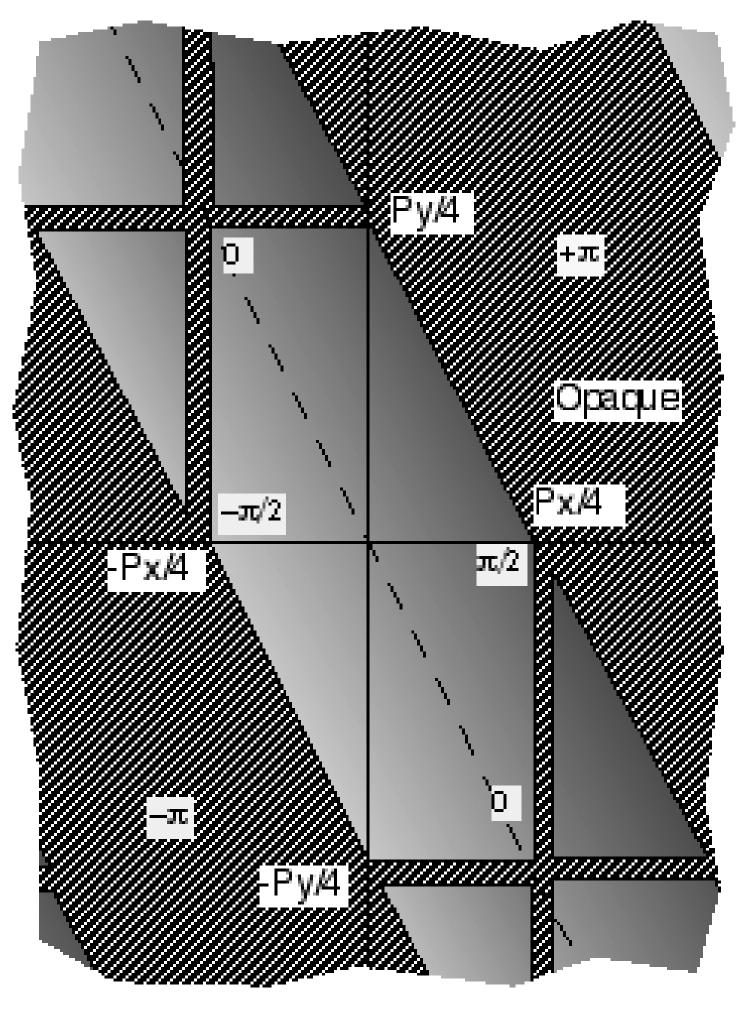
B Radial development
Using a radial development, a classical binary Fresnel zone plate arises (Soret 1875 [12]), leading to a nominal efficiency of 10%. To maintain spectral span and high wavefront quality while keeping tolerances relaxed, the transparent material which could sustain the concentric rings has to be replaced by vacuum. The rings can be maintained while affecting the dynamic range as little as possible by the use of a ”multispider” (see below).
An alternative solution could be the use of a ”photon sieve” design (Kipp 2001 [13]), but photon sieves have a low efficiency, whereas our design yields a much higher percentage of light at the focus. In addition, in our case the physical size of the underlying zones is not a problem.
The ”multispider” is constituted of bars following, in each of the two orthogonal directions, a positioning law proportional to that of a 1-dimensional Fresnel zone plate. Mathematically, the thicknesses and positions of these bars follow an orthogonal development of . is function of and negative in order to have bars thinner than the underlying Fresnel zone, and the phase shift is independent of that of the Fresnel zone plate. The effect caused by the multispider on the global transmission of the array can be minimized by adjusting its pseudoperiod to that of the Fresnel zone plate, therefore contributing to focus light.
As the transmissive zones are completely confined to the phase interval which was not the case for the pure orthogonal development (Fig. 2), the transmission rate at the first order of diffraction is higher: 60% improvement in transmission over that of an orthogonal zone plate (as the bars have to be of non-negligible thickness, the efficiency cannot reach that of a pure Soret zone plate).
The multispider also causes four orthogonal spikes, emaning from the same position but fainter than in the case of a pure orthogonal array. Reducing the individual bars from center to limb apodizes the multispider and reduces these brightness spikes.
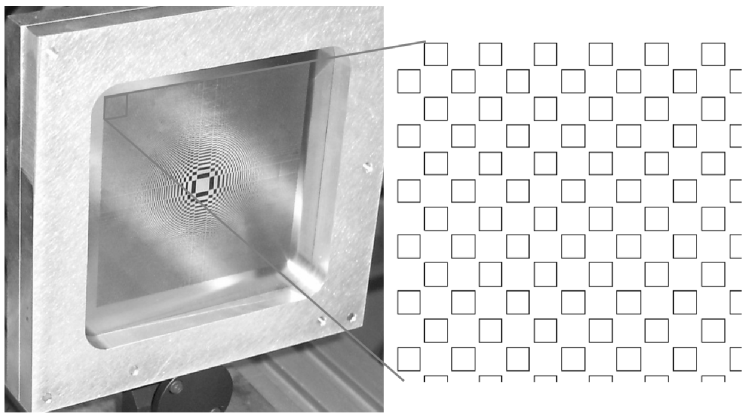
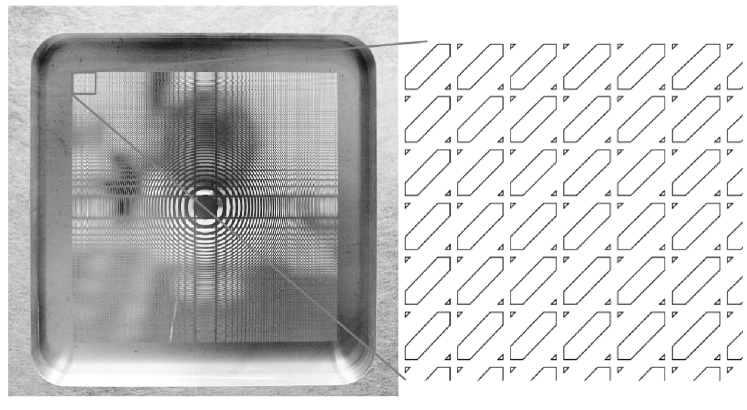
C Fresnel arrays built
3 Prototype design: focal module
A Principle and components
A Fresnel array is very chromatic, as are Fresnel zone plates. Its focal length is wavelength dependant with: , where is the diameter (or diagonal in case of a square aperture) and is the number of Fresnel zones from center to edge (corner in case of a square aperture).
The focal module (Fig. 6) features an application of the achromatisation scheme proposed by Schuppman in 1899 [14] (Fig. 1): a field lens (in our case a diaphragmed two-mirror Cassegrain-Maksutov combination) produces a pupil plane, where a cophased diverging FZL is placed, the Fresnel zones of which are being superposed to the imaged Fresnel zones of the primary array. The combination of the order of the Fresnel array and the order of the FZL adds a phase shift at the places where phase shifts have been created at Fresnel zone boundaries. The wavefront is restored to its original continuity and smoothness, completely wavelength independent, and produces an achromatic diverging beam (Faklis & Morris 1989 [7]), then made convergent by an achromatic doublet downstream (Sec. 1).
1 Principle of achromatisation
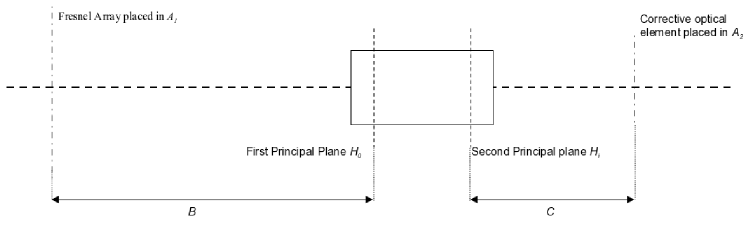
Our system is an example where chromatic aberration is actually corrected (i.e., cancelled) by combining two diffractive lenses. An achromatic mirror combination acting as ”field lens” conjugates the two diffractive lenses. The demonstration of the achromatisation principle can be done using ray transfer matrix analysis as in Hyde 1999 [4]. Here we present an equivalent demonstration, with the exception that we consider the principal planes of the field optics and demonstrate that not only the order of the FZL can be used, but other orders as well. Let a Fresnel Array be placed in plane , an optical device be representated by its principal planes and , and the corrective optical element be placed in plane ; let and be the distances and (Fig. 5). The purpose of the problem is to get constraints on the focal distance and size of the optical element placed in and the distances between the three optical elements. The ray transfer matrix can be written:
|
|
(4) |
Assuming and we get:
|
|
(5) |
Optical power can be written:
|
|
(6) |
A chromatic correction requires a power independent of wavelength. The term proportional to and must therefore be cancelled. Cancelling the term proportional to implies:
|
|
(7) |
which means that is a plane conjugate of , in our case a pupil plane. Another consequence of Eq. 7 is to make terms and be wavelength independent, meaning that there will be no transversal or angular differential magnification with wavelength. From equation 7 we deduce that:
|
and
|
(8) |
The term proportional to in Eq. 6 will be equal to 0 () only if
|
|
(9) |
Using ( being the diameter or diagonal of the Fresnel Array, the number of Fresnel zones involved and the interference order used) and considering that the optical element placed in will have a similar equation, we can write:
|
and
|
(10) |
and we get a second achromatisation condition after equation 7:
|
|
(11) |
Therefore, a solution to correct for the chromatism induced by the Fresnel Array placed in is to place in a pupil plane a Fresnel Zone Lens with an equal number of zones , used at its order -1 and whose diameter is that of the imaged Fresnel Array. Here we join a conclusion at which Faklis & Morris [7] arrived at in the field of chromatic correction of a holographic imaging process. Another possibility would be the use of the FZL at orders -2, -3… while keeping constant and using numbers of Fresnel zones. But, as the efficiency would be lower for (Faklis & Morris 1995 [15]), the only reason for using it would be the limitations of manufacturing capabilities of the most external zones. In that case, a solution would be to manufacture the external zones for an order of interference -2, -3… while keeping the central zones manufactured for an order -1.
2 Compromise between wavelength bandwidth and size of field of view
The geometric correction is rigorous in the sense that the correction done by the FZL is done for all the wavelengths intercepted. But since the field optics has a finite diameter:
- the wavelength bandwidth will be maximum for an on-axis source;
- but, for a source sufficently off-axis so that its image at the nominal wavelength formed by the FZP is at the edge of the field lens, the spectral bandwidth will be close to 0 if we accept no vignetting effect. Assuming being the diameter of the field of view in number of resolution elements222A resolution element has an angular extension for a square pupil of diagonal , and for a circular pupil of diameter . and the wavelength focussed on the field optics, the compromise between the size of the field of view and the wavelength bandwidth can be written:
| (12) |
| (13) |
with the linear size of the resolution element on the field optics (or in the case of a square aperture), still being the diameter (or diagonal in case of a square aperture) of the FZP and the number of Fresnel zones from center to edge (corner in case of a square aperture). For larger fields or smaller or greater wavelengths, the chromatic correction will still be rigourous, but, as the beam will be vignetted by the field optics, the luminosity and image quality will decrease, but may still be acceptable depending on the applications. A detailed discussion of this limitation can be found in section 3 of Koechlin 2008 [8].
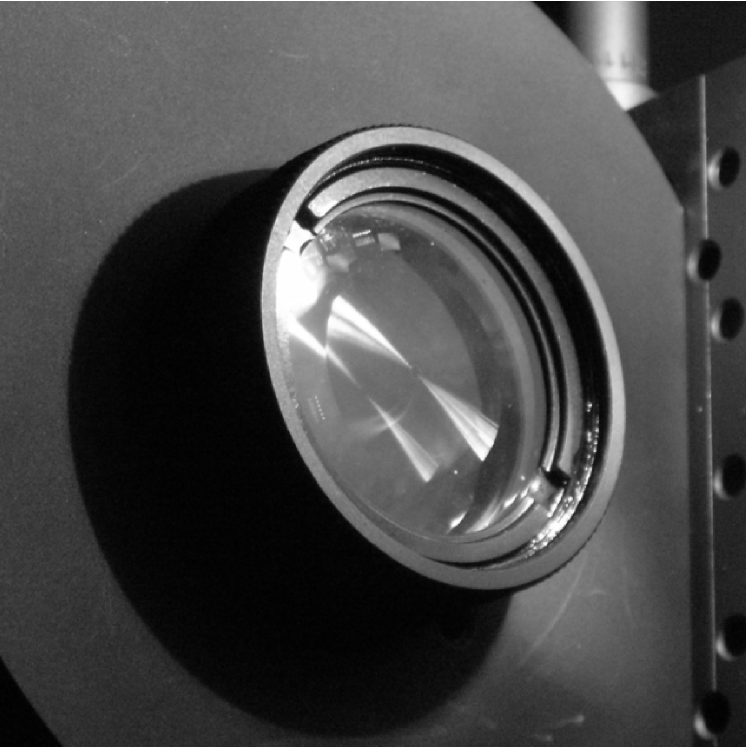
As the beam is strongly compressed from the Fresnel array to the pupil plane formed by the field optics, the blazed secondary and convergent optics can be of modest size. In a large space-based instrument, the beam compression ratio between the Fresnel Array and the correcting FZL could reach 100 or more, the limiting parameter being the manufacturing possibilities of the smallest patterns near the edge of the FZL. In our prototype, we use a FZL etched on a fused silica plate and a compression ratio of 7, because the primary array is already small.
This FZL is blazed for high efficiency; close to 100% at the blaze wavelength -excluding reflecting effects on entrance and exit surfaces- which improves the overall transmission of the instrument. Although theoretically perfect, this correction is bandpass limited to in practice, mainly due to the blaze angle mismatch of the secondary Fresnel lens with non optimal wavelengths (see below).
B Design of the mainpiece: chromatic corrector
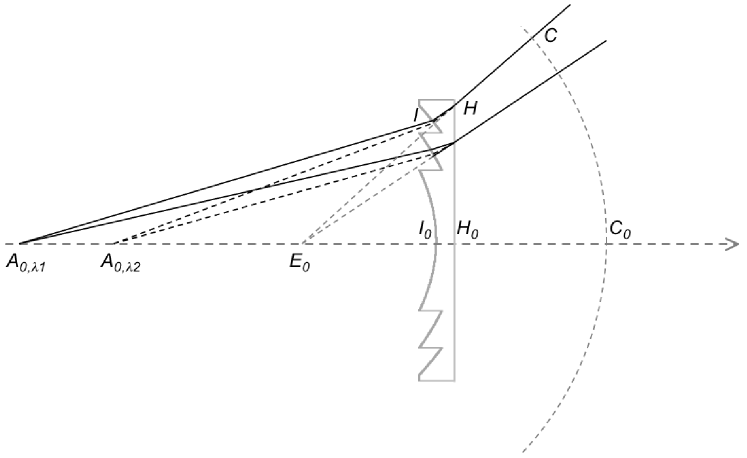
The role of the FZL is to replace the images formed by the field optics and situated at different wavelength dependent positions , … by a virtual wavelength-independent image at position (Fig. 7). The application of the chromatic correction presented in Sec. 1 constrains a number of parameters for this lens: size, number of zones, distance between the FZL and the wavelength-dependent images re-formed by the field optics.
For a given ray, the light emerges from focus , enters the optical medium of index at point and re-emerges at point . From the Fermat principle, the following relation arises between the different segments of optical path (Fig. 7):
| (14) |
being the index of the Fresnel zone. The jigsaw profile of the lens is given by the locus of points .
We can solve Eq. 14 for an optimum wavelength ; the parameters that are fixed or can be obtained, are:
– : from the primary array focal length at , the field optics focal length, and the relative position between these two optical elements, the position of the primary focus at reimaged by the field lens can be calculated, as can be the position of the pupil plane of the Fresnel imager, where the FZL is placed.
– zone index : as the number of zones of the FZL is similar to that of the Fresnel array, for a given , the zone index () can be calculated.
– : the optical index at of the material in which the diverging FZL is engraved.
– : as the FZL must fill the pupil plane, its size is known, and its number of zones being equal to that of the primary array its focal length too: therefore, knowing the position of , the position of can be calculated.
– : the coordinates of points can be fixed by sampling the back surface (flat in our case) of the lens.
– : the value of can be calculated by the application of Eq. 14 on the optical axis.
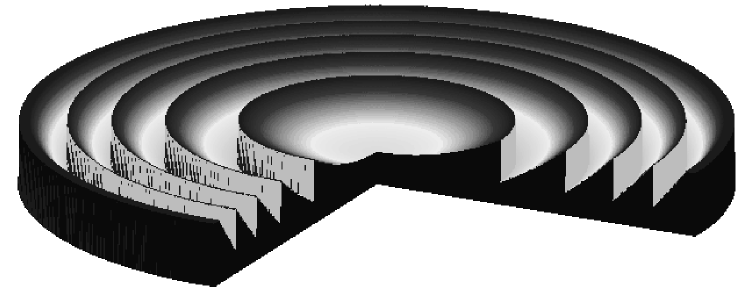
– The only unknown parameters remaining in Eq. 14 are the coordinates of point . For each point , the coordinates of the corresponding point are calculated, yielding as result the jigsaw profile of the FZL. This has been done numerically for a thinly sampled profile, then sent for engraving on fused silica.
We have commissioned SILIOS Technologies for the realization of two 16 mm diameter and 5 mm thick FZL, blazed at 600nm with maximum depth profile 1335 nm, sampled respectively with 32 and 128 depth levels (Fig. 8). The level depth precision is 6 nm PTV, to be added to the discretization error: 6 and 22 nm respectively. The depth error is larger at the edge. With the minimal engraving width being 2 m, and the narrowest Fresnel zone 34 m, there can be only 16 levels within, resulting in a PTV error of for the outermost fraction of the beam.
As the nominal profile depth varies with , the FZL built are optimized only for nm. The nominal profile also varies with , however for varying from 500 to 700nm the optical index of the fused silica varies from 1.4625 to 1.4552 (0.5% difference), which is much less than the variation due to the wavelength itself: the height of the steps is , thus consequences of the dispersion due to the material are negligible.
Nevertheless, the profile mismatch for does not cause chromatic aberration, it causes a loss of efficiency and dynamic range for wavelengths unadapted to the blaze angle. This issue is desribed in details below.
4 Numerical simulations and Optical tests
We have made numerical simulations by Fresnel propagation of the diverging FZL alone and of the complete prototype, including the primary array, field optics, zero order blocking mask, corrector blazed FZL with its discretization due to the manufacturing process, and final converging lens. We have also tested optically the Fresnel imager prototype on various optical sources for achromaticism, dynamic range and resolution. As the prototype is confined to a clean room, only artificial sources placed at the focal plane of a collimator have been used.
A Computed Efficiency of the Fresnel diffractive lens
Two important parameters influence the efficiency of the chromatic correction FZL: the mismatch of the wavelength used and the discretization of the profile slope levels ocurring from the manufacturing process. Several authors have studied these influences: Swanson [16] particularly studied it for the efficiency dependence with the number of levels, moreover developing the manufacturing process; Hasman [17] for the depth error consequences, and Levy [18] for the analytic theory of spherical and cylindrical lenses. Faklis & Morris [15] studied the evolution of efficiencies with wavelength (for multi-order lenses, including for first diffraction order lenses). For any wavelength, Eq. 14 was:
| (15) |
For one wavelength and one type of discretized profile, the passing through all the points sample the emerging wavefront shape. We can then calculate the corresponding PSF by Fresnel propagation, and compare the energy in the central peak with the energy that would be confined to the central peak of a perfectly spherical wavefront. The ratio of these two quantities is defined as the efficiency of the FZL.
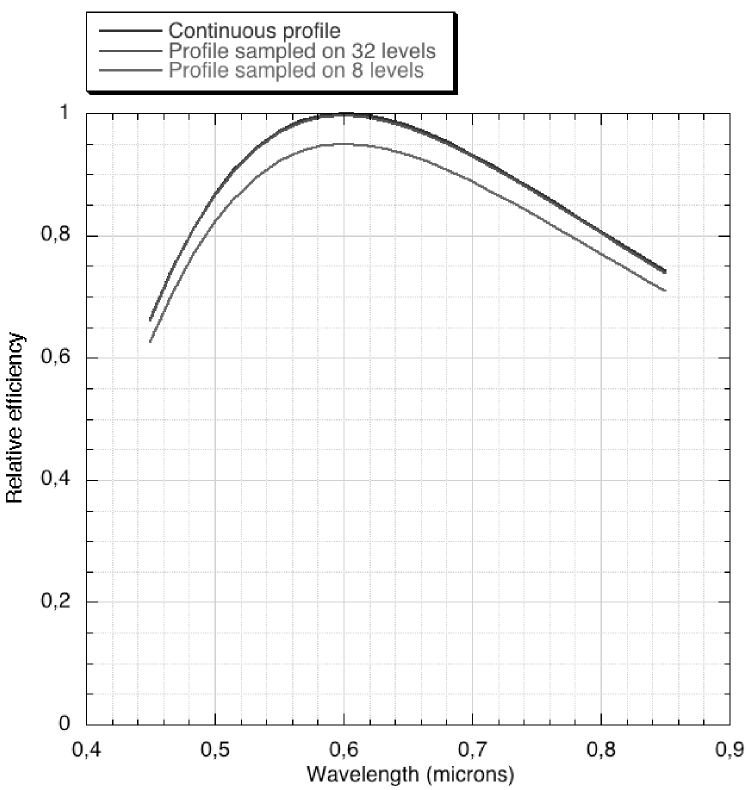
The computed efficiency as a function of wavelength for a cophased diverging FZL blazed at = 600 nm is plotted in Fig. 9. This is in agreement with results from Hasman (Tab. 1) and from Faklis & Morris 1995 [15].
| Profile type | Ccomputed efficiency | Theoretical limit |
|---|---|---|
| Continuous profile | 100.00% | 100.00% |
| Profile sampled on 128 levels | 99.98% | 99.98% |
| Profile sampled on 32 levels | 99.7% | 99.7% |
| Profile sampled on 16 levels | 98.7% | 98.7% |
| Profile sampled on 8 levels | 95.0% | 95.0% |
| Profile sampled on 4 levels | 81.2% | 81.1% |
B Chromatic correction
The targets for optical tests are pinholes, single mode optical fibers or extended sources, illuminated with narrowband or broadband spectra, .
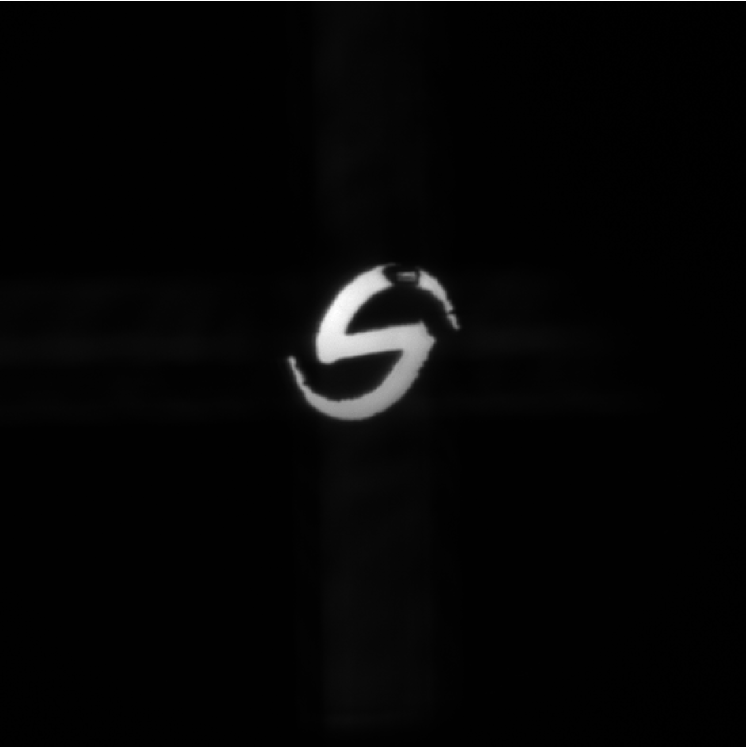
In Fig. 10 we show the acquired image of a galaxy-shaped target, cut out from a metal sheet and non uniformly illuminated with a halogen source. Although the clipping has been done with a UV laser machine tool, the very small linear dimensions of the target (450m) result in a rough aspect. The product of the halogen spectrum and CCD detector sensitivity cover from 400 to 950 nm. The angular size of this ”galaxy” is 72 arcsec from limb to limb, the diffraction limit of the square aperture prototype being arcsec at 600nm. No defocus or differential magnification can be seen, qualitatively illustrating the efficiency of the chromatic correction principle and realization.
C Angular resolution
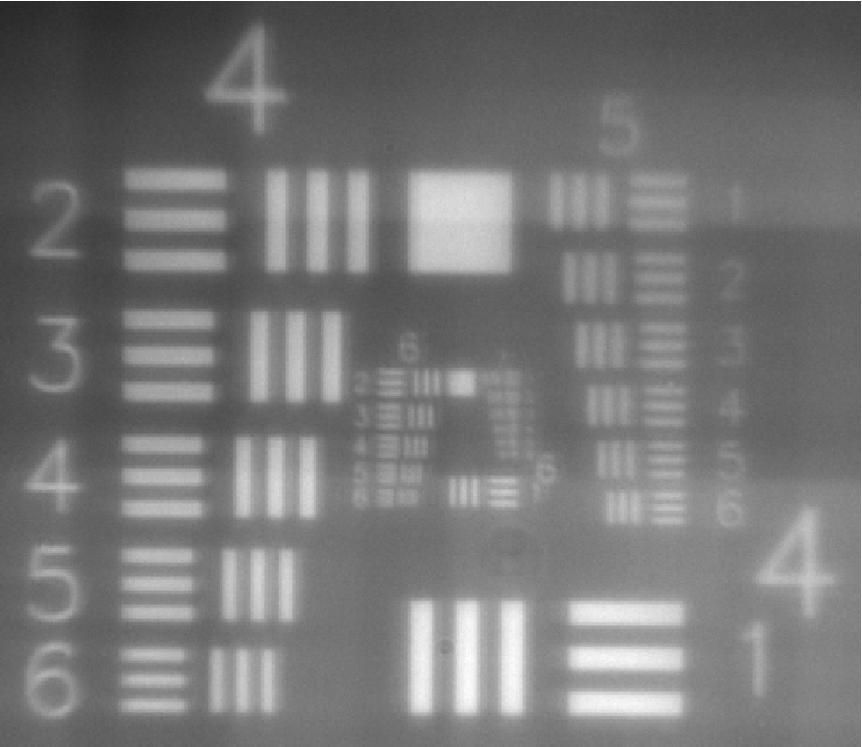
In Fig. 11 we show the acquired image of a standard USAF resolution test target illuminated with a white led. The group number ’6’ associated to element number ’4’ (number of line pairs=90.5) means a 1.52 arcsec () angular separation as seen from the Fresnel Imager prototype.
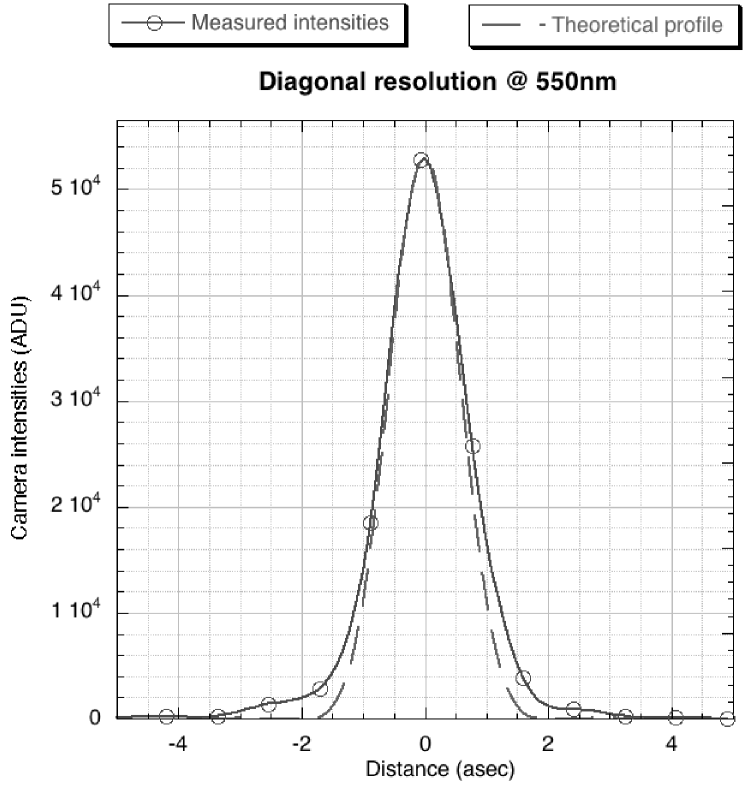
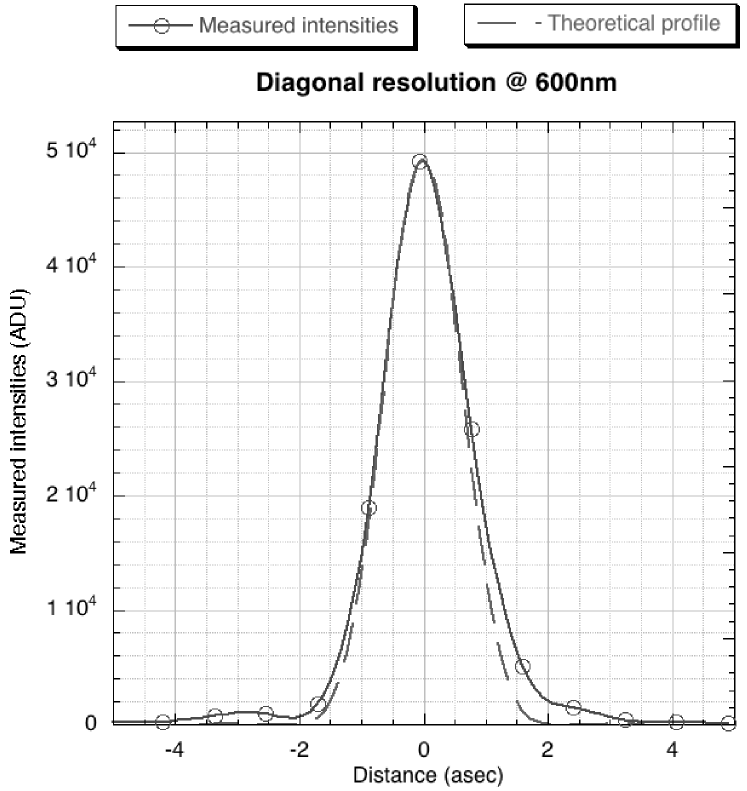
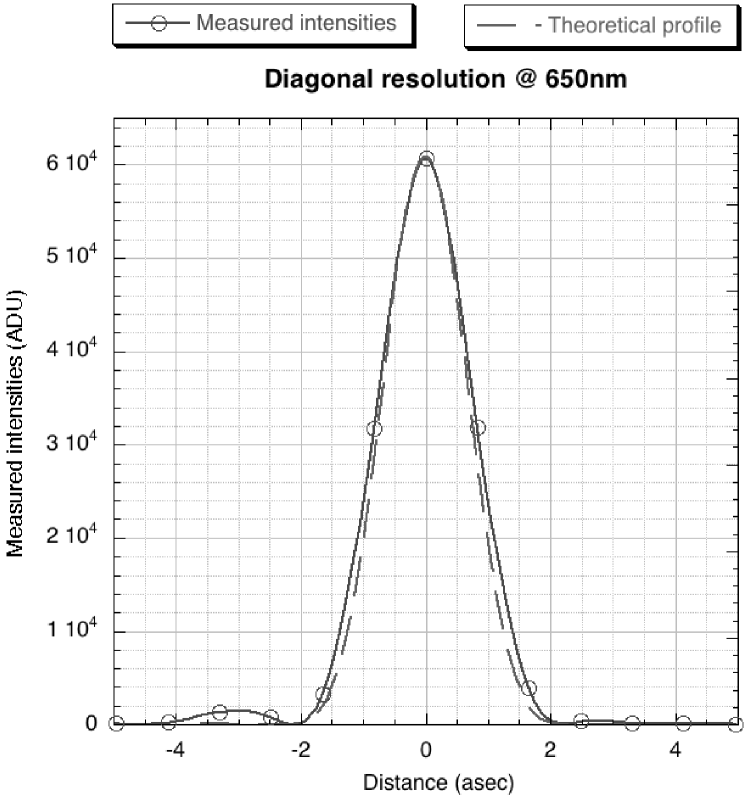
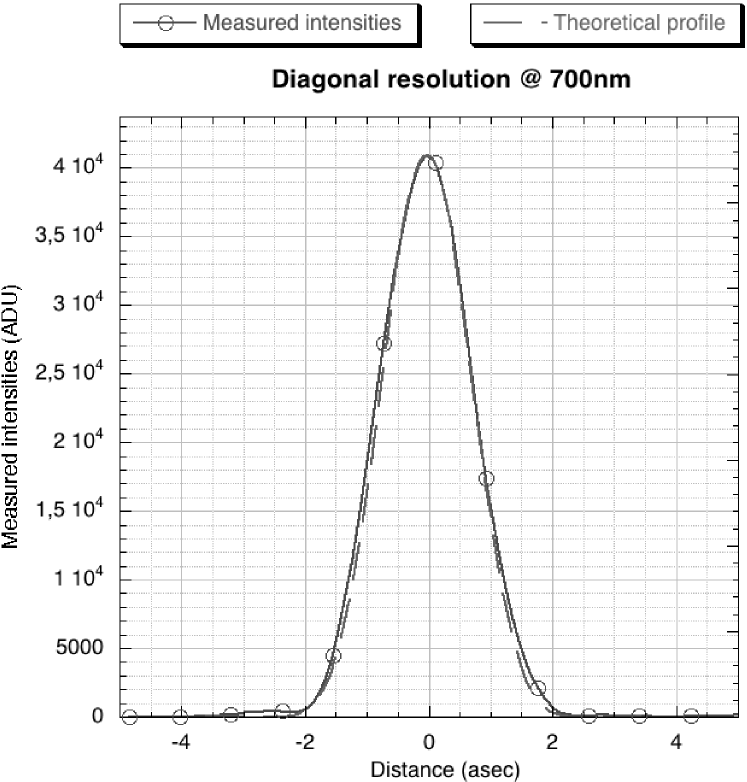
We have also measured the angular resolution of the Fresnel Imager, using a pinhole (angular diameter seen by the prototype: 0.77 arc second), illuminated with a halogen source filtered with 50nm bandwidth filters centered on 550, 600, 650 and 700 nm. The prototype is diffraction limited at all these wavelengths. The measurements are summarized in Fig. 12.
D Flux transmission
We have numerically simulated the image resulting from the Fresnel imager prototype by plane-to-plane Fresnel propagation. We have taken into account all its optical elements: the Fresnel array, field lens, zero order mask, blazed FZL with its manufacturing charcacteristics and the final achromatic doublet. According to these numerical simulations, our prototype yields a 4.0% transmission when equipped with an orthogonal primary array, whereas our new multispider Soret zone plate as primary array yields a transmission of 6.3%.
Using the CCD, we have measured a flux ratio of 1.23 between the two types of Fresnel arrays.
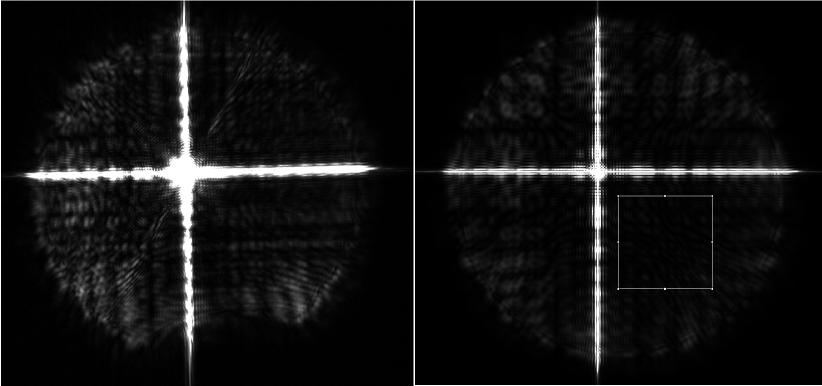
E Dynamic range
Fig. 13 shows the comparison between the simulated and acquired PSFs of the multispider Soret zone plate presented in Sec. B. We define the ”dynamic range” as the ratio between the ”clean” field mean level and the PSF peak maximum. With the multispider Fresnel array, the dynamic range varies from 3 to 1 , depending on the quadrant chosen in the image produced by the prototype and its extend, while being 1 in the numerical simulation.
The Fresnel arrays in our prototype only have 116 Fresnel zones, are not apodized, and the zero order mask is wide compared to the resolution of the field optics. This zero order mask is placed where the interference zero order (plane wave) from the primary array is focussed by the field optics. It improves the dynamic range by blocking the uniform field illumination that would result otherwise from order zero. However, if it’s too large, it causes central obstruction in the order +1 beam. Thus, with our present prototype high dynamic range can not be achieved closer than 10 resolution elements from the central peak of the PSF.
With a higher number of Fresnel zones and an adapted zero order mask, numerical simulations with a non apodized square aperture and 700 Fresnel zones show that a dynamic range is obtained over nearly the entire field, except the four thin spikes, at a five resolution elements radius from the center of the PSF peak. With a 700 zones apodized array, the dynamic range reaches as close as two resolution elements from center in narrowband (), but the overall transmission is reduced by a factor of 5. We are working on a compromise, and are considering the implementation of a PIAA setup.
5 Conclusion
At Laboratoire d’Astrophysique de Toulouse-Tarbes, we have constructed a prototype, illustrating the efficiency of our Fresnel array concept. This prototype uses a lightweight metal Fresnel array as main aperture optics and efficiently corrects the chromaticism, using a custom built FZL. This results in diffraction limited images, highly contrasted on compact sources.
We have also developed a complete tool for numerical simulation and assessment of large Fresnel imagers.
We are building a generation II prototype, featuring a 20 cm diameter, 700 zone Fresnel array, and the associated focal instrumentation module. This Gen II prototype will be placed in parallel to the 19-meter long tube of a refractor on an equatorial mount, the 76 cm refractor at Observatoire de Nice. For the next two years, we plan to test the limits of this concept on highly contrasted astrophysical targets.
A phase zero study is also under progress at Centre National d’Etudes Spatiales. It has shown that systems using thin foil Fresnel arrays up to 15-meter apertures can be built for space with “off the shelf” technology. It has also been shown that the guiding and navigation control tolerances are fairly within reach of present technology for a Two-Spacecraft formation flying Fresnel Imager orbiting the L2 Sun-Earth Lagrangian point. Of course, funding, and consequently validation of the scientific program is the main issue. Following the Cosmic Vision proposal (Koechlin 2008 [8]), a working group is being set up to define the astrophysical themes that can be addressed with a 4-m to 40-m aperture space-based Fresnel Imager. Collaborations are welcome !
Part of this work was funded by Centre National d’Etudes Spatial and Thales Alenia Space. The authors wish to thank the anonymous Referee for his/her remarks, and Lars E. Kristensen for re-reading the article.
References
- [1] A. Baez. A Self-supporting Metal Fresnel Zone-plate to focus Extreme Ultra-violet and Soft X-Rays . Nature, 186:958, June 1960.
- [2] A. Baez. Fresnel zone plate for optical image formation using extreme ultraviolet and soft x radiation. Journal of the Optical Society of America, 51(4):405–412, 1961.
- [3] Yuri M. Chesnokov. A space-based very high angular resolution telescope. Space Bulletin, 1(2):18–21, 1993.
- [4] Roderick A. Hyde. Eyeglass. 1. very large aperture diffractive telescopes. Applied Optics, 38(19):4198–4212, 1999.
- [5] Didier Massonnet. Un nouveau type de télescope spatial - Brevet CNES - ref. 03.13403, 2003.
- [6] Laurent Koechlin, Denis Serre, and Paul Duchon. High resolution imaging with fresnel interferometric arrays: suitability for exoplanet detection. Astronomy & Astrophysics, 443:709–720, 2005.
- [7] Dean Faklis and George Michael Morris. Broadband imaging with holographic lenses. Optical Engineering, 28(6):592–598, 1989.
- [8] L. Koechlin, D. Serre, P. Deba, R. Pelló, C. Peillon, P. Duchon, A. I. Gomez de Castro, M. Karovska, J.-M. Désert, D. Ehrenreich, G. Hebrard, A. Lecavelier Des Etangs, R. Ferlet, D. Sing, and A. Vidal-Madjar. The fresnel interferometric imager. Experimental Astronomy, 23:379–402, March 2009.
- [9] Denis Serre, Laurent Koechlin, and Paul Deba. Fresnel interferometric arrays for space-based imaging: testbed results. In Howard A. MacEwen and James B. Breckinridge, editors, UV/Optical/IR Space Telescopes: Innovative Technologies and Concepts III, in Proceedings of the SPIE., volume 6687 of Presented at the Society of Photo-Optical Instrumentation Engineers (SPIE) Conference, page 66870I, September 2007.
- [10] P. Nisenson and C. Papaliolios. Detection of Earth-like Planets Using Apodized Telescopes. The Astrophysical Journal, 548:L201–L205, February 2001.
- [11] O. Guyon. Phase-induced amplitude apodization of telescope pupils for extrasolar terrestrial planet imaging. Astronomy & Astrophysics, 404:379–387, June 2003.
- [12] J. L. Soret. Sur les phénomènes de diffraction produits par les réseaux circulaires. Archives des Sciences physiques et naturelles, 52:320–337, 1875.
- [13] L. Kipp, M. Skibowski, R. L. Johnson, R. Berndt, R. Adelung, S. Harm, and R. Seemann. Sharper images by focusing soft X-rays with photon sieves. Nature, 414:184–188, November 2001.
- [14] L Schupmann. Die medial-fernrohre: eine neue konstruktion fr grosse astronomische instrumente. Teubner B G, 1899.
- [15] Dean Faklis and George Michael Morris. Spectral properties of multiorder diffractive lenses. Applied Optics, 34(14):2462–2468, 1995.
- [16] Garry J Swanson and Wilfrid B Veldkamp. Diffractive optical elements for use in infrared systems. Optical Engineering, 28(6):605–608, 1989.
- [17] E Hasman, N Davidson, and A A Friesem. Efficient multilevel phase holograms for lasers. Optics Letters, 16(6):423–425, 1991.
- [18] Uriel Levy, Devid Mendlovic, and Emanuel Marom. Efficiency analysis of diffractive lenses. Journal of the Optical Society of America, 18(1):86–93, 2001.
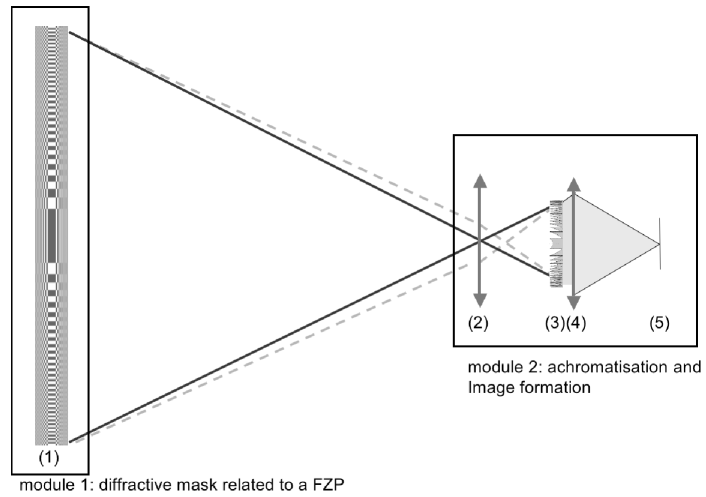
In the second module, field optics (2) form a pupil plane (3), where a diverging cophased Fresnel Zone Lens (FZL) is placed. Theoretically, the emerging beam is perfectly achromatic (Faklis & Morris 1989 [7]), but divergent. A lens (4) is placed to make it converge. The final achromatic image is formed onto plane (5).
 |
 |