How proteins squeeze through polymer networks: a Cartesian lattice study
Abstract
In this paper a lattice model for the diffusional transport of particles in the interphase cell nucleus is proposed. The dynamical behaviour of single chains on the lattice is investigated and Rouse scaling is verified. Dynamical dense networks are created by a combined version of the bond fluctuation method and a Metropolis Monte Carlo algorithm. Semidilute behaviour of the dense chain networks is shown. By comparing diffusion of particles in a static and a dynamical chain network , we demonstrate that chain diffusion does not alter the diffusion process of small particles. However, we prove that a dynamical network facilitates the transport of large particles. By weighting the mean square displacement trajectories of particles in the static chain network data from the dynamical network can be reconstructed. Additionally, it is shown that subdiffusive behaviour of particles on short time scales results from trapping processes in the crowded environment of the chain network. In the presented model a protein with 30 diameter has an effective diffusion coefficient of in a chromatin fiber network.
I Introduction
To accomodate the genome within the the cell nucleus, DNA is organized into chromatin. of the interphase cell nucleus are filled with a dense network of chromatin fibers. In recent years, direct visualization of chromatin structure and dynamics in live cells has been achieved through significant advances in the field of microscopy and molecular biology levi. The growing awareness of thermal fluctuations and their impact on the chromatin dynamics has modified the formerly common picture of an interphase nucleus which contains randomly arranged, but static chromatin.
In marshall specific chromosome sites were tagged in living cells of Saccharomyces cerevisiae with green fluorescent protein and the motion of interphase chromatin was measured at high resolution and in three dimensions. In vazquez chromosome motion was tracked in Drosophila spermatocyte nuclei by 3D fluorescence microscopy. A highly dynamic chromosome organization was found governed by two types of motion: a fast, short range component over a 1-2 time scale and a slower component related to long range chromosome motion within the nucleus. The motion patterns are consistent with random walks. These reports and others chubb reveal that the motion of specific chromatin regions is Brownian. However, this motion is limited to a nuclear subregion, i.e. a given chromatin segment is free to move within only a limited subregion of the nucleus.
Diffusive processes in the cell play a key role in keeping the organism alive riggs; richter: Molecules transported through cell membranes, drugs on their way to respective protein receptors, and proteins interacting with specific DNA sequences constituting all of the biological functions of DNA berg; ptashne are diffusion controlled reactions. Furthermore, proteins approaching their specific target sites on DNA are transported by diffusion or even facilitated diffusion. However, the diffusional transport of molecules in the interphase cell nucleus is fundamentally different from the normal kind of diffusion which a molecule undergoes in a homogeneous fluid where the mean square displacement of a molecule behaves linear in time , with as the diffusion coefficient. In the cell nucleus the motion of proteins is strongly influenced by the presence of the ”sticky tangle” of chromatin fibers due to steric obstruction and thermal fluctuations of the fibers. Fluorescence correlation spectroscopy (FCS) studies have shown obstructed diffusion of autofluorescent proteins wachsmuth; banks. Obstructed diffusion or subdiffusion is characterized by with the anomalous diffusion exponent . Other FCS measurements indicate that most of the nuclear space is accessible to medium sized proteins by simple diffusion and that there is no preference for interchromosome territory channels weidemann. For small proteins up to the size of eGFP-tetramers the entire intranuclear chromatin network is freely accessible dross. It is still a matter of extensive discussion to what extent macromolecular mobility is affected by structural components of the nucleus. This question was adressed in our recent work wedemeier1; wedemeier2 where we investigated the diffusional transport of nonbinding and binding proteins in static polymer chain networks. However, it is known that nuclear constituents much larger than the average mesh size of the chromatin network can move in a random walk fashion goerisch. This implies that the fluctuations of the network create transient openings for larger objects.
Therefore, we have developed a theoretical description of the diffusion of nonbinding proteins in a dynamical polymer chain network.
Theroetical descriptions of dynamical polymer chain networks have already been given zhang; however, they did not incorporate realistic structures of chromatin fibers. In the following, the chromatin fibers are approximated by flexible polymer chains. Proteins diffusing through the fiber network are referred to as particles. We investigate in detail how the mean square displacement (msd) of diffusionally transported particles of various sizes depends on the three dimensional geometry of static and dynamical networks of chromatin fibers and their density in the cell nucleus. The results from simulations in both network types are compared. We then prove by statistical analysis of the maximum mean square displacement of a particle that a dynamical chain network facilitates the diffusional transport of large particles.
The chromatin network in the cell nucleus during the interphase is modeled on a three-dimensional lattice applying a simplified version of the bond fluctuation method carmesin, the single site model, in combination with a Metropolis Monte Carlo procedure metropolis. This minimizes computational time and effort. The bond fluctuation model (BFM) was introduced as a new effective algorithm for the dynamics of polymers by Carmesin et al. carmesin and provides a very effective means to simulate the dynamic behaviour of, e.g., dense polymer melts sommer1; sommer2. In section 2 the lattice for chain construction and particle diffusion is presented. A brief overview of the particles of different sizes is given, reflecting the diffusing proteins in the cell nucleus. The simulation of chain dynamics of one single chain is described. Afterwards, the simulation of chain dynamics of dense chain networks, a combination of BFM and MC, is briefly explained. In section 3 the translational diffusion of the chains is observed. It is verified that the dense networks investigated here display a semidilute behaviour and exhibit Rouse dynamics. Finally, in section 4 the mean square displacements of particles of various sizes in static and dynamical networks are compared. It is shown that the diffusion of large particles is facilitated by a dynamical chain network and how data of the dynamical chain network can be reconstructed from data of the static chain network. Moreover, it is demonstrated that an anomalous behaviour of the mean square displacement of the particle on short times is caused by a trapping process of the particle in the crowded environment of polymer chains. Section 5 summarizes the obtained results.
II The model system
The system is contained in a cubic lattice. To prevent boundary effects due to the lattice walls, periodic boundary conditions are applied for both the particle motion and the chain construction.
II.1 Simulation of particle movement
In general studies tracer particles with masses of 27 to 282 kD were used to study diffusional transport banks. In our model system we use three different particle sizes: one occupied lattice site (small), a cube (medium), and a cube (large). The movement of the particle is modeled by a random walk. Particles are allowed to visit only unoccupied lattice sites. If a particle collides with a chain, it is reflected to the last visited lattice site. This counts as a time-step, even though the move was unsuccessful. The initial position is sampled randomly among nonoccupied lattice sites. Then, a number of random trajectories (typically of the order of ) are simulated to deliver the ensemble averages.
II.2 Chain dynamics
The chromatin fibers are modeled as chains consisting of monomers connected by freely jointed segments. Monomers are represented by occupied lattice sites. No lattice site is allowed to be occupied more than once, otherwise there exists no pair interaction between monomers. This corresponds to a real chain with excluded volume effect in a good (more precisely: athermal) solvent. Allowed bonds between two adjacent monomers are taken from the set of all component permutations and sign inversions of two bond vectors, , inducing a bond length of or . Chain movements are simulated with a combined version of the BFM and MC, which is discussed in detail in wedemeier1.
II.2.1 Single chain dynamics
Although this paper is dealing with the diffusion of particles inside a chain network, it is instructive to first analyze the dynamics of single chains, in order to obtain the time scales which are required to simulate ensemble averages of the network. Thus, we investigated the dynamical behaviour of single chains of different lengths , . Initially, a straight line of connected neighbouring lattice sites is placed into the lattice and relaxed into its equilibrium conformation. During one time step (sweep) of the MC procedure, the monomers of the chain sequentially undergo a trial-move. If this move hits an occupied lattice site or violates the bond length restriction, the chain monomer is set back to its previous position and the next monomer is addressed.
II.2.2 Chain network
The combined BFM and MC procedure is applied to an initial conformation of chains folded into cubes. See wedemeier1 for a detailed description of the cube construction. The relaxed conformation then serves as the initial conformation for investigations of the dynamical network. Similarly to the case for single chains, all monomers of the chains, each of length , are touched during a single time step (sweep) of the MC procedure.
III Results - Chain dynamics
III.1 Single chain
The center of mass movement over time is investigated for different single chains of chain length , . is the center of mass position vector of one chain at time . Results are the average of 50 independent runs. The translational diffusion coefficient of the chain is obtained from the mean squared center of mass displacement :
| (1) |
First it was verified that the translational diffusion coefficient decreases roughly inversely proportional to the chain length ,
| (2) |
This is to be expected, because our simulations do not consider effects of hydrodynamic correlations (immobile solvent approximation) which should lead to the observed (Rouse) scaling rouse of the diffusion coefficient. It is generally assumed that these hydrodynamic effects are playing a less important role inside dense polymeric systems, because they are screened on rather short length scales. Their omission in the present work is therefore justified, considering other, more severe approximations which come along with our coarse grained model.
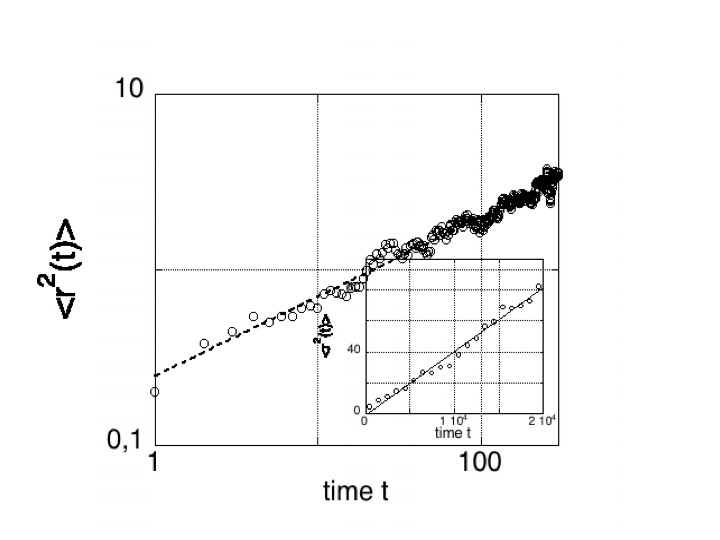
The mean square displacement of a single chain monomer is linear in time on long time scales (Fig. 1, inset)
| (3) |
On short time scales, however, an anomalous behaviour of that quantity is found,
| (4) |
with an anomaly parameter of 0.45 (Fig. 1). It can be shown that in case of the ideal chain approximation, the anomaly parameter of such a monomer should yield approximately 0.5 grossberg on short time scales. This is a result of the restricted movement of the monomer due to its bonds with other chain monomers. The observed anomaly parameter of is a little smaller, which we attribute to additional excluded volume restrictions of our real (= non-ideal) chain model. On long time scales, of course, each monomer has to follow the movement of the chain center of mass and hence displays the same diffusion behavior.
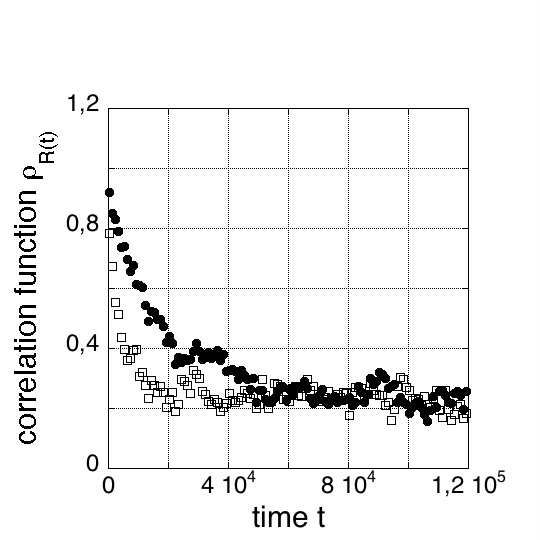
For the simulation of dynamical dense chain networks it is important to know the relaxation times of the chains involved in the simulation, because proper ensemble averages require simulation times much larger than these relaxation times. The slowest relaxation mode of an ideal linear chain is the relaxation of its end-to-end vector , also called Rouse time . It is obtained through the decay of the time autocorrelation function
| (5) |
To extract the decay time, it is sufficient to assume a single mode exponential decay of the form
| (6) |
In this way, the Rouse time of a single chain with length was found as , and for a chain of twice the length, , the result was obtained (Fig. 2). The Rouse time of an ideal chain can be shown to scale with the square of the number of monomers rubinstein,
| (7) |
and the same behavior is approximately true for real chains. Thus, an important rule of thumb for simulating systems of different chain lengths is that the relaxation time of the system scales with the square of the chain length.
III.2 Chain networks
In order to characterize the chain network, it is required to verify in which density regime the system exists. Our chain model is consistent with a real chain inside an athermal solvent, and hence the fully relaxed end-to-end distance of a single chain should yield an average of , where is the average bond length and the universal scaling exponent, . This yields the overlap concentration of the system in athermal solvent rubinstein
| (8) |
Hence, we obtain and . Volume fractions below this overlap concentration deliver dilute solutions (in which single chains remain unaffected by other chains), while volume fractions above that threshold deliver semi-dilute solutions. The volume fractions in our system were between and , above the overlap concentration, hence the system is in the semi-dilute regime. The Rouse scaling of the diffusion coefficients remains valid under these conditions, but the pre-factors are affected by inter-chain interactions, i.e. the chain diffusion coefficient differs from the single chain case discussed above.
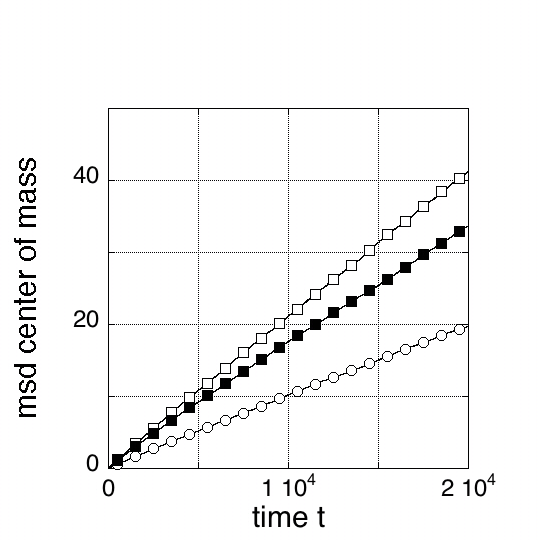
The center of mass movement of a chain inside dense networks with different geometric volumes , and different chain lengths , was monitored over the time . The data was averaged over 10 simulation runs. The denser the chain network, the slower is the movement of the chains and the smaller is the translational diffusion coefficient of the chains (Fig. 3). For a chain network of 6.4% volume and chains with length a translational diffusion coefficient of is obtained, whereas chains of length with the same volume yield a translational diffusion coefficient of (Fig. 3). Hence, the Rouse scaling law as for single chains (see equation (2)) is reproduced, though with a different pre-factor,
| (9) |
a
b
IV Particle diffusion in dynamical chain networks
In the following the occupation volume of the lattice is either computed as the geometric volume or the effective volume. The geometric volume is defined as the total number of occupied lattice sites. The effective volume is defined as the space which is blocked to a particle of given size. Hence, the effective volume of the chains on the lattice depends on the particle size and the chain conformation. For a particle consisting of one occupied lattice site, the geometric volume of the chain equals its effective volume.
IV.1 Coupled dynamics of particle and chain diffusion
During one time step of the MC procedure, an entire sweep over the chains was carried out, as described in section II.2, and additionally a single move of the walker. This setup corresponds to the choice of identical diffusion coefficients of the walker (protein) and a single (non-connected) statistical chain monomer. In other words, a chain monomer and a protein were assumed to be of roughly the same size. This does not impose any fundamental restrictions, because more general situations could be obtained after a corresponding rescaling of the diffusion coefficients. In order to increase the efficiency, fifty walkers were moving through the network at the same time. They were independent of each other, i.e. there was no walker-walker interaction, to simulate the ensemble average of single walker systems. The initial positions of the walkers were randomly sampled inside the lattice, avoiding occupied lattice sites. The simulations were run for MC steps; after one run was completed, a new set of 50 walkers was initialized. Ten runs were averaged in this way. Since the simulation time of each single run did exceed the Rouse relaxation times of the chains , it was assured that each run was featuring a statistically independent set of chain conformations. The occpuation volume was varied between and .
IV.2 Physical time scales
Our simulations yield values for the diffusion coefficients of the walker that are scaled with its diffusion coefficient inside an empty lattice, . Consequently, if the free diffusion coefficient of a protein is known experimentally, it may be multiplied with the diffusion coefficient of our simulation to yield the approximate diffusion coefficient of the protein inside the network.
Alternately, the Einstein-Stokes relation may be applied to estimate real time diffusion coefficients. In our coarse grained model, one lattice site approximately corresponds to one Kuhn length of the DNA, which amounts to . Let us assume that we know the physical time required for the protein to diffuse a distance equal to , and call it . This corresponds to a single time step in our random walk simulation, while stands for the step-size. Hence our diffusion law may be interpreted as
| (10) |
where is a real physical distance, a physical time and the diffusion coefficient found in the simulation. In order to find an approximation for , we assume the protein to diffuse freely on the length scale of one Kuhn-length (i.e. one lattice site) and employ the Einstein-Stokes relation
| (11) |
where
| (12) |
Here, is the Boltzmann constant, the absolute temperature, the viscosity of the solvent and R the hydrodynamic radius of the protein. As an example, let us consider a (quite large) protein with a hydrodynamic radius of , and . With we then obtain . This yields a fundamental time unit of . Hence, a typical simulation run ( time-steps) would correspond to roughly seconds of physical time and cover a distance of the order of .
IV.3 Comparison of particle diffusion in static and dynamical polymer networks
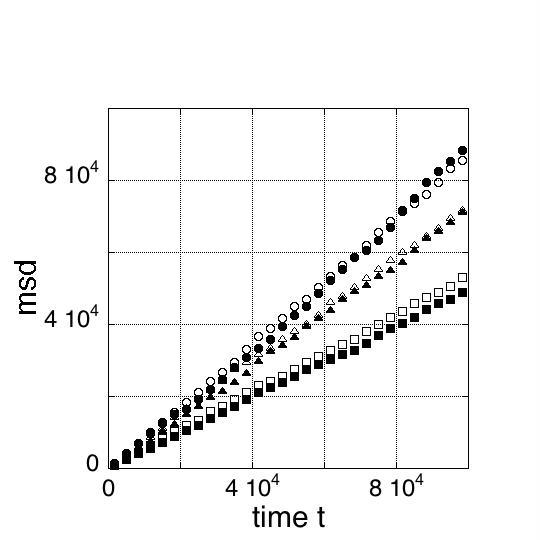
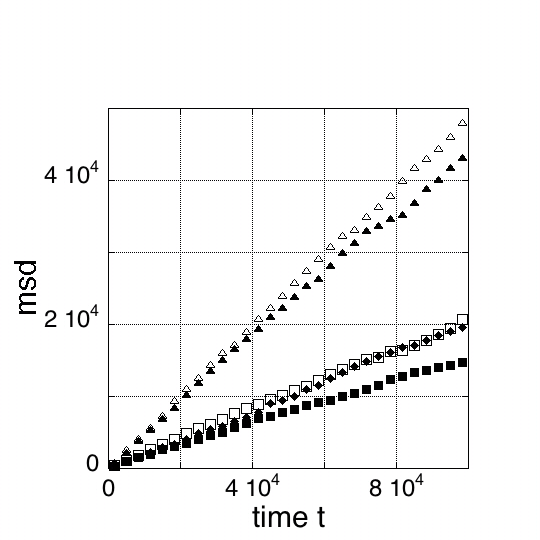
Fig. 4 a displays the dependence of the mean square displacement of particles on the time both in static (black symbols) and dynamical (white symbols) networks with a geometric chain volume of 6.4%. For the smallest particle the mean square displacement shows the same behaviour independent of the network dynamics. Fig. 4 b displays the dependence of the mean square displacement of particles on the time both in static (black symbols) and dynamical (white symbols) networks with a geometric chain volume of 12.5%.
The mean square displacement of the largest particle in a dynamical chain network with an occupation volume of 6.4% (Fig. 4 a, squares) is higher than in a corresponding static chain network. The diffusion coefficients and their difference concerning both network types are similar to those obtained from simulations with the medium-sized particle in a chain network with an occupation volume of 12.5% (see Fig. 4 b, triangles) due to the same effective chain volume of in both systems.
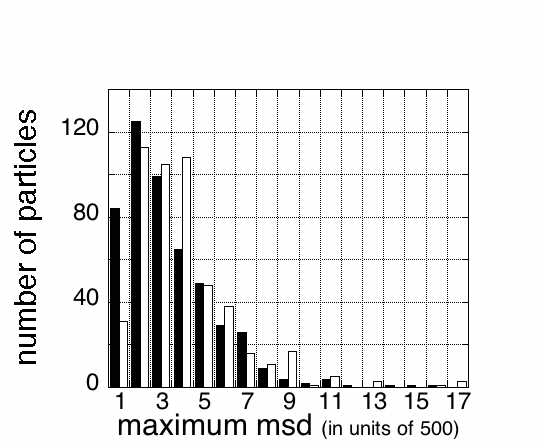
The mean square displacement of the largest particle in a dynamical chain network with an occupation volume of 12.5% (Fig. 4 b, squares) is on long time scales significantly higher than in a corresponding static chain network. This does not imply that each single walker is moving faster through the dynamic network. Fig. 5 shows that around of the particles (24 out of 500) did not reach a maximum mean square displacement beyond 500 (lattice units)2 (black bars), which means that they remained trapped within rather small pockets inside the network. In a corresponding dynamical network all particles reached a maximum mean square displacement larger than 500 (lattice units)2 (white bars), which naturally results in a larger averaged value for the diffusion coefficient. This finding indicates that most of the walkers did hardly modify their diffusion inside the dynamic network. A minority of walkers, however, which would remain trapped in the static case, becomes released in the dynamic case and in this way modify the average diffusion coefficient. Therefore, the difference in the diffusion coefficients is a direct consequence of the averaging process during the computation of the mean square displacement curve.
In order to verify this finding in a quantitative way, the trajectories of the particles in the static chain network were multiplied with a weighting factor determined by the ratio of the both bar lengths (dynamical/nondynamical). In other words: A walker which was moving over a short distance got a lower statistical weight than a particle which was moving over a longer distance. With this approach, we succeeded to reconstruct the data of the dynamical chain network from the data of the static chain network (see Fig. 4 b, diamonds).
It is important to mention that the walker movement is not only influenced by the fluctuations of the chain network but also by the center of mass diffusion of the chains. A pure movement of the walker due to the center of mass diffusion of the chains can be neglected: the difference of 0.06 in the diffusion coefficients of the static and dynamical chain network with 12.5% volume occupation (Fig. 4 b) for the largest particle is much larger than the translational diffusion coefficient of the chains (Fig. 3) indicating that the movement of the walker is mainly influenced by the chain fluctuations.

a
b
c
IV.4 Subdiffusion on short time scales
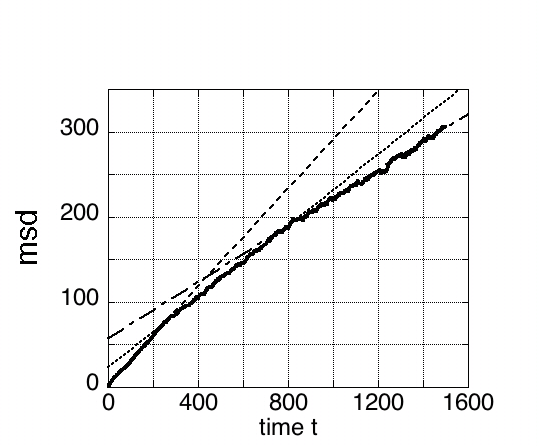
Simulations on short time scales with the number of MC steps were carried out to investigate the subdiffusive behaviour of the mean square displacement of diffusing particles for short times.
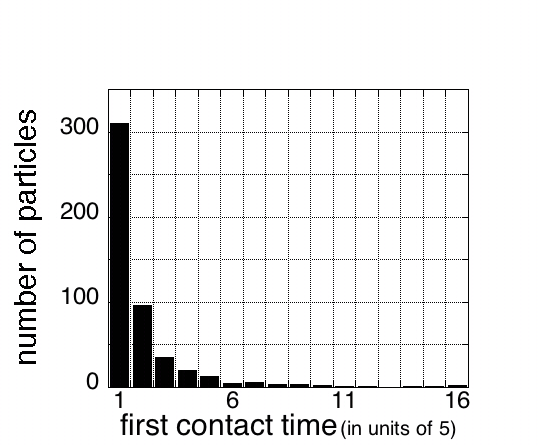
In a static chain network with a chain volume of the mean square displacement of the largest particle displayed subdiffusive behaviour with an anomaly parameter (Fig. 6 a), in a corresponding dynamical chain network was observed, not significantly different when considering the statistical fluctuations. In Fig. 6, three different subregimes are observed (dashed lines): starting with a diffusion coefficient of , the particles become slower after almost 400 MC steps. After 800 MC steps the diffusion coefficient decreases to . One might suspect that the first collision time of the particle could be responsible for this decrease in the diffusion coefficient: the particle diffuses freely until it encounters the chain network. However, as displayed in Fig. 6 b, the majority of particles are colliding with the network within the first five time steps. Instead, the decreasing diffusion coefficient is caused by the increasing number of trapped particles: of the investigated particles (84 out of 500) did not reach a maximum mean square displacement larger than 500.
Thus, subdiffusion on short time scales is not an effect of first collision times of the particle with the chain network. Instead, subdiffusion results from the fact that on short time scales particles are trapped in a crowded environment, hence do not contribute to the large distances of the mean square displacement on longer time scales.
V Discussion
The present work was intended to shed some light on the diffusional transport of proteins in the dynamical chromatin network in the cell nucleus. This process is described with a lattice model of the nucleus, the chromatin fibers and a random walk of the proteins. As shown in earlier work wedemeier1; wedemeier2 the lattice model has - compared to a corresponding continuum model - the advantage of being roughly two orders of magnitude faster due to the finite number of states.
To create crowded environments of chromatin fibers in the cell nucleus, a self-avoiding random walk chain model with excluded volume was used, and chain dynamics was implemented through the BFM and MC. The findings in Section III are hardly surprising to those who are familiar with polymer dynamics. The simulation of polymeric systems however, is not trivial due to the different time scales involeved, and one has to verify that one does in fact obtain proper ensemble averages. Thus, we verified the known scaling laws and typical relaxation times.
It may be argued that the chain lengths used in this work might be too small to represent a chromatin fiber inside a cell nucleus. In reality, the latter would usually cover ten thousands of Kuhn monomers and create a chain network far inside the concentrated regime (and not, as in our case, in the semi-dilute regime). Moreover, such a chromosome would not exhibit any significant center of mass motion because it remains confined inside its territory. In reality, these differences are of little relevance here. The walker does, at any stage of the simulation, only “see” a small subsection of the chain. Its dynamics is therefore influenced by the fluctuations of local chain sections, and hence it is irrelevant how far the chain does extend beyond the walker’s limited horizon. In the semi-dilute regime, remote sections of the same chain are already uncorrelated, so that a single long chain might as well be replaced with several independent shorter chains. Additionally, as a result of the Rouse-scaling, the chain center of mass diffusion was roughly two orders of magnitude slower than the walker’s diffusion and hence it did contribute to its motion only on the level of a few percent.
In several systematic simulations the mean square displacements of diffusing particles of various sizes were computed both in static and dynamical polymer networks. By comparing the results of the two network types we could show that chain diffusion does not alter the diffusion process of small particles. However, the polymer network dynamics begins to influence the diffusional transport process of particles once the effective volume of the chain network is reaching 50% (Fig. 4). Hence, chain dynamics facilitates the transport of large particles. It was demonstrated that the difference in the diffusion coefficients in both network types is a direct consequence of the averaging process during the computation of the mean square displacement. Hence we were able to reproduce the results of the dynamical network after statistically reweighting the single walkers contributions to the averages obtained within the static network. It might be interesting to investigate whether such a procedure could be formalized, so that the simulation of dynamical networks could be replaced with static network simulations, augmented with a corresponding weight function for each trajectory.
In further simulations anomaly on short time scales is found for the msd of a particle in a dynamical fiber network. We could show that this kind of subdiffusion does not result from the first collision time of the particle but is caused by a relatively high number of trapped particles in the crowded environment of the fiber network (Fig. 6).
In recent years, chromatin-binding proteins have been extensively characterized due to their functional significance and their dynamics in the living cell has been studied by in vivo microscopy techniques houtsmueller; lippincott. However, it is not yet clear how proteins bind to the chromatin fibers and displace themselves within the dynamical chromatin network richter; berg1.
We believe that using the model of diffusional transport of proteins in a dynamical fiber network presented here, it is feasible to clarify these questions with an additional implementation of a binding process and with the help of further systematic simulations. This is ongoing work.
VI Acknowledgement
One of the authors (A.W.) thanks two of the authors (H.M. and C.W.) for their hospitality during a research stay at the Department of Physics at the Xiamen University. One of the authors (A.W.) was supported by a scholarship from BIOMS (Center for Modeling and Simulation in the Biosciences). In addition, A.W. thanks H. Soller for a fruitful discussion concerning physical time scales.