Metal-enriched plasma in protogalactic halos††thanks: Based on observations taken with the Ultraviolet and Visual Echelle Spectrograph (UVES) on the Very Large Telescope (VLT) Unit 2 (Kueyen) at Paranal, Chile, operated by the European Southern Observatory (ESO), and with the High Resolution Echelle Spectrograph (HIRES) and Echelle Spectrograph and Imager (ESI) instruments located at the W. M. Keck Observatory on Mauna Kea, Hawaii.
We continue our recent work to characterize the plasma content of high-redshift damped and sub-damped Lyman- systems (DLAs/sub-DLAs), which represent multi-phase gaseous (proto)galactic disks and halos seen toward a background source. We survey N v absorption in a sample of 91 DLAs and 18 sub-DLAs in the redshift range 1.674.28 with unblended coverage of the N v doublet. Our dataset includes high-resolution (6–8 km s-1 FWHM) quasar spectra obtained with VLT/UVES and Keck/HIRES, together with medium-resolution (40 km s-1 FWHM) quasar spectra from Keck/ESI. In DLAs, we find eight secure N v detections, four marginal detections, and 79 non-detections, for which we place 3 upper limits on the N v column density. The detection rate of N v in DLAs is therefore 13%. Two sub-DLA N v detections are found among a sample of 18, at a similar detection rate of 11%. We show that the N v detection rate is a strong function of neutral-phase nitrogen abundance, increasing by a factor of 4 at [N/H]=[N i/H i]. The N v and C iv component -value distributions in DLAs are statistically similar, but the median (N v) of 18 km s-1 is narrower than the median (O vi) of 25 km s-1. Some 20% of the N v components have km s-1 and thus arise in warm, photoionized plasma at log (T/K)4.92; local sources of ionizing radiation (as opposed to the extragalactic background) are required to keep the cloud sizes physically reasonable. The nature of the remaining 80% of (broad) N v components is unclear; models of radiatively-cooling collisionally-ionized plasma at log (/K)=5.2–5.4 are fairly successful in reproducing the observed integrated high-ion column density ratios and the component line widths, but we cannot rule out photoionization by local sources. Finally, we identify several unusual DLAs with extremely low metallicity (0.01 solar) but strong high-ion absorption [log (N v)14 or log (O vi)14.2], which present challenges to either galactic inflow or outflow models.
Key Words.:
quasars: absorption lines – cosmology: observations – galaxies: high-redshift – galaxies: halos – galaxies: ISM1 Introduction
Ever since the epoch of reionization, the vast majority of all baryons in the Universe have existed in either warm or hot plasma. At high redshift (), the baryon budget is dominated by plasma in the warm, photoionized intergalactic medium (IGM, traced by the Lyman- forest; Petitjean et al. 1993; Shapiro et al. 1994; Weinberg et al. 1997; Rauch et al. 1997). By the time the Universe has evolved to the present day, structure formation and feedback from star formation have redistributed the baryons; simulations find they are fairly evenly shared between condensed gas in galactic structures, warm diffuse plasma, and warm-hot shock-heated plasma (Cen & Ostriker 1999, 2006; Davé et al. 2001). Although questions remain about whether the detailed baryon budget has been confirmed observationally (Fukugita et al. 1998; Bregman 2007; Prochaska & Tumlinson 2008), the finding that most baryons exist in plasma is robust. Therefore, characterizing the plasma phases observationally is crucial to understand the history of baryonic matter.
Counter-intuitively, a good place to find astrophysical plasma is in those potential wells where large quantities of neutral gas reside. Such locations can be identified as damped Lyman- (DLA) systems, the well-studied category of quasar absorbers defined by a neutral hydrogen column density log (H i)20.3 (see review by Wolfe et al. 2005). There are several lines of evidence suggesting that DLAs represent star-forming galaxies (or their halos) seen in absorption, including the identification of the host galaxy in many low- (Le Brun et al. 1997; Rao et al. 2003; Chen & Lanzetta 2003; Chen et al. 2005) and high- (Warren et al. 2001; Møller et al. 2002, 2004) DLAs, the presence of metals (e.g. Prochaska et al. 2003a, b) and molecular gas (e.g. Ledoux et al. 2003; Srianand et al. 2005; Noterdaeme et al. 2008) in DLAs, and a significant cross-correlation signal with Lyman Break Galaxies at (Cooke et al. 2006a, b). Absorbers with slightly lower H i columns [19.0log (H i)20.3] are referred to as sub-DLAs (or Super Lyman Limit systems; Dessauges-Zavadsky et al. 2003; Péroux et al. 2003, 2005; O’Meara et al. 2007). Sub-DLAs are also thought to be arise in galaxies (or galaxy halos), but are generally treated as a separate class of objects than DLAs, because of a partly ionized (rather than neutral) H i phase (Prochaska & Wolfe 1996; Péroux et al. 2007).
The presence of plasma in DLA and sub-DLA host galaxies is indicated by the detection of C iv and Si iv absorption at in all DLAs and sub-DLAs with C iv spectral coverage (Lu et al. 1996; Prochaska & Wolfe 1996, 1999; Prochaska 1999; Ledoux et al. 1998; Wolfe & Prochaska 2000a; Prochaska et al. 2002a; Dessauges-Zavadsky et al. 2003; Péroux et al. 2003; Richter et al. 2005; Lehner et al. 2008; Quast et al. 2008; Fox et al. 2007a, b, hereafter Paper I and Paper II). The C iv and Si iv kinematic structure is almost always distinct from that of the low ions (Wolfe & Prochaska 2000b), indicating the high ions trace different regions. Recently, a new plasma phase was revealed by detections of O vi absorption in thirteen DLAs (Paper I; Lehner et al. 2008) and three sub-DLAs (Simcoe et al. 2002; Fox et al. 2007c) at –3. Since none of the robustly detected O vi components in DLA/sub-DLAs are narrow (all have km s-1), and that photoionization models fail to simultaneously explain the O vi and other high-ion column densities (Paper I; Lehner et al. 2008), the O vi detections constitute the discovery of warm-hot, collisionally-ionized plasma in the DLA host galaxies111The standard definition of warm-hot is =105–107K; however, O vi is only produced by collisions at the lower end of this range, at –106K..
Since cosmological simulations predict that little warm-hot plasma has formed at (Davé et al. 2001), its presence at this epoch raises some interesting questions. Does warm-hot plasma in galaxy halos form by feedback processes from star formation and supernovae (Oppenheimer & Davé 2006; Kawata & Rauch 2007; Fangano et al. 2007), rather than through the shock-heating of infalling material (hot-mode accretion; Birnboim & Dekel 2003; Kereš et al. 2005; Dekel & Birnboim 2006)? Does warm-hot plasma in galaxy halos contain a significant fraction of the high-redshift metal budget (Ferrara et al. 2005; Sommer-Larsen & Fynbo 2008)? How do those halos evolve with time? Continued observational studies of high-ion absorption lines in galactic structures at low- and high-, together with techniques to distinguish between warm photoionized- and hot collisionally-ionized absorbers, are needed to answer these questions.
After O+5, the second-most-highly-ionized species accessible in the rest-frame UV is N+4, whose resonance doublet is N v 1238.821, 1242.804. Though only 77.5 eV is required to create N+4 versus 113.9 eV to create O+5, it is difficult to photoionize N v with starlight, since the flux of stellar photons falls rapidly above 54 eV (228 Å), the He ii ionization edge (Bregman & Harrington 1986). Thus interstellar N v absorption traces plasma that is either hot or subject to a hard photoionizing spectrum. The N v doublet has the significant advantage of lying less deep into the Lyman- forest than O vi, so the signal-to-noise is higher and the level of blending is lower. However, it is well-documented that nitrogen tends to be under-abundant in DLAs (Pettini et al. 1995, 2002a, 2008; Centurión et al. 1998, 2003; Lu et al. 1998; Prochaska et al. 2002b; Henry & Prochaska 2007; Petitjean et al. 2008) and in low-metallicity environments in general. The low nitrogen abundance coupled with the intrinsic weakness of both lines of the N v doublet makes detecting N v in DLAs challenging, but not impossible: N v detections have been reported in two intervening DLAs (Paper I) and three highly proximate DLAs (within 100 km s-1 of, or beyond, ; Paper I; Rix et al. 2007; Hennawi et al. 2009).
The goal of this paper is to survey N v in DLAs and sub-DLAs222When we refer to N v (or any high ion) in a DLA, we are not implying that the N v and H i lines form in the same regions of gas. Rather, “N v in DLAs” is a convenient shorthand for “N v in the multi-phase structures whose neutral phase is seen in Lyman-”, or equivalently “N v in DLA host galaxies”.. We structure the paper as follows. In §2 we describe the three datasets combined to produce our sample, together with our data handling and measurement techniques. In §3 we summarize the statistics on the frequency of detection of N v. In §4 we describe the measurement of the nitrogen abundance in cases where the N i lines are available. In §5 we present our results, investigating how the N v detections and non-detections depend on other observational properties of DLAs. We discuss the implications of our results in §6, and summarize our principal findings in §7. Throughout this paper, we use the standard notation [X/Y]log [(X)/(Y)]–log [(X)/(Y)]⊙ when discussing elemental abundances. We use the photospheric solar abundance table compiled by Lodders (2003) unless otherwise noted.
2 Observations and Data Handling
2.1 Origin of Data
To create our sample, we combined pre-existing datasets from the
following three instruments:
(1) The Ultraviolet/Visual Echelle Spectrograph (UVES; Dekker et al. 2000)
mounted on the 8.2 m Very Large Telescope Unit 2 (Kueyen) on
Cerro Paranal, Chile.
Our UVES sample of DLAs and sub-DLAs has been built over the
last few years for the purpose of studying elemental abundances and
molecular gas, and is described in Ledoux et al. (2003, 2006),
supplemented with several spectra from the Hamburg-ESO survey
(Smette et al. 2005). One additional sub-DLA was taken from
the sample of Bergeron et al. (2004). The data reduction was conducted using a
customized version of the MIDAS pipeline written by Ballester et al. (2000). The
UVES data have a velocity resolution of 6.6 km s-1 (FWHM), and
a mean pixel size of 2.1 km s-1 (after using the 2x2 binning mode). UVES has excellent response in the blue, where N v absorption at
=2–3 is observed.
(2) The High Resolution Echelle Spectrograph (HIRES; Vogt et al. 1994)
located on the Keck I telescope on Mauna Kea, Hawaii. Our HIRES
dataset is based on
the sample published in Prochaska et al. (2007), with several new QSO spectra taken
from Wolfe et al. (2008). The data reduction was conducted using the MAKEE
package (developed and distributed by T. Barlow) for datasets taken with the
original Tektronix CCD, and using the HIRedux package (Prochaska et al. 2007) for data
obtained with the newer CCD mosaic.
The HIRES data have a velocity resolution of either 6.6 or
8.0 km s-1 (FWHM), depending on the choice of slit width,
and are unbinned, with a mean pixel size of 1.8 km s-1.
(3) The Echelle Spectrograph and Imager (ESI; Sheinis et al. 2002)
mounted on the Keck II telescope. These data, published
in Prochaska et al. (2007), were obtained using a 0.5″ or
0.75″ slit, resulting in a velocity FWHM of 33 or 44 km s-1,
respectively, and are unbinned with a pixel size of 10.0 km s-1.
The ESI data were reduced with the ESIRedux package developed in IDL
and described in Prochaska et al. (2003a).
2.2 Formation of sample
We began by selecting all DLAs and sub-DLAs from our sample with
spectra covering N v, i.e. covering the wavelength
1238(1+) Å, where is defined
by the wavelength of strongest absorption in the low-ionization metal lines.
After removing duplicate systems present in both UVES and HIRES
samples (for which we generally took the UVES data, unless the HIRES S/N was
significantly higher), we ended up with 141 individual
DLAs and 23 sub-DLAs; of these 164 absorbers, the data are from
UVES in 112 cases, from HIRES in 35, and from ESI in 17. The larger number of DLAs than sub-DLAs simply reflects the way the samples
were constructed; it does not reflect their relative incidence of
occurrence along random sight-lines.
Continua were fitted in the vicinity of N v (typically
using a spectral region covering several thousand km s-1) using
low-order polynomials. We searched for the presence of N v absorption in a velocity interval of 400 km s-1 around ,
and then classified each system into one of the following categories:
1. Secure N v detection (eight DLAs and two sub-DLAs), confirmed by consistent optical depth profiles in both members of the
doublet (N v 1238.821, 1242.804).
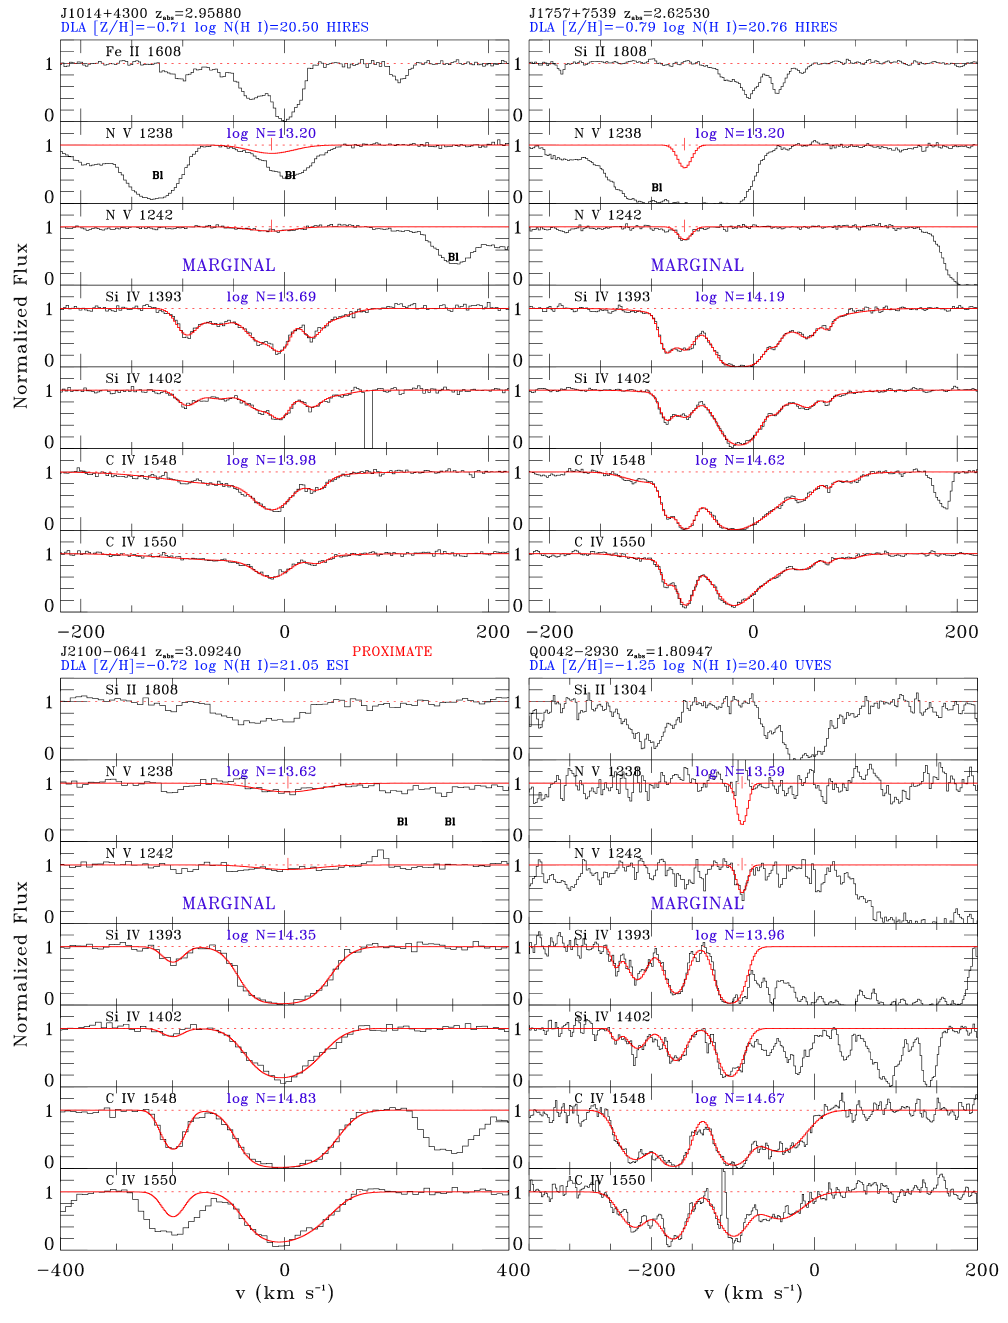
2. Marginal N v detection (four DLAs), seen in one line of the doublet only (the other being blended) but with a profile consistent
with the C iv absorption seen at that redshift.
3. No detection (79 DLAs and 16 sub-DLAs); 3 upper limit on column density measured.
4. Completely blended (50 DLAs and 5 sub-DLAs); both doublet lines contaminated, with no useful information on the presence or absence
of N v.
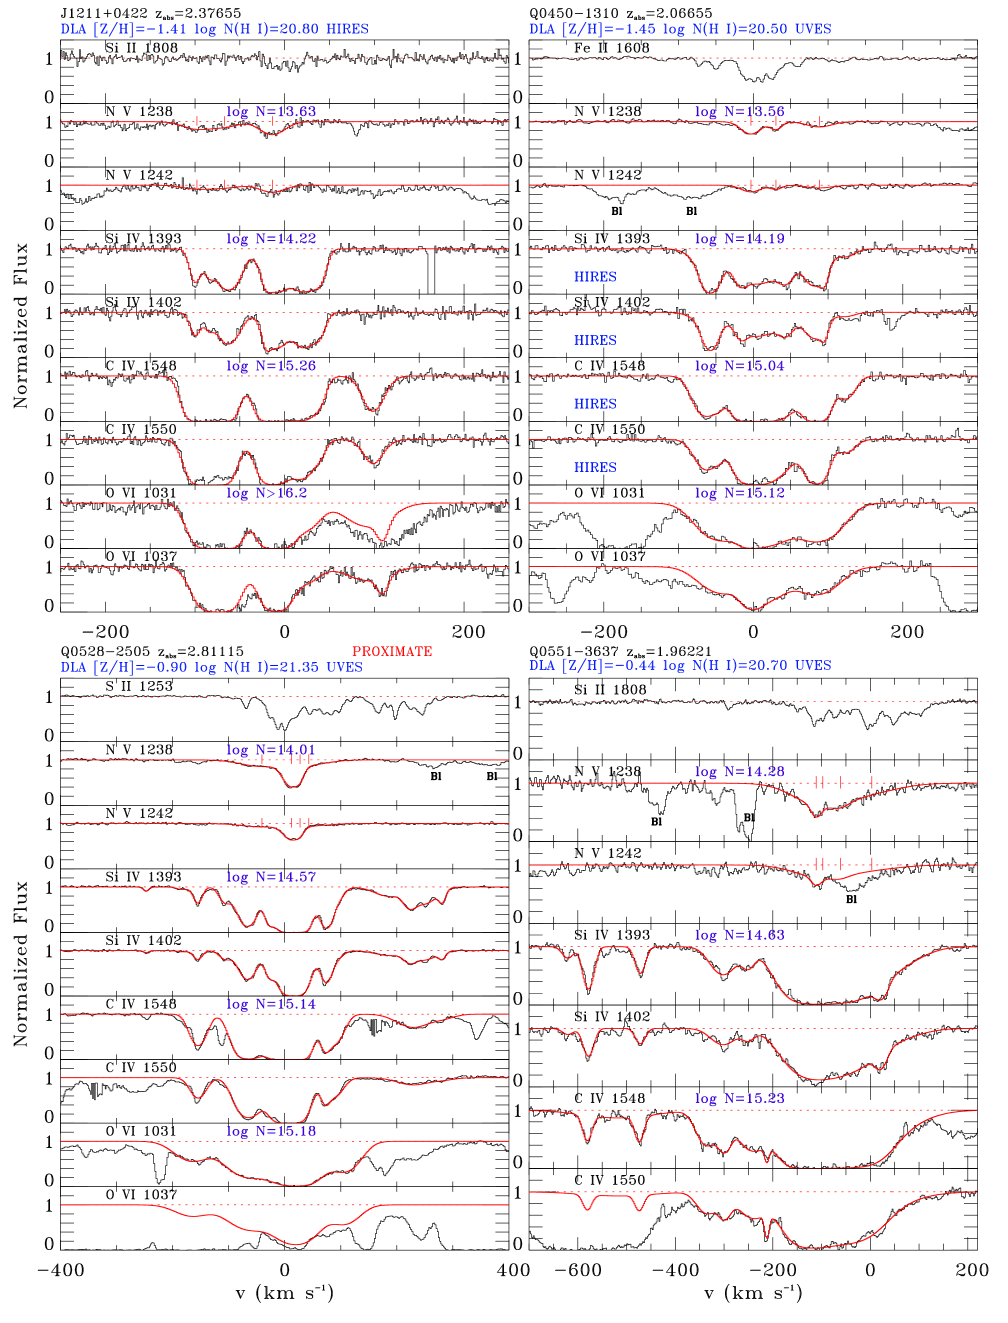
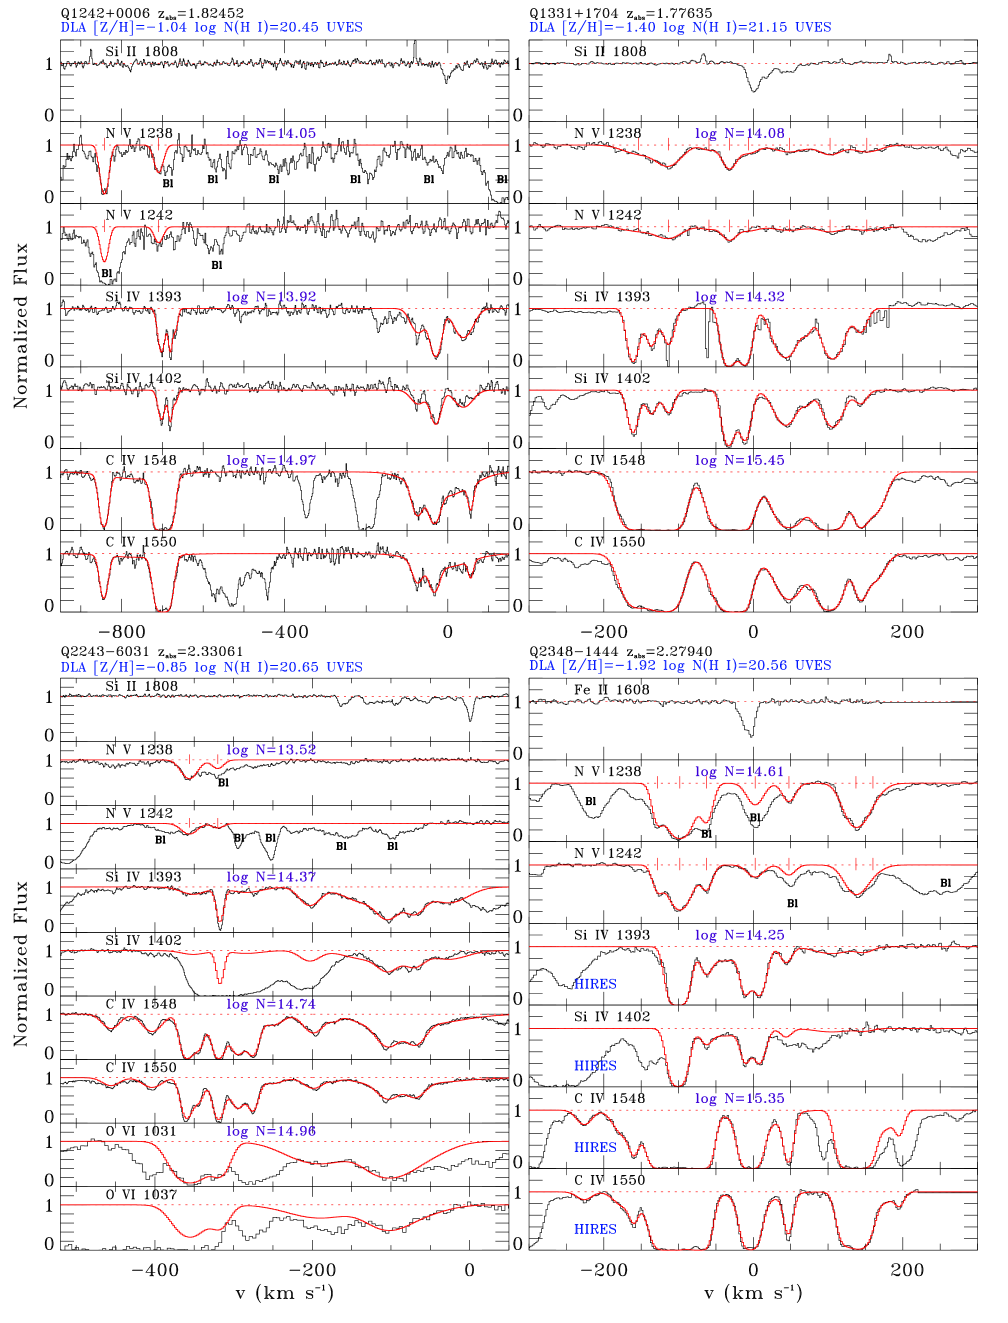
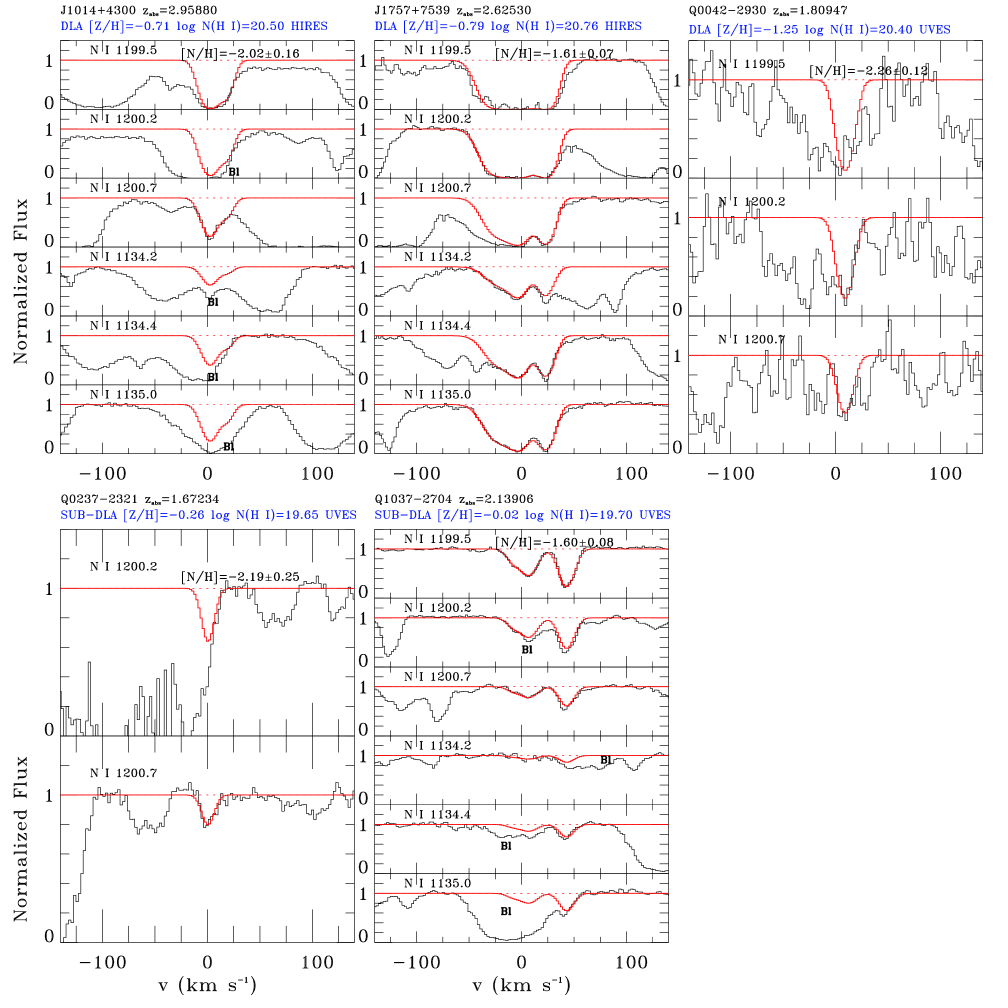
The systems in category 4 were discarded. Note that a system can enter category 1 even if the N v data are partly blended. This occurs when N v absorption is clearly identified in some portion of the line profiles but is blended at other velocities. In these cases the reported N v column densities are formally lower limits, since additional absorption could be hidden in the blended regions. Examples of each category are given in Figure 1. We note that the DLA at =1.82452 toward Q1242+0006 shows N v in two components at 7092 km s-1 and 8422 km s-1, each with coincident C iv absorption. This absorber was included in our sample despite its large velocity separation from the neutral gas, since there is a good probability it is physically connected to the DLA: there are several examples in the literature of DLAs with C iv absorption extending over 500–1 000 km s-1 around the DLA redshift (Prochaska & Wolfe 1999; Wolfe & Prochaska 2000a; Petitjean et al. 2002, Paper II).
2.3 Measurements
| QSO | 333 denotes a proximate DLA (5 000 km s-1 from QSO). | 444Velocity centroid relative to . | log 555∗ denotes a marginal N v detection. | |
|---|---|---|---|---|
| (km s-1) | (km s-1) | ( in cm-2) | ||
| DLAs | ||||
| J1014+4300 | 2.95880 | 132 | 293 | 13.200.04∗ |
| J1211+0422 | 2.37655 | 9812 | 2110 | 13.120.17 |
| 6716 | 2014 | 12.920.17 | ||
| 142 | 182 | 13.330.03 | ||
| J1757+7539 | 2.62530 | 672 | 71 | 13.200.03∗ |
| J2100–0641 | 3.09240 | 67 | 7410 | 13.620.05∗ |
| Q0042–2930 | 1.80947 | 892 | 61 | 13.590.04∗ |
| Q0450–1310 | 2.06655 | 32 | 171 | 13.290.02 |
| 302 | 91 | 12.820.04 | ||
| 882 | 223 | 12.990.05 | ||
| Q0528–2505 | 2.81115 | 415 | 514 | 13.430.06 |
| 122 | 181 | 13.700.05 | ||
| 272 | 82 | 12.870.13 | ||
| 4313 | 4710 | 13.260.17 | ||
| Q0551–3637 | 1.96221 | 1112 | 133 | 13.260.11 |
| 977 | 748 | 14.090.07 | ||
| 616 | 2114 | 12.840.47∗ | ||
| 320 | 7915 | 13.600.18∗ | ||
| Q1242+0006 | 1.82452 | 8422 | 111 | 13.900.02∗ |
| 7092 | 132 | 13.500.05 | ||
| Q1331+1704 | 1.77635 | 15311 | 2810 | 13.210.22 |
| 1133 | 223 | 13.520.11 | ||
| 595 | 128 | 12.610.25 | ||
| 322 | 113 | 13.350.10 | ||
| 66 | 169 | 12.930.25 | ||
| 484 | 279 | 13.080.11 | ||
| 1033 | 195 | 13.080.10 | ||
| 1524 | 246 | 13.030.09 | ||
| Q2243–6031 | 2.33061 | 3562 | 131 | 13.410.01 |
| 3202 | 92 | 12.870.04∗ | ||
| Q2348–1444 | 2.27940 | 1282 | 81 | 13.530.05 |
| 982 | 181 | 14.290.01 | ||
| 622 | 91 | 13.570.03 | ||
| 22 | 132 | 13.360.04 | ||
| 482 | 101 | 13.180.03 | ||
| 1379 | 193 | 13.960.10 | ||
| 16018 | 1915 | 13.130.10 | ||
| Sub-DLAs | ||||
| Q0237–2321 | 1.67234 | 372 | 121 | 13.330.02 |
| 213 | 253 | 13.410.06 | ||
| 544 | 149 | 12.620.15 | ||
| 16310 | 1915 | 13.230.20 | ||
| 1833 | 97 | 12.870.15 | ||
| Q1037–2704 | 2.13906 | 3082 | 221 | 13.600.01 |
| 52 | 403 | 13.290.03 |
For each system, we identify a velocity integration range to (defined relative to the DLA redshift ) over which the rest-frame equivalent width of absorption is measured. For N v detections, these limits are identified by eye. For the N v non-detections, we used (where possible) the velocity range where C iv absorption is observed. If C iv data were unavailable, or if the N v profiles were blended in the C iv region, we adopted a range 50 to 50 km s-1. The equivalent width is first measured per pixel, with an error estimate that includes contributions from statistical noise and continuum placement. The total equivalent width is then formed by summing over the pixels in the chosen velocity range, with the error on the total equivalent width formed by adding the individual pixel errors in quadrature (see appendix in Sembach & Savage 1992). We include an additional error of 2 mÅ in each equivalent width measurement, reflecting the uncertainty in the choice of velocity limits.
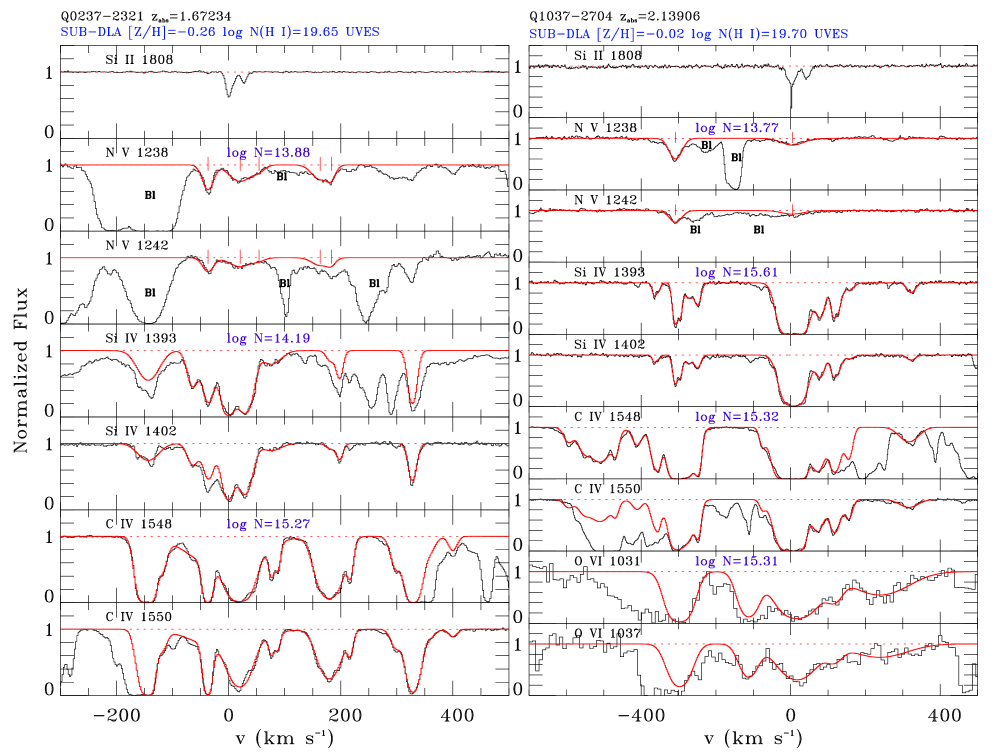
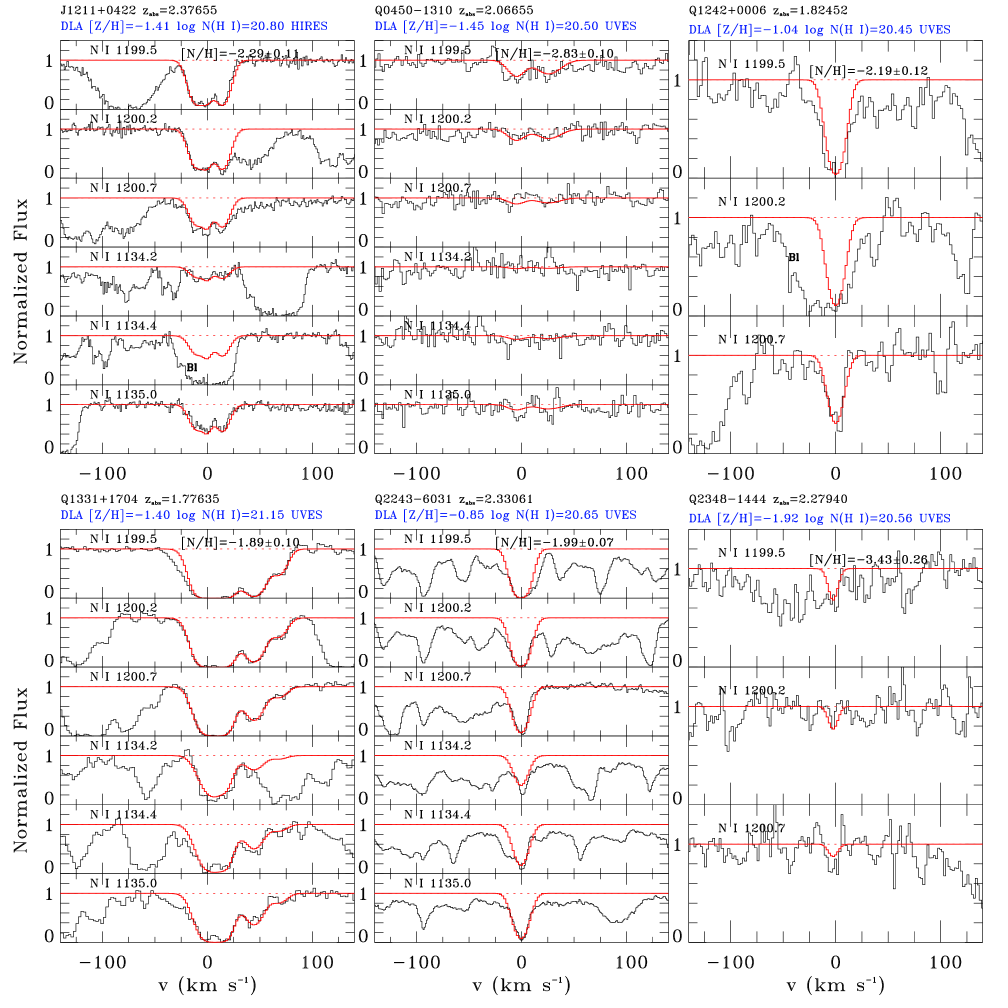
For the N v detections, we fit Voigt components to the absorption in all available high ions using the software package VPFIT666Available at http://www.ast.cam.ac.uk/rfc/vpfit.html.. VPFIT operates simultaneously on the two doublet lines and accounts for the effects of instrumental resolution. The number of N v components to fit was usually self-evident from inspection of the line profiles, but in all cases the other high-ion profiles were considered when deciding how many components to fit in the N v model. However, the N v, C iv, O vi, and Si iv fits were each conducted independently, i.e. no component centroids or line widths were tied from one ion to the next. There is always the possibility of adding extra components, but our approach was to use the minimum number necessary. For the twelve DLAs and two sub-DLA with N v detections, the detailed parameters of our best-fit N v Voigt profiles are given in Table 1. For each component, we added (in quadrature) extra terms to the errors reported by VPFIT, of 2.0 km s-1 (velocity centroid errors), 1.0 km s-1 (-value errors) and 0.02 dex (column density errors), to reflect the minimum plausible uncertainties. The absorption-line spectra (together with the best-fit VPFIT models) are shown in the Appendix as Figures A.1, A.2, and A.3 for DLAs and Figure A.4 for sub-DLAs. We include all available high-ion data in each stack, as well as the profile of Si ii 1304, Si ii 1808, S ii 1253 or Fe ii 1608, to trace the low-ionization gas. Some of these data have already been published (Lehner et al. 2008, Paper I, Paper II), but we redisplay them here for completeness, and because the other high-ion profiles are crucial for interpreting the N v.
For the N v non-detections, i.e. cases where there is no absorption present at 3 significance in the chosen velocity range, we determined the 3 upper allowed value of the rest-frame equivalent width; for example, if a measurement found =03 mÅ, we adopted =9 m Å. We then converted into a 3 limit on the column density assuming a linear curve-of-growth, i.e. , where is in mÅ, is in Å, and is in cm-2. The optically-thin assumption is justified since if any absorption on the non-linear parts of the curve-of-growth were present, this would preclude a non-detection. We verified these limits by using an alternative method to derive the limiting equivalent width, following the formula given in Wakker et al. (1996), which computes as a function of S/N, pixel size, and assumed line width =18 km s-1. The two methods were found to given broadly similar results, with a mean absolute difference between the calculated values of log of 0.22 dex. In the Appendix, we present a summary of N v measurements for all detections and non-detections in DLAs (Table A.1) and sub-DLAs (Table A.2). In each system we present the result from whichever of 1238 or 1242 gave the stronger constraint. Blended systems (those in category 4) are listed in the footnotes to these tables. Atomic data were taken from Morton (2003).
3 Sample statistics
Among the DLAs that are unblended at N v (those in categories 1, 2, and 3), the overall N v detection rate is 8/91 (secure detections only), or 12/91 (secure and marginal detections). Applying small-number Poisson statistics (Gehrels 1986), and quoting 1 errors, the detection rate is therefore 9% (secure) or 13% (secure and marginal). The N v detection rate in sub-DLAs is 2/18 (11%). In DLAs with unblended UVES data, the N v detection rate is 8/65 (12%), and in DLAs with unblended HIRES data, the N v detection rate is 3/22 (14%). Though this difference is not statistically significant, a marginally higher detection rate for HIRES is expected, because the median sensitivity of the HIRES spectra is slightly higher: the median S/N per resolution element at N v is 28.0, 39.8, and 37.7 for the unblended data taken with UVES, HIRES, and ESI, respectively. Given the differences in pixel size, and assuming a line width =15 km s-1, these S/N values correspond to limiting 3 observer-frame equivalent widths at 4000 Å of 15.6 mÅ (UVES), 10.2 mÅ (HIRES), and 25.3 mÅ (ESI).
As expected, the likelihood that the N v data are blended is much higher when the N v doublet lies in the Lyman- forest. For a DLA at redshift , N v 1238 lies in the Lyman- forest if 1238.8(1+)1215.7(1+). Equivalently, N v lies out of the forest if the DLA is within 5 600 km s-1 of the background quasar, so for N v, “out of the forest” also happens to imply “proximate to the quasar”. Some 406% (50/125) of all (intervening) DLAs in the Lyman- forest are blended at N v, whereas none of the 16 (proximate) DLAs lying out of the forest are blended at N v. Interestingly, we find that once the blended systems are excluded, the N v detection rate for (intervening) DLAs in the forest is 10/75 (13%) versus 2/16 (13%) for (proximate) DLAs outside the forest. The similarity of these detection rates suggests that (a) blending has been correctly identified and no substantial biases are introduced by rejecting cases where the N v profiles are blended, and (b) there is no significant change in the likelihood of a N v detection when the DLA is within 5 000 km s-1 of the QSO, the traditional definition of “associated” or “proximate” systems. We will return to this subject in §6.
Note that the DLA N v detection rate of 13% contrasts with the 100% detection rate for Si iv and C iv absorption in DLAs (Wolfe & Prochaska 2000a, Paper II), and the 34% detection rate for O vi absorption (Paper I; only a lower limit can be measured for O vi, due to the impact of blending with Lyman- forest lines). It also contrasts with the very high detection rate of N v in the Milky Way halo: zero-redshift interstellar N v absorption, though weak, is reported in 32 of 34 Galactic halo sight-lines studied by Indebetouw & Shull (2004).
4 Neutral-phase elemental abundances
4.1 -elements and Zinc
For each absorber in our sample, a [Z/H] and (H i) measurement is available in the literature (see footnotes to Table A.1). For all systems with N v detections, a measurement from Si ii/H i is available. For the systems with N v non-detections, we use either S ii/H i, Si ii/H i, or Zn ii/H i, depending on the availability of unsaturated lines. S and Si (both -capture elements) and Zn (an iron-peak element) are each undepleted onto dust grains, with a first ionization potential 13.6 eV, so that the singly ionized stage is dominant in H i regions. Studies have found that [Zn/] in DLAs is rarely far from zero (Centurión et al. 2000; Molaro et al. 2000; Nissen et al. 2004), with the latter authors finding [/Zn] 0.25 in ten DLAs covering 2 dex of [Zn/H]. Thus within an error of 0.2 dex, the Zn abundance can be used as a proxy for the -element abundance. A potentially more serious problem is whether the metallicity measurements are affected by ionization corrections. For DLAs, photoionization simulations find that ionization corrections are generally negligible (Viegas 1995; Vladilo et al. 2001, but see Howk & Sembach 1999 and Izotov et al. 2001). For sub-DLAs, Dessauges-Zavadsky et al. (2003) and Péroux et al. (2007) report that ionization corrections are typically small but depend on the element; Vladilo et al. (2001) find that the relative ionization corrections at log (H i)=20.2 are 0.15 dex for O/Si, 0.23 dex for O/S, and 0.64 dex for O/Zn. The metallicities presented in Tables A.1 and A.2 have not been corrected for ionization.
4.2 Nitrogen
| QSO | 777The DLAs at =2.81115 toward Q0528–2505, =1.96221 toward Q0551–3637, and =3.09240 toward J2100–0641 exhibit fully saturated N i profiles, and N abundances could not be extracted. | log (H i) | Triplets888The triplets used to measure the N i absorption: N i 1134.165, 1134.415, 1134.980 and N i 1199.550, 1200.223, 1200.710. | log | [N/H]999Nitrogen abundance relative to solar where log (N/H)⊙=4.07 (Holweger 2001). Errors were formed by adding in quadrature the logarithmic errors on (N i), (H i), and an additional 0.05 dex allowing for uncertainties in the solar nitrogen abundance. | [N/Si]101010Nitrogen-to-silicon ratio. | Ref.111111All measurements in this table have been made by us. However, in several cases, [N/H] has been determined previously: 1 Lehner et al. (2008); 2 Henry & Prochaska (2007); 3 Dessauges-Zavadsky et al. (2006); 4 Dessauges-Zavadsky et al. (2004); 5 Lopez et al. (2002); 6 Pettini et al. (1995); 7 Srianand & Petitjean (2001). Our results generally agree with previous results within the errors; for the DLA toward Q2348-1444, our value for log (N i) is consistent with the upper limit log (N i)13.48 reported by Pettini et al. (1995). | ||
| (km s-1) | (km s-1) | ( in cm-2) | |||||||
| J1014+4300 | 2.95880 | 20.500.02 | N i 1134, 1200 | 22 | 91 | 14.330.05 | 2.020.17 | 1.310.22 | - |
| 203 | 65 | 13.630.24 | |||||||
| J1211+0422 | 2.37655 | 20.800.10 | N i 1134, 1200 | 102 | 71 | 13.990.04 | 2.290.11 | 0.880.14 | 1 |
| 02 | 41 | 13.850.07 | |||||||
| 142 | 71 | 14.040.03 | |||||||
| J1757+7539 | 2.62530 | 20.760.02 | N i 1134, 1200 | 213 | 172 | 14.570.08 | 1.610.07 | 0.820.07 | 2 |
| 22 | 101 | 14.630.07 | |||||||
| 232 | 81 | 14.600.02 | |||||||
| Q0042–2930 | 1.80947 | 20.400.10 | N i 1200 | 92 | 82 | 14.060.05 | 2.260.12 | 1.010.19 | - |
| Q0450–1310 | 2.06655 | 20.500.07 | N i 1134, 1200 | 52 | 103 | 13.270.08 | 2.830.10 | 1.380.11 | 2,3 |
| 263 | 143 | 13.320.07 | |||||||
| Q1242+0006 | 1.82452 | 20.450.10 | N i 1134, 1200 | 02 | 82 | 14.190.06 | 2.190.13 | 1.150.14 | - |
| Q1331+1704 | 1.77635 | 21.150.07 | N i 1134, 1200 | 62 | 131 | 15.060.06 | 1.890.10 | 0.490.11 | 2,4 |
| 193 | 52 | 14.240.25 | |||||||
| 442 | 111 | 14.260.02 | |||||||
| 692 | 81 | 13.470.04 | |||||||
| Q2243–6031 | 2.33061 | 20.650.05 | N i 1134, 1200 | 12 | 71 | 14.590.03 | 1.990.08 | 1.140.09 | 2,5 |
| Q2348–1444 | 2.27940 | 20.560.08 | N i 1200 | 22 | 42 | 13.060.09 | 3.430.26 | 1.510.26 | 2,6 |
| Q0237–2321 | 1.67234 | 19.650.10 | N i 1200 | 12 | 62 | 13.390.06 | 2.190.25 | 1.930.27 | - |
| Q1037–2704 | 2.13906 | 19.700.05 | N i 1134, 1200 | 83 | 72 | 13.020.16 | 1.600.08 | 1.580.13 | 7 |
| 72 | 92 | 13.550.05 | |||||||
| 432 | 81 | 13.780.02 |
N i column densities were measured using the N i 1199.550, 1200.223, 1200.710 and N i 1134.980, 1134.415, 1134.165 triplets. Simultaneous profile fits to whichever of these six N i lines were unblended were executed to determine the best-fit N i column density. The N i absorption-line spectra together with the best-fit models are shown in Figures A.5 and A.6 in the Appendix. In three of the twelve DLAs with N v detections (the DLAs at =1.9622 toward Q0551–3637, =2.8112 toward Q0528–2505, and =3.0924 toward J2100–0641), we were unable to determine (N i), due to complete saturation. The latter two of these three are proximate DLAs.
In absorbers with log (H i)19.5 (i.e. DLAs and strong sub-DLAs), the N i/H i ratio can be converted to nitrogen abundances without needing ionization corrections, because charge-exchange reactions are fast enough to tie together the ionization state of nitrogen and hydrogen (and oxygen; Field & Steigman 1971; Viegas 1995). Thus we calculate the nitrogen abundance relative to solar as [N/H]=[log (N i)–log (H i)]–log (N/H)⊙, where log (N/H)⊙=4.07 is taken from Holweger (2001). The results are reported in Table 2. The assumption that [N i/H i]=[N/H] may break down if the ionization parameter is large enough (Prochaska et al. 2002b), or for cases with log (H i)19.5. Thus for the two sub-DLAs in our sample with log (H i)19.7, [N i/H i] may underestimate [N/H] because some of the N may exist in the form of N ii.
5 Results
Our fourteen N v detections include two strong sub-DLAs [each having log (H i)19.70] and twelve genuine DLAs. They cover a redshift range from 1.67 to 3.09, and span a range of 1.5 dex in neutral-phase metallicity [Si/H], from 1.92 to 0.44. Two of the DLAs with N v are proximate, with one (the absorber at =3.0924 toward J2100–0641) lying at 3 500km s-1 from the QSO redshift, and one (the absorber at =2.81115 toward Q0528–2505) at 3 200 km s-1 beyond the QSO redshift (Srianand & Petitjean 1998). The values of log (N v) among the detections lie between 13.20 and 14.61, and the number of N v components seen within a single DLA ranges from one to eight.
5.1 Dependence of N v detection rate on DLA properties
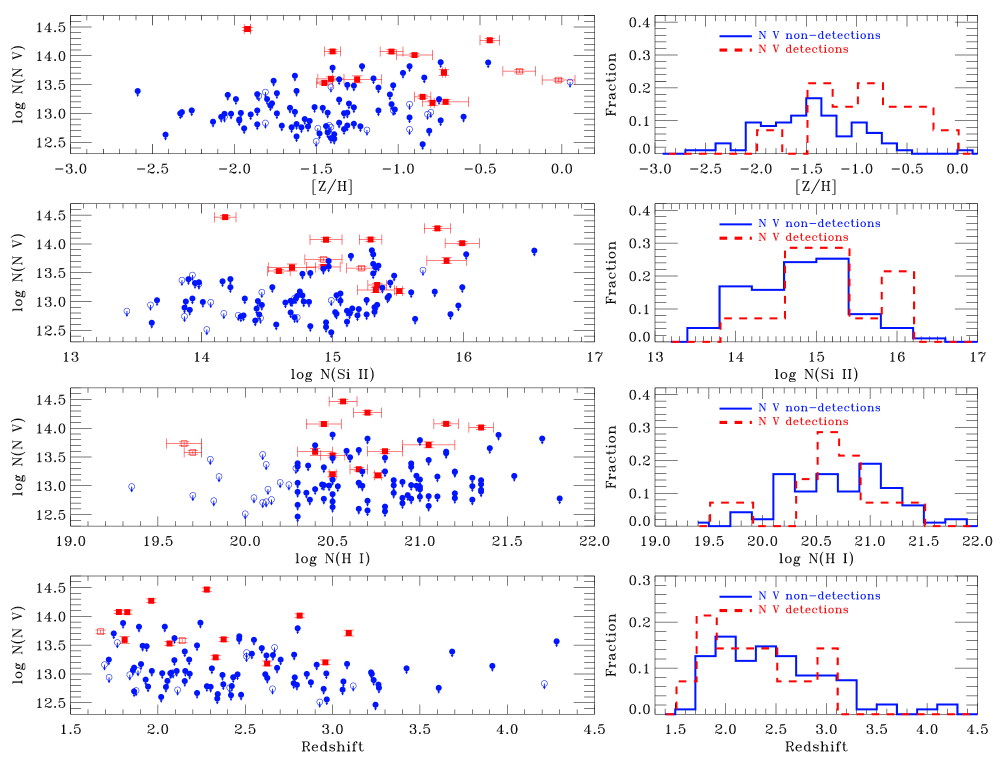
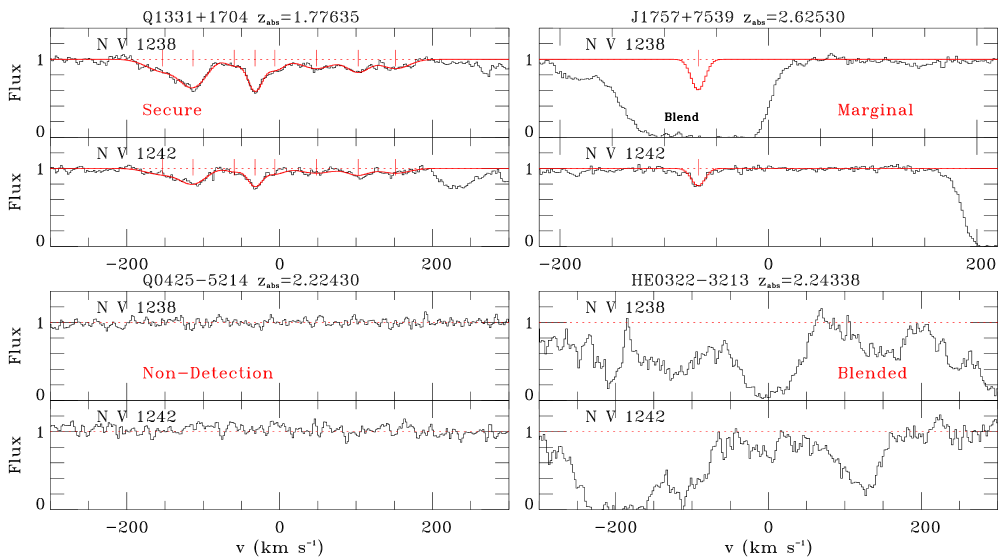
The N v column densities are plotted against known properties of the DLA/sub-DLA ([Z/H], (Si ii), (H i), and ) in Figure 2, to explore the factors that influence the formation of N v. We find that the N v detections have neutral-phase metallicities that distribute very differently than the non-detections (top panel). The median [Z/H] for the DLAs with N v detections is 0.90, versus 1.46 for the DLAs with N v non-detections. Three of the five highest metallicity DLAs in our sample, and two of the three highest metallicity sub-DLAs, show N v detections. A two-sided Kolmogorov-Smirnoff (K-S) test rules out the null hypothesis (the idea that the metallicity distributions of the N v detections and non-detections derive from the same parent population) at the 99.2% level. If the sub-DLAs are removed and the analysis is restricted to genuine DLAs, the null hypothesis is again rejected, but with a slightly lower confidence of 96.7%. However, among the N v detections, (N v) does not correlate with [Z/H].
We also find some evidence that the Si ii column density log (Si ii)=log (H i)+[Z/H]+log(Si/H)⊙ distributes differently for the N v detections and non-detections (second panel), but this difference is only significant at the 87.4% level (2). In other words, the probability of detecting N v is somewhat sensitive to the total column of metals present in the neutral phase, but is more sensitive to metallicity121212Analogously, metallicity is a significant factor in determining whether H2 is present in DLAs (Petitjean et al. 2006; Noterdaeme et al. 2008).. The probability of N v detection is not dependent on H i column density (third panel), and not strongly dependent on redshift (fourth panel). However, we note there are no N v detections at , even though the sample extends to =4.28.
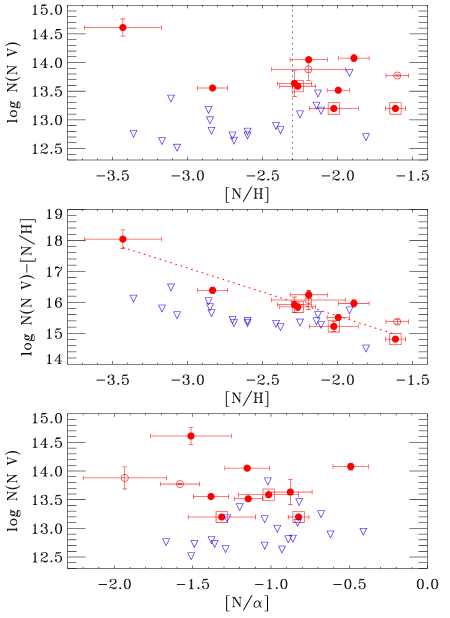
In the sub-sample of DLAs/sub-DLAs with N v detections/upper limits and N i measurements, we investigate in Figure 3 whether the N v column density correlates with neutral-phase nitrogen abundance and nitrogen-to-alpha ratio. We find that N v is much more likely to be detected in the systems with [N/H] above 2.3 (top panel): applying Poisson statistics, N v is detected in 57% of systems at [N/H]2.3 but only 13% of systems at [N/H]2.3. Of course, one expects that the N v detection rate will increase with [N/H], because for a fixed total plasma column and nitrogen ionization fraction, (N v) is proportional to [N/H]. However, among the N v detections, log (N v) does not correlate with [N/H]. Equivalently, if we correct for the higher detectability of the higher [N/H] systems by plotting (N v)/[N/H] versus [N/H] (middle panel) for the detections, we find that these two quantities are anti-correlated. This surprising result implies that either (a) the higher-metallicity systems show smaller total plasma columns than the lower-metallicity systems (the plasma column (H ii) is (N v)/(N/H) for a fixed ionization fraction), or (b) the assumption that the neutral and plasma phases share a common nitrogen abundance is false, or (c) the assumption that [N/H]=[N i/H i] in N v-bearing DLAs is false. Given the presence of three marginal N v detections, two sub-DLAs (whose metallicity measurements may be effected by ionization corrections), and one absorber with very unusual properties (the DLA toward Q2348-1444), it would be premature to over-interpret this trend by favoring one of these three alternatives. Nonetheless, the observation that the DLAs with larger [N/H] do not show proportionally larger (N v) implies that we can rule out a model in which neutral-phase nitrogen abundance is the only factor influencing the strength of N v. Finally, no correlation is observed between (N v) (or N v detection rate) and the neutral-phase [N/] ratio (lower panel): we find a dispersion of over 1 dex in (N v) at a given [N/].
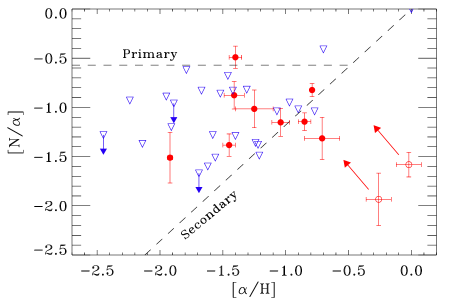
Six of the nine DLAs with N v and N i measurements fall in the region between the primary and secondary plateaus131313Cosmic nitrogen production is thought to be dominated by the CNO cycle in intermediate-mass stars; primary nitrogen is synthesized from “seed” carbon and oxygen atoms that themselves were produced in the same stars; secondary nitrogen is synthesized from carbon and oxygen atoms that were present when the star formed. in a plot of [N/] vs [/H] (Figure 4). Two of the remaining three lie slightly below the secondary plateau (as defined by Petitjean et al. 2008), with low N/ for their /H, and the third shows [N/] marginally above the primary plateau, but overall, there is nothing particularly unusual about the location in this plane of the DLAs with N v detections. The two sub-DLAs with N v fall in a different region on Figure 4 than the DLAs, each showing extremely low [N/] for their [/H]141414In the sense of showing low N/ for their /H, the two sub-DLAs in our sample behave similarly to cB58, a case-study for Lyman Break Galaxies (LBGs) at =2.7 (Pettini et al. 2002b).. Although it is tempting to interpret this as evidence that sub-DLAs represent a fundamentally different category of absorber than DLAs (indeed, many studies have found sub-DLAs have higher mean metallicities; Péroux et al. 2007, 2008; Kulkarni et al. 2007; Meiring et al. 2007, 2008), we cannot rule out the possibility that in these two cases, we are seeing ionization effects. Indeed, this would cause the sub-DLA [N/H] and [N/] to be underestimated and [/H] to be overestimated. Correcting for these effects would bring the sub-DLAs points back toward the DLA points. Furthermore, our selection by N v (i.e. by the presence of highly-ionized plasma) implies that these DLAs and sub-DLAs are the very absorbers where ionization effects are important to begin with.
5.2 Relationship between N v and other high ions
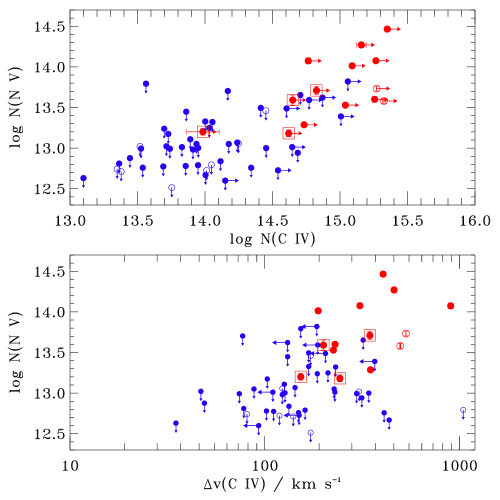
In this sub-section we consider the relationship between the N v-absorbing plasma in DLAs and the phase(s) traced by the other high ions (Si iv, C iv, and O vi). First, we compare to O vi. Of the twelve DLAs in our sample with N v, four show O vi detections (the DLAs toward Q0450–1310, Q0528–2505, Q2243–6031, and J1211+0422); in the other eight cases the O vi profiles are blended or not covered. Among the two sub-DLAs with N v detections, one (toward J0240–2309) has no coverage of O vi, and the other (toward Q1037–2704) shows strong (and partially blended) O vi absorption. More straightforward is a comparison with C iv, which (like Si iv) is detected in all the DLAs and sub-DLAs with N v. A clear correlation exists between the total C iv and N v column densities (integrated over components), as shown in Figure 5, top panel. All except one of the N v detections have log (C iv)14.6 (and the exception is a marginal N v detection). The median log (C iv) in DLAs and sub-DLAs with secure N v detections is 15.16, whereas the median log (C iv) in the general DLA population is 14.2 (Paper II). In the lower panel of Figure 5, we find a good correlation between (N v) and the total velocity width of C iv absorption (defined as the velocity width containing the central 90% of the integrated optical depth). All-bar-one of the DLAs and sub-DLAs with N v show C iv absorption extending over at least 200 km s-1, and half show C iv extending over at least 350 km s-1. Thus N v is preferentially formed in the absorbers with the most extended high-ion kinematics. We note that while these correlations show that the C iv and N v are closely related, they do not necessarily indicate that the two ions are co-spatial.
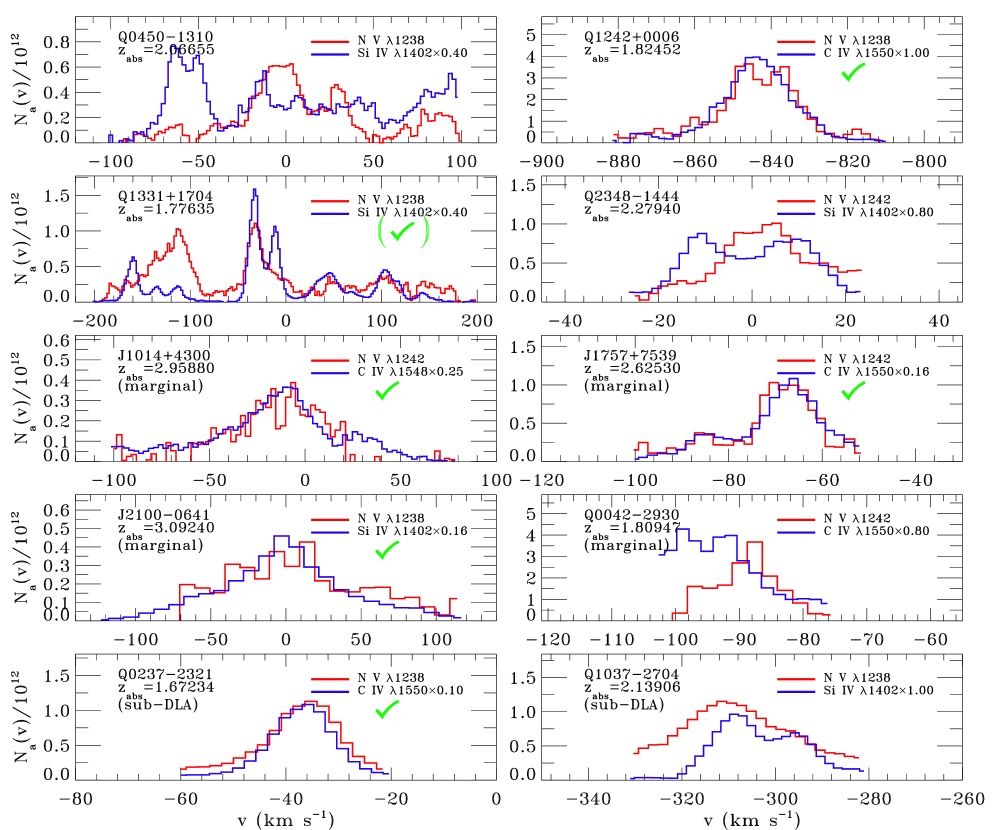
To address directly whether two given ions are co-spatial, one needs to compare the optical depth profiles of unsaturated transitions. Because of the relatively low -values of the N v doublet combined with the low nitrogen abundance in DLAs, this comparison is not always possible, since the other high-ion lines tend to be saturated at the velocities where N v is detected. However, in eight DLAs and two sub-DLAs, the N v absorption is accompanied by unsaturated absorption in at least one of C iv 1548, C iv 1550, Si iv 1393, and Si iv 1402, so that a apparent optical depth (AOD; Savage & Sembach 1991) comparison can be made. This comparison is shown in Figure 6. We find that in four out of five cases where we can compare the N v and C iv profiles, they coincide closely, which (given the similar atomic weights of nitrogen and carbon) suggests co-spatiality of the two ions. The exception is the marginal N v detection in the DLA toward Q0042–2930, where the N v profile is displaced by 4 km s-1 relative to the C iv. However, in four out of five cases where we compare N v and Si iv, clear differences between the profiles are observed: the Si iv profiles tend to be more complex, and contain narrower components, than the N v profiles.
We can further investigate whether the high ions trace similar temperature regions by analyzing the component line width distributions. The component line width (Doppler -parameter) provides information on the temperature of the absorbing gas, according to where is the atomic weight and is the non-thermal contribution to the line width. Since the atomic weights of oxygen (16), carbon (12), and nitrogen (14) are similar, the thermal line widths for O vi, C iv, and N v lines formed in the same region of gas are similar, though the Si iv lines will be narrower, since (silicon)=28. The presence of any non-thermal broadening will further reduce the differences between (O vi), (C iv), and (N v). Therefore, a -value analysis can test whether the various high ions are co-spatial. Such an analysis is shown in Figure 7. In the top panel, close similarities are seen between the distributions of (Si iv), (C iv), and (N v), which show the median values of 13.1, 16.3, and 18.3 km s-1, respectively. Although there is a slight excess of N v components at =18–24 km s-1 (relative to C iv), we cannot rule out the idea that the -value distributions for N v and C iv are drawn from the same parent population. This further supports the idea that these two ions trace the same regions of gas. Note that one can always add extra components to any Voigt-profile fit, and the effect of this is to shift the distribution of line widths to narrower values. However, since we use the same fitting procedure for all high ions, this effect should not change our conclusions.
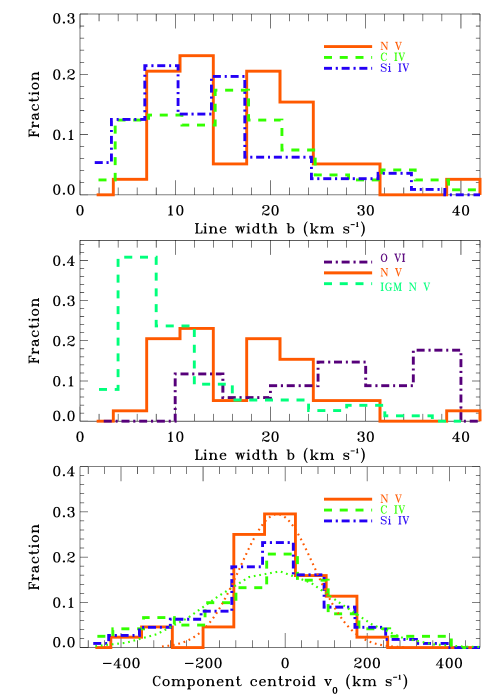
Whereas the N v component line width distribution closely follows the C iv and Si iv distributions, it differs from the O vi distribution (middle panel) taken from Paper I. The O vi distribution has a broader median -value of 25.0 km s-1, whereas 86% of the N v components have km s-1. A two-sided K-S test finds 99.9% evidence that that the O vi and N v components are not drawn from the same parent population. Thus we conclude that the majority of N v components in DLAs arise in different (cooler) regions than the O vi components. However, a word of caution is necessary, because the N v and O vi lines are detected in largely different samples of absorbers (only four DLAs show both N v and O vi). That is, we have not shown that the O vi components are broader than the N v components within individual systems; rather, we have shown than the median O vi line width in those DLAs where we can detect and measure the O vi is broader than the median N v line width in those (mostly different) DLAs where we can detect and measure the N v.
Another result visible on Figure 7 (middle panel) is that the median N v -value in DLAs and sub-DLAs of 18.3 km s-1 is significantly broader than the median N v -value of 6.0 km s-1 measured by Fechner & Richter (2009) in their survey for (intergalactic) N v absorption at high redshift. We discuss the implications of this in §6.2. In the bottom panel of Figure 7, we note that the velocity centroids (, defined relative to ) distribute similarly for C iv and Si iv, but the N v distribution is narrower. A Gaussian fit to the C iv component centroid distribution finds a FWHM of 36138 km s-1, whereas for N v, the FWHM is 20719 km s-1. This difference is due to sensitivity: the detectability of N v depends on the total plasma column density, so low-column-density, high-velocity satellite components will not be seen (particularly if their metallicity is low).
5.3 The N v ionization fraction
The N v ionization fraction (N v)N v/N is an important quantity for calculating the total ionized column density in a given absorber (see §5.4), since it quantifies the amount of nitrogen present in unseen ionization stages. (N v) is temperature-dependent in the case of collisional ionization, and density-dependent in the case of photoionization. In this sub-section we investigate the allowed range of values (N v) can take in a wide range of parameter space.
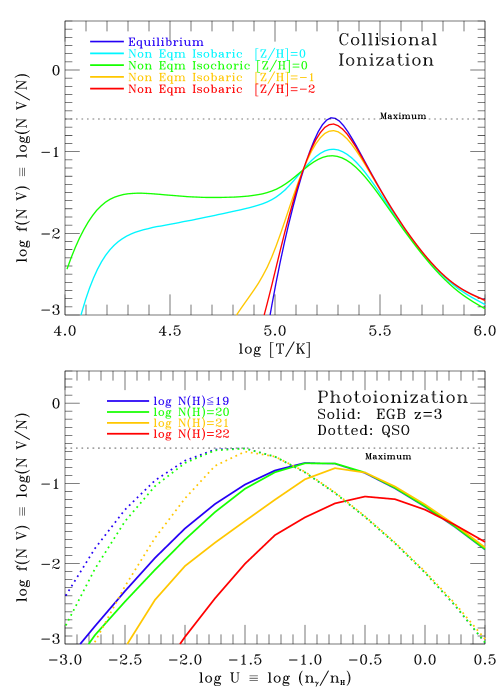
The predictions for (N v) for a range of equilibrium and non-equilibrium collisional ionization models from Gnat & Sternberg (2007) are shown in the upper panel of Figure 8. We display models computed with solar elemental abundances, and also with one-tenth and one-hundredth solar. For the solar abundance models, we show both the isobaric and isochoric cases, but for the 0.1 and 0.01 solar models, the isobaric- and isochoric-case predictions for (N v) are very similar, so we only show the isobaric models. It can be seen that the maximum value for (N v) is 0.25 (0.6 in the log), in any of the collisional ionization models. Note also that in the solar-metallicity non-equilibrium models, N v can exist at detectable levels down to surprisingly low temperatures (log =4.2–5.0). Thus a narrow N v component does not necessarily have to arise in photoionized plasma; it can also arise in collisionally-ionized plasma that has cooled out of equilibrium. However, a “cooled-gas” scenario in which collisionally-ionized N v is present at temperatures of log =4.2–5.0 is only possible for the solar metallicity case; for lower metallicities, as would apply in the DLAs under study here, the non-equilibrium models follow the equilibrium models closely and predict essentially no N v at log .
To investigate the range of values that (N v) can take in photoionized plasma, we conducted a series of CLOUDY (v08.00) models. CLOUDY (last described in Ferland et al. 1998) is a plane-parallel radiative transfer code which can predict the complete ionization breakdown in a volume of gas of given density and abundance exposed to a given radiation field. We took two cases for the input radiation field, one representing the extragalactic background (EGB) at =3 calculated by Haardt & Madau (1996), and another representing an unattenuated power-law QSO spectra with the form at Å. For each radiation field, we ran a grid of models at different ionization parameter log , where is the ratio of ionizing photon density to gas density, in each case computing the value of (N v). We then repeated this procedure for clouds of different total hydrogen column density (H)=(H i+H ii). We assumed [Z/H]=1.5 for all CLOUDY runs, with a solar relative abundance pattern maintained, though the choice of [Z/H] does not affect (N v) (see below).
The results for (N v) in the photoionization case are shown in the lower panel of Figure 8. We find that for log N(H)19, (N v) is essentially independent of N(H); this is the optically thin case. For the EGB runs, we find that (N v) is maximized for values of log between 1.2 and 0.6, corresponding (using the EGB flux density at =3) to gas densities log [(H)/cm-3] between 3.6 and 4.2, but (N v) never exceeds an absolute value of 0.20 (0.7 on the log scale). For the runs with the QSO radiation field, (N v) is maximized at lower values of log , peaking between log =2.0 and 1.0, but does not exceed 0.25 (0.6 in the log). The choice of [N/H] is unimportant: we found that the N v ionization fraction is insensitive to the absolute or the relative N abundance. When repeating the runs with the EGB at =2 rather than =3, we found essentially identical results.
In summary, (N v)0.25 in a range of collisional ionization and photoionization models covering a large range of parameter space. This justifies our use of a minimum correction factor of four when converting the N v column density to the total nitrogen column density.
5.4 H ii column density
A key goal in the study of DLA galaxies is to determine the relative fractions of neutral and ionized gas. Following the approach described in Paper I, we can calculate the H ii column density contained in the N v absorbers by correcting for ionization and metallicity:
| (1) |
where (N/H)n and (N/H)i denote the nitrogen abundances in the neutral and ionized phases, respectively. Only (N/H)n can be measured directly, and we assume equal abundances in the neutral and highly-ionized phase, i.e. (N/H)n/(N/H)i=1. We adopt (N v)0.25 (see §5.3), to give a lower limit on (H ii). (H ii) represents the H+ column living with the N v; it does not account for H+ existing at other temperatures. (H ii) is plotted against (H i) in Figure 9, where we also show the implied H ii column densities in twelve DLAs (Paper I) and three sub-DLAs (Fox et al. 2007c) with O vi detections.
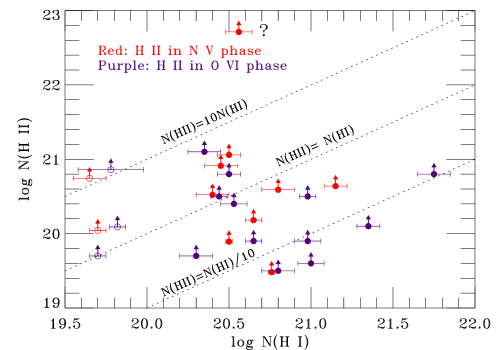
We find that when N v is detected in a DLA, the implied column of ionized hydrogen [log (H ii)19.5–21.0] is of similar order to the column contained in the O vi phase of DLAs. The median lower limit on (H ii)/(H i) among the nine intervening DLAs with N v and N i measurements is 0.34, whereas in Paper I we found a median lower limit on (H ii)/(H i) of 0.40 among nine intervening DLAs with O vi. However, only 13% of DLAs show N v, whereas at least 34% show O vi, so globally O vi is a better tracer of the highly-ionized baryons and metals. The lower limits on (H ii) implied by N v take similar values in the sub-DLAs as in the DLAs. However the ratio H ii/H i is much higher in the sub-DLAs, since their (H i) values are lower. We find (H ii)/(H i)1 in all four sub-DLAs with O vi or N v, and 10 in two of these cases151515Whether or not the H ii columns derived from N v and O vi should be summed depends on whether the two lines are co-spatial. Further line-profile comparisons are needed to investigate this.. Furthermore, in sub-DLAs the H i phase itself is thought to be ionized: Péroux et al. (2007) report a mean ionization fraction of 68% in a sample of 26 sub-DLAs with photoionization models. Therefore, a double ionization correction is necessary to determine the total baryon content in a sub-DLA system (Fox et al. 2007c).
One system bears mentioning in more detail: the DLA at =2.2794 toward Q2348–1444. The extremely strong high-ion absorption lines observed in this DLA are more typical of quasar-intrinsic “associated” absorption-line systems rather than intervening absorbers. If the assumption of equal metallicity in the neutral and N v-phases is correct, this DLA has an extremely high implied (H ii), over 100 times larger than the H i column (this data point is marked “?” near the top of Figure 9). However, if abundance inhomogeneities caused the true value of (N/H)n/(N/H)i to be 1, the value of (H ii) would be reduced accordingly. This could occur if, for example, the strong N v lines were formed in a nitrogen-enriched H ii region around an AGB star, while the N i and Lyman- lines trace the general, metal-poor ISM. Another possibility is that in this DLA, the Lyman- lines are not formed in neutral gas, but rather in a series of closely separated, predominantly ionized clouds whose total H i column sums to over 21020 cm-2. In this scenario, the measured extremely low nitrogen abundance is an artifact caused by most of the N existing in the form of N ii, but the true nitrogen abundance is higher, which in turn would lower the estimate of log (H ii) in the N v phase.
The large column densities of plasma contained in the N v phase of DLAs argue against photoionization by the EGB, for the following reason. If we take the representative values log =1.0 and log (H)=3.8 from the EGB model (§5.3), and the typical total H ii column density in the N v phase of log (H ii)=20.5 (Fig. 9), we derive a path length (cloud depth along the line-of-sight) of cm or 650 kpc. Given the expected Hubble parameter at =2.5 of 250 km s-1 Mpc-1 (from a standard WMAP cosmology; Spergel et al. 2007), such a cloud would be broadened to a line width of 160 km s-1, almost a factor of ten larger than the observed median N v component line width of 18 km s-1. If log (H) were higher or lower than the value of 3.8, the N v ionization fraction decreases and (H ii) increases, making the problem worse. Even taking a conservatively low value log (H ii)=20.0, we still arrive at a path length a factor of 3 too large. Therefore, photoionization of N v in DLAs by the EGB can be ruled out (this conclusion was also reached by Lehner et al. 2008); however, we cannot rule out photoionization by local sources.
6 Discussion
High-redshift (–3) N v absorption is found in several environments, including the intergalactic medium (Bergeron et al. 2002; Carswell et al. 2002; Simcoe et al. 2002; Boksenberg et al. 2003; Simcoe et al. 2006; Schaye et al. 2007; Fechner & Richter 2009), quasar-intrinsic or “associated” systems (Hamann 1997; Petitjean & Srianand 1999; D’Odorico et al. 2004; Fechner et al. 2004; Fechner & Richter 2009; Fox et al. 2008a), LBGs (Pettini et al. 2002b; Shapley et al. 2003), and gamma-ray burst (GRB) host galaxies (Prochaska et al. 2008c; Fox et al. 2008b; Thöne et al. 2008). As for the LBG and GRB cases, the DLA/sub-DLA N v detections reported in this paper sample galactic (or circumgalactic) plasma. A key difference is that the DLA/sub-DLA sample is not selected by luminosity, but rather by the presence of neutral gas. Consequently, the DLA/sub-DLA host galaxies likely cover a range of halo masses and morphological types.
6.1 The N v detection rate in DLAs
We report a strong dependence of the N v detection rate on neutral-phase metallicity, and in particular on nitrogen abundance, finding that the N v detection probability quadruples above [N/H]=2.3. However, among the detections, (N v) does not correlate with [N/H] or with [/H]. In this sense, N v differs from C iv and O vi, which each show strong correlations with [Z/H] (Paper I; Paper II). This difference may relate to the unusual nucleosynthetic history of nitrogen. Nonetheless, N v is preferentially found in DLAs with the largest high-ion velocity widths (Figure 5). Such extended high-ion absorption has been associated with feedback-driven galactic winds (Paper II). This association is supported by several galactic wind simulations (Oppenheimer & Davé 2006; Kawata & Rauch 2007; Fangano et al. 2007), which all predict significant high-ion absorption. Furthermore, a scenario where highly-ionized plasma in DLAs is produced following star formation (providing the metals) and Type II supernovae (providing the heating and the extended kinematics) naturally explains the (C iv)-[Z/H] and (O vi)-[Z/H] correlations.
We observe no DLAs with N v at , even though the sample extends to =4.28. This can be explained by the systems tending to have lower metallicity, as well as the increasing density of the Lyman- forest making high- N v detections more challenging161616A changing UV background following He ii reionization, thought to occur at (Reimers et al. 1997; Heap et al. 2000; Theuns et al. 2002; Zheng et al. 2004), could also explain this trend, but it would be premature to invoke this given the other explanations.. Interestingly, the detection rate of N v in our proximate DLA sample (13%) is the same as for our intervening DLA sample (13%). This is puzzling, since the enhanced radiation fields and enhanced abundances found in proximate absorbers would be expected to lead to stronger N v. Indeed, Fechner & Richter (2009) report that the fraction of C iv systems showing N v rises from 11% for intervening absorbers to 37% for proximate absorbers (see also Hamann 1997; D’Odorico et al. 2004). One possible explanation for our apparent lack of a proximity effect in DLA N v171717There is a proximity effect for DLAs in general, in that their incidence increases within several 1 000 km s-1 of the QSO (Ellison et al. 2002; Russell et al. 2006; Prochaska et al. 2008b). is that the expected QSO sphere-of-influence (the region in which the QSO radiation density exceeds the extragalactic background density) extends over only 1 500–2 500 km s-1 at , not 5 000 km s-1. In the current sample there are only a handful of cases at 2 000 km s-1 from the QSO. Indeed, Hennawi & Prochaska (2007) predict that absorbers with cm-3 will be photo-evaporated by the background quasar at Mpc, or only 250 km s-1 at =3 (see also Prochaska & Hennawi 2009). This picture is supported by the detection of strong N v absorption in two highly-proximate DLAs: one at 100100 km s-1 from the quasar (Hennawi et al. 2009), and one extending over a few hundred km s-1 around (Rix et al. 2007). Including these known systems in the sample raises the N v detection rate in proximate systems, but we still see no enhancement in the range 500–5 000 km s-1 from the QSO. This could be explained if the N v largely arises in warm-hot rather than photoionized plasma (see §6.3), because the key parameter governing the production of N v in warm-hot plasma is temperature, not UV radiation-field intensity.
On the other hand, foreground quasars have been identified near two of the twelve DLAs with N v: in the field of Q2243–6031, Worseck et al. (2008) found two foreground QSOs at projected distances of 4.6 and 7.0 Mpc from the DLA at =2.33061; toward Q0042-2930, a foreground QSO identified by the 2dF QSO Redshift Survey (2QZ; Croom et al. 2004) lies at a projected of distance 1.4 Mpc from the DLA at =1.80947. Accounting for these systems raises the fraction of N v DLAs that are associated with QSOs to 33% (at least four out of twelve).
6.2 The N v b-value distribution
6.2.1 Narrow and broad components
In the distribution of (N v), some 20% of components are narrow ( km s-1) implying the absorbing plasma is at log . A potential explanation for these narrow N v components is in collisionally-ionized plasma that has cooled out of equilibrium. However, non-equilibrium cooling plasma models (Gnat & Sternberg 2007) can only produce N v at log if the metallicity is close to solar (Figure 8), and the metallicities in the DLAs under study are generally below one tenth of solar. Thus photoionization is required as the origin of the narrow components. Since N v is difficult to photoionize with starlight (even an O-type stellar spectrum is not hard enough), and that EGB models require unreasonably large path lengths, a nearby source of hard radiation, such as an AGN, is required.
The remaining 80% of the N v components have km s-1, with a tail extending to km s-1 (such a tail has also been noted in C iv and Si iv in Paper I). The median (N v) of 18.3 km s-1 implies log =5.45 (assuming the line broadening is purely thermal), a temperature at which collisional ionization of N v is expected (Sutherland & Dopita 1993; Gnat & Sternberg 2007). Although we cannot rule out lower-temperature, photoionized solutions with a non-thermal contribution to the line widths, the observed -value distribution can be explained if a substantial fraction of the N v (and C iv and Si iv) components arise in warm-hot plasma. Note that the presence of such plasma in DLAs was already indicated by O vi (Paper I), but the differing -values of N v than O vi suggest the plasma is multi-phase. We note that some DLAs contain both narrow and broad N v components (e.g. Q0551-3637; see Table 1), suggesting that distinct regions of warm and hot plasma co-exist in the same halos.
6.2.2 Comparison: DLAs vs IGM vs Milky Way
Fechner & Richter (2009) find a narrow median N v -value of only 6.0 km s-1 in their study of N v at high redshift, whereas our median (N v) in DLAs is 18 km s-1. The basic difference between the samples is that the Fechner & Richter (2009) absorbers have H i column densities in the range log (H i)=12.5–16, whereas our sub-DLAs and DLAs all have log (H i)19.5. The differing -values suggest a fundamental difference between galactic and intergalactic N v absorption, where intergalactic N v [identified by low accompanying (H i)] is formed in warm, photoionized plasma, but the galactic N v [identified by high (H i)] is largely formed in warm-hot, collisionally-ionized plasma.
In sight lines passing through the Galactic halo (the Milky Way is, after all, a DLA), weak N v absorption is commonly observed in spectra of reasonable S/N: Indebetouw & Shull (2004) report N v detections in 32 of 34 sight lines surveyed. The majority of Galactic N v components show -values between 30 and 80 km s-1 (Sembach & Savage 1992; Savage et al. 1995, 1997; Sembach et al. 1999; Fox et al. 2003). However, a handful of interstellar N v components with narrower -values have been found, in sight lines passing through supershells (Sembach et al. 1997; Savage et al. 2001) and the Local Interstellar Medium (Welsh & Lallement 2005). Thus N v behaves similarly in high- DLAs as in the Milky Way, with each case showing a majority of broad components and a minority of narrow components. Another possible comparison is with GRB host galaxies (which are usually DLAs as well; Jakobsson et al. 2006). Fox et al. (2008b) find a median -value of 18 km s-1 for the N v components at the GRB redshift in a sample of seven afterglow spectra observed at high resolution, identical to the median (N v) measured here in DLAs. Although the N v profiles in GRB environments may be influenced by the strong flux of ionizing radiation from the burst (Prochaska et al. 2008c), this similarity in -values suggests that GRB host galaxies contain a similar phase of warm-hot interstellar plasma as do the DLA host galaxies under study here.
6.3 Collisional ionization models
To investigate the viability of collisional ionization (CI) as an origin mechanism, we consider the CI models of Gnat & Sternberg (2007), focusing on three high-ion column density ratios: N v/Si iv, N v/C iv, and N v/O vi. For each of these three diagnostics, our approach is to: (1) derive the ratios expected in the models as a function of temperature181818The Gnat & Sternberg (2007) ionization fractions are tabulated at http://wise-obs.tau.ac.il/orlyg/cooling/.; (2) select only those temperatures at which both ionization fractions (e.g. N v/N and C iv/C for the case of the N v/C iv ratio) are higher than a threshold of 0.003 (otherwise the high ions would not be observed); (3) apply a correction for the relative elemental abundance ratios appropriate for DLAs (following the procedure described in Fox et al. 2004); (4) compare these predictions to the observed ratios (see Figure 10). We analyze three CI models: the equilibrium case (CIE) and the non-equilibrium isobaric cases at [Z/H]=1 and 2. We apply a correction [N/Si]=[N/O]=1 (an average value for our sample; see Table 2), and [N/C]=0.5, which derives from combining [N/O]=1 with the finding that [C/O] in metal-poor halo stars (Akerman et al. 2004) and in the IGM (Aguirre et al. 2008).
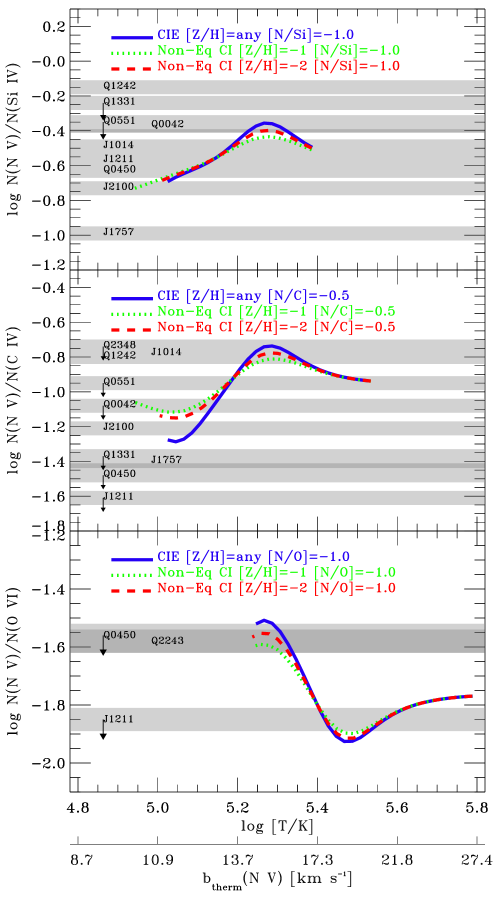
Overall, the CI models are fairly successful at explaining the integrated observed high-ion column density ratios (Fig 10). For each of the three ratios studied (N v/Si iv, N v/C iv, and N v/O vi), the model predictions corrected for the DLA relative abundance patterns cover a similar range as the observations. However, the range of temperature over which each ratio has diagnostic power differs: N v/Si iv covers the range log =5.0–5.4, N v/C iv covers log =5.0–5.5, and N v/O vi covers log =5.25–5.8. Theoretically, a solution explaining all four ions is possible near log =5.3. However, such a solution predicts log[(N v)/(Si iv)]=0.4, log[(N v)/(C iv)]=0.8, log[(N v)/(O vi)]=1.6, and no individual DLA in our sample matches all these values simultaneously. Nonetheless, we cannot rule out a multi-phase hot plasma model, in which a superposition of absorbing regions exist at different temperature, perhaps with the N v and C iv components tracing regions that have already cooled through the O vi regime; indeed, a multi-phase arrangement is strongly suggested by the -value distributions. To investigate such scenarios, detailed modelling of individual components (rather than systems) is required, which is beyond the scope of this paper. Nonetheless, the fact that the Gnat & Sternberg (2007) CI models can readily reproduce (to within a few tenths of a dex) the integrated high-ion ratios measured in DLAs lends support to (but does not prove) the idea that the high ions are formed in warm-hot plasma.
6.4 Low-metallicity/strong-high-ion DLAs
Among our sample are several DLAs with strong N v absorption and very low elemental abundances, most notably the absorber at =2.2794 toward Q2348–1444, with log (N v)=14.610.15 and [Si/H]=1.920.02. Similarly, several DLAs with (fairly) strong O vi but low O/H were reported in Paper I, e.g. the systems at =2.6184 toward Q0913+0715, with log (O vi)14.43 and [/H]=2.590.10 (see Erni et al. 2006), and at =2.4560 toward Q1409+0930, with log (O vi)=14.270.03 and [/H]=2.060.08.
These low-metallicity/strong-high-ion DLAs present interesting challenges. If the dominant hot plasma production mechanism in galactic halos is the shock-heating of infalling material (hot-mode accretion; Birnboim & Dekel 2003; Kereš et al. 2005), then hot halos ( K) are only predicted to form around galaxies with total mass (Dekel & Birnboim 2006); at lower masses, the accretion occurs in cold mode. If we combine this prediction with the suspected mass-metallicity relation in DLAs (Ledoux et al. 2006; Prochaska et al. 2008a, though see Bouché et al. 2008), then we only expect to see hot plasma in the high metallicity (high mass) cases, but we cannot explain the low-metallicity/strong-high-ion DLAs. On the other hand, it is equally difficult to explain these unusual absorbers with an outflow model, since outflowing gas (driven by supernovae) should be metal-enriched. We suggest that in these low-metallicity/strong-high-ion DLAs, there may be abundance inhomogeneities between the neutral and ionized regions, or the assumption that the H i-absorbing gas is neutral may be false. Detailed ionization modelling is required to investigate their origin.
7 Summary
By combining datasets from VLT/UVES, Keck/HIRES, and Keck/ESI, we have formed a large sample of high- and medium-resolution quasar spectra, and surveyed N v absorption in 91 DLAs and 18 sub-DLAs at redshifts between 1.67 and 4.28 with unblended data at the wavelength of N v. The motivation for this work was to search for further evidence for warm-hot plasma in high-redshift protogalactic structures, following the recent detection of DLA O vi. Our study has produced the following results.
-
1.
Among DLAs, we find eight secure N v detections (verified by both members of the doublet), four marginal N v detections (seen in one member of the doublet only, but with a consistent profile as the accompanying absorption in C iv), and 79 non-detections. The detection rate of N v in DLAs is therefore 9% (secure detections only) or 13% (marginal detections included). Among sub-DLAs, we find two secure N v detection and 16 non-detections at a similar detection rate of 11%.
-
2.
N v is more likely to be detected in DLAs with high neutral-phase metallicity. This is shown by significantly different (96.7% probability) metallicity distributions of the DLAs with and without N v detections. For the sub-sample of absorbers with nitrogen abundance measurements, we find the N v detection probability increases by a factor of 4 above [N/H]=2.3. However, among the N v detections, the N v column density does not correlate with [N/H] or with [N/]. There is no significant trend for the N v detection probability to depend on H i column density. No N v detections are found in DLAs at , even though the sample extends to .
-
3.
Four of the DLAs and one of the sub-DLAs with N v detections also show O vi absorption, and all fourteen show C iv and Si iv. The N v column density correlates with both the C iv column density and the C iv line width. The latter result, that N v is preferentially formed in the absorbers with the most extended high-ion kinematics, suggests a link to star formation, since absorbers with extended C iv velocity profiles can be explained by supernova-driven winds.
-
4.
We investigate the -value distributions of the Si iv, C iv, and N v components fit to the fourteen DLAs and sub-DLAs with N v detections. The median -values for Si iv, C iv, and N v are 13.1, 16.3, and 18.6 km s-1, respectively. The N v and C iv component distributions are similar, suggesting these two ions largely arise in the same phase. This is supported by optical depth comparisons of C iv and N v (where possible), which show that the two ions share similar profiles. However, O vi behaves differently, with a median -value of 25.0 km s-1 (Paper I). This confirms that the plasma in DLAs and sub-DLAs is multi-phase.
-
5.
Photoionization is implied for the origin of the narrow N v components (which number 20% of the total) with km s-1 and log . This is because neither non-equilibrium nor equilibrium collisional models can produce N v at these temperatures given the sub-solar metallicities of the absorbers under study. However, photoionization by the EGB is ruled out since the required path lengths are a factor of 3–10 too large to be consistent with the observed line widths, so local sources of ionizing radiation are needed.
-
6.
For the broad N v (and C iv) components (80% of the total), we cannot rule out photoionization by local sources of hard radiation (e.g. foreground AGN), but we favor collisional ionization in warm-hot plasma because:
(a) the median N v line width in DLAs =18 km s-1 is three times broader than the median reported by Fechner & Richter (2009) in the (photoionized) IGM;
(b) collisional ionization models for plasma at log =5.2–5.4 can reproduce (when corrected for the non-solar elemental abundance ratios present in DLAs) the observed integrated high-ion column density ratios in the majority of DLAs in our sample.
(c) there is no evidence for an enhanced N v detection rate in DLAs between 500 and 5 000 km s-1 from the QSO, as would be expected if the N v was predominantly photoionized. -
7.
We show that in a suite of collisional and photoionization models covering a wide range of parameter space, the N v ionization fraction (N v) is always 0.25. Assuming that in each DLA, the neutral-phase nitrogen abundance [N/H]=[N i/H i] also applies to the N v phase, we derive lower limits on the total ionized hydrogen column density in each absorber. If this assumption is correct, then in half our sample of DLAs with N v, and in both sub-DLAs with N v, there is more mass in the N v-phase alone than in the neutral gas. Taken together with the plasma’s multi-phase nature, this implies that even in those astrophysical regions where neutral gas accumulates (presumably dark matter-dominated potential wells), warm-hot plasma plays a significant role in the local baryon and metal budgets.
Acknowledgments. We thank Paolo Molaro for many useful comments, Bart Wakker for advice on CLOUDY, and Gabor Worseck for mentioning the role of foreground quasars. AJF acknowledges support from an ESO Fellowship. JXP and AMW are supported by NSF grant AST-0709235. PP and RS acknowledge support from the Indo-French Centre for the Promotion of Advanced Research (Centre Franco-Indien pour la Promotion de la Recherche Avancée) under contract No. 3004-3.
References
- Aguirre et al. (2008) Aguirre, A., Dow-Hygelund, C., Schaye, J., & Theuns, T. 2008, ApJ, 689, 851
- Akerman et al. (2004) Akerman, C. J., Carigi, L., Nissen, P. E., Pettini, M., & Asplund, M. 2004, A&A, 414, 931
- Akerman et al. (2005) Akerman, C. J., Ellison, S. L., Pettini, M., & Steidel, C. C. 2005, A&A, 440, 499
- Ballester et al. (2000) Ballester, P., Modigliani, A., Boitquin, O., et al. 2000, The Messenger, 101, 31
- Bergeron et al. (2002) Bergeron, J., Aracil, B., Petitjean, P., & Pichon, C. 2002, A&A, 396, L11
- Bergeron et al. (2004) Bergeron, J., Petitjean, P., Aracil, B., et al. 2004, Messenger, 118, 40
- Birnboim & Dekel (2003) Birnboim, Y., & Dekel, A. 2003, MNRAS, 345, 349
- Boksenberg et al. (2003) Boksenberg, A., Sargent, W. L. W., & Rauch, M. 2003, preprint (astro-ph/0307557)
- Bouché (2008) Bouché, N. 2008, MNRAS, 389, L18
- Bregman & Harrington (1986) Bregman, J. N., & Harrington, J. P. 1986, ApJ, 309, 833
- Bregman (2007) Bregman, J. N., 2007, ARA&A, 45, 221
- Carswell et al. (2002) Carswell, B., Schaye, J., & Kim, T.-S. 2002, ApJ, 578, 43
- Cen & Ostriker (1999) Cen, R., & Ostriker, J. P. 1999, ApJ, 514, 1
- Cen & Ostriker (2006) Cen, R., & Ostriker, J. P. 2006, ApJ, 650, 560
- Centurión et al. (1998) Centurión, M., Bonifacio, P., Molaro, P., & Vladilo, G. 1998, ApJ, 509, 620
- Centurión et al. (2000) Centurión, M., Bonifacio, P., Molaro, P., & Vladilo, G. 2000, ApJ, 536, 540
- Centurión et al. (2003) Centurión, M., Molaro, P., Vladilo, G., et al. 2003, A&A, 403, 55
- Chen et al. (2005) Chen, H.-W., Kennicutt, R. C., & Rauch, M. 2005, ApJ, 620, 703
- Chen & Lanzetta (2003) Chen, H.-W., & Lanzetta, K. M. 2003, ApJ, 597, 706
- Cooke et al. (2006a) Cooke, J., Wolfe, A. M., Prochaska, J. X., & Gawiser, E. 2006a, ApJ, 636, L9
- Cooke et al. (2006b) Cooke, J., Wolfe, A. M., Gawiser, E., & Prochaska, J. X. 2006b, ApJ, 652, 994
- Croom et al. (2004) Croom, S. M., Smith, R. J., Boyle, B. J., et al. 2004, MNRAS, 349, 1397
- Davé et al. (2001) Davé, R., Cen, R., Ostriker, J. P. et al. 2001, ApJ, 552, 473
- Dekel & Birnboim (2006) Dekel, A., & Birnboim, Y. 2006, MNRAS, 368, 2
- Dekker et al. (2000) Dekker, H., D’Odorico, S., Kaufer, A., Delabre, B., & Kotzlowski, H. 2000, SPIE, 4008, 534
- Dessauges-Zavadsky et al. (2003) Dessauges-Zavadsky, M., Péroux, C., Kim, T.-S., D’Odorico, S. & McMahon, R. G. 2003, MNRAS, 345, 447
- Dessauges-Zavadsky et al. (2004) Dessauges-Zavadsky, M., Calura, F., Prochaska, J. X., D’Odorico, S. & Matteucci, F. 2004, A&A, 416, 79
- Dessauges-Zavadsky et al. (2006) Dessauges-Zavadsky, M., Prochaska, J. X., D’Odorico, S. Calura, F., & Matteucci, F. 2006, A&A, 445, 93
- D’Odorico et al. (2004) D’Odorico, V., Cristiani, S., Romano, D., Granato, G. L., & Danese, L. 2004, MNRAS, 351, 976
- Ellison & Lopez (2001) Ellison, S. L., & Lopez, S. 2001, A&A, 380, 117
- Ellison et al. (2002) Ellison, S. L., Yan, L., Hook, I. M., et al. 2002, A&A, 383, 91
- Erni et al. (2006) Erni, P., Richter, P., Ledoux, C., & Petitjean, P. 2006, A&A, 451, 19
- Fangano et al. (2007) Fangano, A. P. M., Ferrara, A., & Richter, P. 2007, MNRAS, 381, 469
- Fechner et al. (2004) Fechner, C., Baade, R., & Reimers, D. 2004, A&A, 418, 857
- Fechner & Richter (2009) Fechner, C., & Richter, P. 2009, A&A, 496, 31
- Ferland et al. (1998) Ferland, G. J., Korista, K. T., Verner, D. A., et al. 1998, PASP, 110, 761
- Ferrara et al. (2005) Ferrara, A., Scannapieco, E., & Bergeron, J. 2005, ApJ, 634, L37
- Field & Steigman (1971) Field, G. B., & Steigman, G. 1971, ApJ, 166, 59
- Fox et al. (2003) Fox, A. J., Savage, B. D., Sembach, K. R., et al. 2003, ApJ, 582, 793
- Fox et al. (2004) Fox, A. J., Savage, B. D., Wakker, B. P., et al. 2004, ApJ, 602, 738
- Fox et al. (2007a) Fox, A. J., Petitjean, P., Ledoux, C., & Srianand, R. 2007a, A&A, 465, 171 (Paper I)
- Fox et al. (2007b) Fox, A. J., Ledoux, C., Petitjean, P., & Srianand, R. 2007b, A&A, 473, 791 (Paper II)
- Fox et al. (2007c) Fox, A. J., Petitjean, P., Ledoux, C., & Srianand, R. 2007c, ApJ, 668, L15
- Fox et al. (2008a) Fox, A. J., Bergeron, J., & Petitjean, P. 2008a, MNRAS, 388, 1557
- Fox et al. (2008b) Fox, A. J., Ledoux, C., Vreeswijk, P. M., Smette, A., & Jaunsen, A. O. 2008b, A&A, 491, 189
- Fukugita et al. (1998) Fukugita, M., Hogan, C. J., & Peebles, P. J. E. 1998, ApJ, 503, 518
- Gehrels (1986) Gehrels, N. 1986, ApJ, 303, 336
- Gnat & Sternberg (2007) Gnat, O., & Sternberg, A. 2007, ApJS, 168, 213
- Haardt & Madau (1996) Haardt, F., & Madau, P. 1996, ApJ, 461, 20
- Hamann (1997) Hamann, F. 1997, ApJS, 109, 279
- Hamann & Ferland (1999) Hamann, F., & Ferland, G. 1999, ARA&A, 37, 487
- Heap et al. (2000) Heap, S. R., Williger, G. M., Smette, A. M., et al. 2000, ApJ, 534, 69
- Heinmüller et al. (2006) Heinmüller, J., Petitjean, P., Ledoux, C., Caucci, S., & Srianand, R. 2006, A&A, 449, 33
- Hennawi & Prochaska (2007) Hennawi, J. F., & Prochaska, J. X. 2007, ApJ, 655, 735
- Hennawi et al. (2009) Hennawi, J. F., Prochaska, J. X., Kollmeier, J., & Zheng, Z. 2009, ApJ, 639, L47
- Henry & Prochaska (2007) Henry, R. B. C., & Prochaska, J. X. 2007, PASP, 119, 962
- Holweger (2001) Holweger, H. 2001, in AIP Conf. Proc. 598, Solar and Galactic Composition, ed. R. F. Wimmer-Schweingruber (New York: AIP), 23
- Howk & Sembach (1999) Howk, J. C., & Sembach, K. R. 1999, ApJ, 523, L141
- Indebetouw & Shull (2004) Indebetouw, R., & Shull, J. M. 2004, ApJ, 607, 309
- Izotov et al. (2001) Izotov, Y. I., Schaerer, D., & Charbonnel, C. 2001, ApJ, 549, 878
- Jakobsson et al. (2006) Jakobsson, P., Fynbo, J. P. U., Ledoux, C., et al. 2006, A&A, 460, L13
- Kawata & Rauch (2007) Kawata, D., & Rauch, M. 2007, ApJ, 663, 38
- Kereš et al. (2005) Kereš, D., Katz N., Weinberg D. H., & Dave R. 2005, MNRAS, 363, 2
- Kulkarni et al. (2007) Kulkarni, V. P., Khare, P., Péroux, C., et al. 2008, ApJ, 661, 88
- Le Brun et al. (1997) Le Brun, V., Bergeron, J., Boissé, P., & Deharveng, J. M. 1997, A&A, 321, 733
- Ledoux et al. (1998) Ledoux, C., Petitjean, P., Bergeron, J., Wampler, E. J., & Srianand, R. 1998, A&A, 337, 51
- Ledoux et al. (2003) Ledoux, C., Petitjean, P., & Srianand, R. 2003, MNRAS, 346, 209
- Ledoux et al. (2006) Ledoux, C., Petitjean, P., Fynbo, J. P. U., Møller, P., & Srianand, R. 2006, A&A, 457, 71
- Lehner et al. (2008) Lehner, N., Howk, J. C., Prochaska, J. X., & Wolfe, A. M. 2008, MNRAS, 390, 2
- Lodders (2003) Lodders, K. 2003, ApJ, 591, 1220
- Lopez et al. (2002) Lopez, S., Reimers, D., D’Odorico, S., & Prochaska, J. X. 2002, A&A, 385, 778
- Lu et al. (1996) Lu, L., Sargent, W. L. W., Barlow, T. A., Churchill, C. W., & Vogt, S. S. 1996, ApJS, 107, 475
- Lu et al. (1998) Lu, L., Sargent, W. L. W., & Barlow, T. A. 1998, AJ, 115, 55
- Maller et al. (2003) Maller, A. H., Prochaska, J. X., Somerville, R. S., & Primack, J. R. 2003, MNRAS, 343, 268
- Meiring et al. (2007) Meiring, J. D., Lauroesch, J. T., Kulkarni, V. P., et al. 2007, MNRAS, 376, 557
- Meiring et al. (2008) Meiring, J. D., Kulkarni, V. P., Lauroesch, J. T. et al. 2008, MNRAS, 384, 1015
- Molaro et al. (2000) Molaro, P., Bonifacio, P., Centurión, M., et al. 2000, ApJ, 541, 54
- Møller et al. (2002) Møller, P., Warren, S. J., Fall, S. M., Fynbo, J. U., & Jakobsen, P. 2002, ApJ, 574, 51
- Møller et al. (2004) Møller, P., Fynbo, J. P. U., & Fall, S. M. 2004, A&A, 422, L33
- Morton (2003) Morton, D. C. 2003, ApJS, 149, 205
- Nava et al. (2006) Nava, A., Casebeer, D., Henry, R. B. C., & Jevremovic, D. 2006, ApJ, 645, 1076
- Nissen et al. (2004) Nissen, P. E., Chen, Y. Q., Asplund, M., & Pettini, M. 2004, A&A, 415, 993
- Noterdaeme et al. (2008) Noterdaeme, P., Ledoux, C., Petitjean, P., & Srianand, R, 2008, A&A, 481, 327
- O’Meara et al. (2007) O’Meara, J. M., Prochaska, J. X., Burles, S., et al. 2007, ApJ, 656, 666
- Oppenheimer & Davé (2006) Oppenheimer, B., & Davé, R. 2006, MNRAS, 373, 1265
- Péroux et al. (2003) Péroux, C., Dessauges-Zavadsky, M., D’Odorico, S., Kim, T.-S., & McMahon, R. G. 2003, MNRAS, 345, 480
- Péroux et al. (2005) Péroux, C., Dessauges-Zavadsky, M., D’Odorico, S., Kim, T.-S., & McMahon, R. G. 2005, MNRAS, 363, 479
- Péroux et al. (2007) Péroux, C., Dessauges-Zavadsky, M., D’Odorico, S., Kim, T.-S., & McMahon, R. G. 2007, MNRAS, 382, 177
- Péroux et al. (2008) Péroux, C., Meiring, J. D., Kulkarni, V. P., et al. 2008, MNRAS, 386, 2209
- Petitjean et al. (1993) Petitjean, P., Webb, J. K., Rauch, M., Carswell, R. F., & Lanzetta, K. M. 1993, MNRAS, 262, 499
- Petitjean & Srianand (1999) Petitjean, P., & Srianand, R. 1999, A&A, 345, 73
- Petitjean et al. (2002) Petitjean, P., Srianand, R., & Ledoux, C. 2002, MNRAS, 332, 383
- Petitjean et al. (2006) Petitjean, P., Srianand, R., Noterdaeme, P., & Ledoux, C. 2006, A&A, 456, L9
- Petitjean et al. (2008) Petitjean, P., Ledoux, C., & Srianand, R. 2008, A&A, 480, 349
- Pettini et al. (1995) Pettini, M., Lipman, K., & Hunstead, R. W. 1995, ApJ, 451, 100
- Pettini et al. (2002a) Pettini, M., Ellison, S. L., Bergeron, J., & Petitjean, P. 2002a, A&A, 391, 21
- Pettini et al. (2002b) Pettini, M., Rix, S. A., Steidel, C. C., et al. 2002b, ApJ, 569, 742
- Pettini et al. (2008) Pettini, M., Zych, B. J., Steidel, C. C, & Chaffee, F. H. 2008, MNRAS, 385, 2011
- Prochaska & Wolfe (1996) Prochaska, J. X., & Wolfe, A. M. 1996, ApJ, 470, 403
- Prochaska & Wolfe (1999) Prochaska, J. X., & Wolfe, A. M. 1999, ApJS, 121, 369
- Prochaska (1999) Prochaska, J. X. 1999, ApJ, 511, L71
- Prochaska et al. (2002a) Prochaska, J. X., Howk, J. C., O’Meara, J. M., et al. 2002a, ApJ, 571, 693
- Prochaska et al. (2002b) Prochaska, J. X., Henry, R. B. C., O’Meara, J. M., et al. 2002b, PASP, 114, 933
- Prochaska et al. (2003a) Prochaska, J. X., Gawiser, E., Wolfe, A. M., Cooke, J., & Gelino, D. 2003a, ApJS, 147, 227
- Prochaska et al. (2003b) Prochaska, J. X., Gawiser, E., Wolfe, A. M., Castro, S., & Djorgovski, S. G. 2003b, ApJ, 595, L9
- Prochaska et al. (2007) Prochaska, J. X., Wolfe, A. M., Howk, J. C., et al. 2007, ApJS, 171, 29
- Prochaska et al. (2008a) Prochaska, J. X., Chen, H.-W., Wolfe, A. M., Dessauges-Zavadsky, M., & Bloom, J. S. 2008a, ApJ, 672, 59
- Prochaska et al. (2008b) Prochaska, J. X., Hennawi, J. F., & Herbert-Fort, S. 2008b, ApJ, 675, 1002
- Prochaska et al. (2008c) Prochaska, J. X., Dessauges-Zadavsky, M., Ramirez-Ruiz, E., & Chen, H.-W. 2008c, ApJ, 685, 344
- Prochaska & Tumlinson (2008) Prochaska, J. X., & Tumlinson, J. 2008, in Proc. Review “Astrophysics in the Next Decade: JWST and Concurrent Facilities”, ed. X. Tielens, astro-ph/0805.4635
- Prochaska & Hennawi (2009) Prochaska, J. X., & Hennawi, J. F. 2009, ApJ, 690, 1558
- Quast et al. (2008) Quast, R., Reimers, D., & Baade, R. 2008, A&A, 477, 443
- Rao et al. (2003) Rao, S. M., Nestor, D. B., Turnshek, D. A., et al. 2003, ApJ, 595, 94
- Rauch et al. (1997) Rauch, M., Miralda-Escudé, J., Sargent, W. L. W., et al. 1997, ApJ, 489, 7
- Reimers et al. (1997) Reimers, D., Kohler, S., Wisotzki, L., et al. 1997, A&A, 327, 890
- Richter et al. (2005) Richter, P., Ledoux, C., Petitjean, P., & Bergeron, J. 2005, A&A, 440, 819
- Rix et al. (2007) Rix, S. A., Pettini, M., Steidel, C. C., et al. 2007, ApJ, 670, 15
- Russell et al. (2006) Russell, D. M., Ellison, S. L., & Benn, C. R. 2006, MNRAS, 367, 412
- Savage & Sembach (1991) Savage, B. D., & Sembach, K. R. 1991, ApJ, 379, 245
- Savage et al. (1995) Savage, B. D., Sembach, K. R., & Lu, L. 1995, ApJ, 449, 145
- Savage et al. (1997) Savage, B. D., Sembach, K. R., & Lu, L. 1997, AJ, 113, 2158
- Savage et al. (2001) Savage, B. D., Sembach, K. R., & Howk, J. C. 2001, ApJ, 547, 907
- Schaye et al. (2007) Schaye, J., Carswell, R. F., & Kim, T.-S. 2007, MNRAS, 379, 1169
- Sembach & Savage (1992) Sembach, K. R., & Savage, B. D. 1992, ApJS, 83, 147
- Sembach et al. (1997) Sembach, K. R., Savage, B. D., & Tripp, T. M. 1997, ApJ, 480, 216
- Sembach et al. (1999) Sembach, K. R., Savage, B. D., & Hurwitz, M. 1999, ApJ, 524, 98
- Shapiro et al. (1994) Shapiro, P. R., Giroux, M. L., & Babul, A. 1994, ApJ, 427, 25
- Shapley et al. (2003) Shapley, A. E., Steidel, C. C., Pettini, M., & Adelberger, K. L. 2003, ApJ, 588, 65
- Sheinis et al. (2002) Sheinis, A. I., Bolte, M., Epps, H. W., et al. 2002, PASP, 114, 851
- Simcoe et al. (2002) Simcoe, R. A., Sargent, W. L. W., & Rauch, M. 2002, ApJ, 578, 737
- Simcoe et al. (2006) Simcoe, R. A., Sargent, W. L. W., Rauch, M., & Becker, G. 2006, ApJ, 637, 648
- Smette et al. (2005) Smette, A., Wisotzki, L., Ledoux, C., et al. 2005, Probing Galaxies through Quasar Absorption Lines, Proc. IAU 199, ed. Williams, Shu, & Ménard, (Cambridge: CUP), p475 (astro-ph/0504657)
- Sommer-Larsen & Fynbo (2008) Sommer-Larsen, J., & Fynbo, J. P. U. 2008, MNRAS, 385, 3
- Spergel et al. (2007) Spergel, D. N., Bean, R., Doré, O., et al. 2007, ApJS, 170, 377
- Srianand & Petitjean (1998) Srianand, R., & Petitjean, P. 1998, A&A, 335, 33
- Srianand & Petitjean (2001) Srianand, R., & Petitjean, P. 2001, A&A, 373, 816
- Srianand et al. (2005) Srianand, R., Petitjean, P., Ledoux, C., Ferland, G. & Shaw, G. 2005, MNRAS, 362, 549
- Sutherland & Dopita (1993) Sutherland, R. S., & Dopita, M. A. 1993, ApJS, 88, 253
- Theuns et al. (2002) Theuns, T., Bernardi, M., Frieman, J., et al. 2002, ApJ, 574, L111
- Thöne et al. (2008) Thöne, C., Wiersema, K., Ledoux, C., et al. 2008, A&A, 489, 37
- Viegas (1995) Viegas, S. M. 1995, MNRAS, 276, 268
- Vladilo et al. (2001) Vladilo, G., Centurión, M., Bonifacio, P., & Howk, J. C. 2001, ApJ, 557, 1007
- Vogt et al. (1994) Vogt, S. S., Allen, S. L., Bigelow, B. C., et al. 1994, Proc. SPIE, 2198, 362
- Wakker et al. (1996) Wakker, B. P., Howk, J. C., Schwarz, U., et al. 1996, ApJ, 473, 834
- Warren et al. (2001) Warren, S. J., Møller, P., Fall, S. M., & Jakobsen, P. 2001, MNRAS, 326, 759
- Weinberg et al. (1997) Weinberg, D. H., Miralda-Escudé, J., Hernquist, L., & Katz, N. 1997, ApJ, 490, 564
- Welsh & Lallement (2005) Welsh, B. Y., & Lallement, R. 2005, A&A, 436, 615
- Wolfe & Prochaska (2000a) Wolfe. A. M., & Prochaska, J. X. 2000a, ApJ, 545, 591
- Wolfe & Prochaska (2000b) Wolfe, A. M., & Prochaska, J. X. 2000b, ApJ, 545, 603
- Wolfe et al. (2005) Wolfe, A. M., Gawiser, E., & Prochaska, J. X. 2005, ARA&A, 43, 861
- Wolfe et al. (2008) Wolfe, A. M., Prochaska, J. X., Jorgenson, R. A., & Rafelski, M. 2008, ApJ, 681, 881
- Worseck et al. (2008) Worseck, G., Wisotzki, L., & Selman, F. 2008, A&A, 487, 539
- Zheng et al. (2004) Zheng, W., Kriss, G. A., Deharveng, J.-M., et al. 2004, ApJ, 605, 631
Appendix A Absorption-line measurements
[x]lcccc ccccc cc
DLA N v measurements
QSO0 Ins.1 2 log [Z/H]3 Z Line4 For.?5 , (N v)6 log
( in cm-2) (km s-1) (mÅ) ( in cm-2)
\endfirstheadDLA N v measurements (continued)
QSO0 Ins.1 2 log [Z/H]3 Z Line4 For.?5 , (N v)6 log
( in cm-2) (km s-1) (mÅ) ( in cm-2)
\endhead\endfootSecure ID
J1211+0422 H 2.54 2.37655 20.800.10 1.410.08 Si 1238 yes 130, 25 76.73.6 13.630.22
Q0450–1310 U 2.25 2.06655 20.500.07 1.450.05 Si 1238 yes 30, 115 65.62.3 13.560.02
Q0528–2505 U 2.77 2.81115 21.350.07 0.900.11 Si 1238 no 115, 100 171.02.2 14.010.05
Q0551–3637 U 2.32 1.96221 20.700.08 0.440.06 Si 1238 yes 220, 100 319.99.7 14.280.07
Q1242+0006 U 2.08 1.82452 20.450.10 1.040.07 Si 1238 yes 865, 700 167.07.3 14.050.02
Q1331+1704 U 2.08 1.77635 21.150.07 1.400.05 Si 1238 yes 200, 200 224.73.1 14.080.06
Q2243–6031 U 3.01 2.33061 20.650.05 0.850.05 Si 1238 yes 380, 350 33.62.0 13.520.01
Q2348–1444 U 2.94 2.27940 20.560.08 1.920.02 Si 1242 yes 145, 25 214.32.2 14.610.15
Marginal ID
J1014+4300 H 3.10 2.95880 20.500.02 0.710.14 Si 1242 yes 60, 25 16.52.3 13.200.04
J1757+7539 H 3.05 2.62530 20.760.02 0.790.01 Si 1242 yes 80, 55 14.82.2 13.200.03
J2100–0641 E 3.14 3.09240 21.050.15 0.720.01 Si 1242 no 75, 100 52.75.7 13.620.05
Q0042–2930 U 2.39 1.80947 20.400.10 1.250.15 Si 1242 yes 105, 75 32.24.3 13.590.04
Non-detection
HE0251–5550 U 2.37 2.33972 20.700.08 1.410.08 S 1238 no 50, 50 7.9 12.57
HE0322–3213 U 3.30 2.24338 20.500.10 0.740.10 S 1242 yes 50, 50 88.3 13.83
HE0414–2850 U 2.09 1.71903 21.200.10 0.750.10 Zn 1242 yes 50, 50 18.9 13.25
HE2225–4025 U 2.41 1.96532 20.650.10 2.260.10 Si 1242 yes 50, 50 12.1 13.05
HE2316–1012 U 1.95 1.92990 21.350.10 1.570.12 Zn 1238 no 50, 50 17.0 12.90
J0255+0008 H 3.97 3.91460 21.300.05 1.780.01 S 1242 no 20, 80 14.7 13.14
J0339–0133 H 3.20 3.06210 21.200.10 1.540.01 S 1238 yes 70, 70 27.3 12.85
J0747+2739 E 4.11 3.42330 20.850.05 1.660.21 Si 1238 yes 180, 30 26.6 13.10
J0812+3208 H 2.70 2.62630 21.350.10 0.930.05 Si 1242 yes 80, 210 9.1 12.93
J0836+1046 H 2.70 2.46530 20.580.10 1.150.05 Si 1238 yes 100, 200 86.2 13.61
J0900+4204 H 3.29 3.24580 20.300.10 0.850.02 S 1238 no 15, 60 6.2 12.47
J0929+2825 H 3.40 3.26270 21.100.00 1.620.01 Si 1242 yes 50, 100 7.0 12.82
J0930+2803 H 3.42 3.23530 20.300.10 1.970.02 Si 1242 yes 50, 0 8.4 12.89
J1021+3001 H 3.12 2.94890 20.700.10 1.940.02 Si 1238 yes 25, 70 11.7 12.74
J1131+6044 H 2.92 2.87600 20.500.15 2.130.15 Si 1238 no 100, 50 15.2 12.85
J1135+2227 H 2.88 2.78350 21.000.07 2.080.14 Si 1242 yes 50, 50 16.6 12.92
J1310+5424 H 1.93 1.80070 21.450.15 0.450.15 Zn 1242 yes 100, 100 81.9 13.88
J1357–1744 H 3.15 2.77990 20.300.15 1.860.05 Si 1238 yes 50, 0 53.6 13.26
J1410+5111 H 3.21 2.96420 20.850.20 1.960.15 Si 1238 yes 75, 200 21.7 13.01
J1435+5359 H 2.64 2.34270 21.050.10 1.480.10 Si 1238 yes 50, 70 9.5 12.65
J1506+5220 H 4.18 3.22440 20.670.07 2.330.02 Si 1238 yes 50, 30 21.3 13.00
J1558–0031 H 2.83 2.70260 20.670.05 1.990.01 Si 1238 yes 20, 20 38.4 13.16
J2036–0552 H 2.58 2.28050 21.200.15 1.710.17 Si 1238 yes 30, 50 13.1 12.79
J2241+1352 E 4.44 4.28240 21.150.10 1.760.03 S 1242 yes 15, 150 64.8 13.53
J2323+2758 E 4.18 3.68450 20.950.10 2.590.03 Si 1238 yes 50, 50 79.1 13.35
J2340–0053 H 2.09 2.05450 20.350.15 0.740.04 Si 1238 no 50, 50 22.5 12.87
J2346+1245 H 2.79 2.53790 20.360.10 1.740.01 Si 1242 yes 50, 10 32.5 13.32
Q0010–0012 U 2.15 2.02478 20.950.10 1.430.11 Zn 1238 yes 50, 50 21.9 13.01
Q0039–3354 U 2.48 2.22400 20.600.10 1.310.12 Si 1242 yes 50, 130 47.8 13.40
Q0042–2930 U 2.39 1.93560 20.500.10 1.270.10 Si 1242 yes 50, 50 32.4 13.48
Q0049–2820 U 2.26 2.07125 20.450.10 1.310.12 Si 1242 yes 20, 50 11.0 13.01
Q0100+1300 U 2.69 2.30904 21.350.08 1.460.01 S 1242 yes 50, 50 20.2 13.08
Q0102–1902 U 3.04 2.36962 21.000.08 1.900.08 S 1242 yes 50, 50 10.3 12.98
Q0112+0259 U 2.81 2.42310 20.900.10 1.310.11 S 1238 yes 50, 100 13.1 12.79
Q0112–3030 U 2.99 2.41850 20.500.08 2.420.08 Si 1238 yes 30, 30 9.1 12.63
Q0135–2722 U 3.21 2.10739 20.300.15 1.120.16 S 1238 yes 0, 120 24.0 13.05
Q0135–2722 U 3.21 2.80003 21.000.10 1.400.10 S 1242 yes 100, 50 73.6 13.73
Q0254–4025 U 2.28 2.04607 20.450.08 1.550.09 S 1238 yes 50, 50 12.7 12.77
Q0300–3152 U 2.37 2.17905 20.800.10 1.800.10 S 1238 yes 50, 50 50.0 13.21
Q0405–4418 U 3.02 1.91270 20.800.10 1.030.10 Zn 1238 yes 100, 40 68.9 13.45
Q0405–4418 U 3.02 2.54990 21.150.15 1.360.16 Zn 1242 yes 0, 150 45.8 13.52
Q0405–4418 U 3.02 2.59475 21.050.10 1.120.10 Zn 1238 yes 50, 70 58.1 13.38
Q0405–4418 U 3.02 2.62140 20.450.10 2.040.10 Si 1242 yes 70, 150 27.9 13.30
Q0421–2624 U 2.28 2.15680 20.650.10 1.860.10 Si 1238 yes 0, 230 24.0 13.05
Q0425–5214 U 2.25 2.22430 20.300.10 1.430.11 S 1238 no 75, 50 9.9 12.67
Q0432–4401 U 2.65 2.30197 20.950.10 1.230.13 S 1238 yes 150, 70 12.7 12.78
Q0458–0203 U 2.29 2.03955 21.700.10 1.220.10 Zn 1242 yes 150, 50 79.3 13.67
Q0642–5038 U 3.09 2.65860 20.950.08 1.050.09 Zn 1242 yes 100, 100 22.7 13.33
Q0841+1256 U 2.50 1.86388 21.000.10 1.510.11 S 1238 yes 100, 10 38.0 13.06
Q0841+1256 U 2.50 2.37452 21.050.10 1.270.02 Si 1238 yes 50, 50 14.1 12.82
Q0841+1256 U 2.50 2.47621 20.800.10 1.390.03 S 1238 no 50, 50 9.2 12.64
Q0933–3319 U 2.68 2.68227 20.500.10 1.270.14 Si 1238 no 50, 50 27.1 13.10
Q1036–2257 U 3.13 2.77739 20.930.05 1.360.05 S 1238 yes 15, 150 21.8 12.79
Q1055–3008 U 1.90 1.90350 21.540.10 1.300.03 Zn 1238 no 50, 50 31.6 13.17
Q1108–0747 U 3.92 3.60760 20.370.07 1.590.07 Si 1238 yes 130, 25 12.2 12.76
Q1111–1517 U 3.37 3.26548 21.300.05 1.650.11 Zn 1242 yes 70, 170 6.1 12.76
Q1157+0128 U 1.99 1.94375 21.800.10 1.440.10 Zn 1238 no 75, 50 12.8 12.78
Q1203+0218 U 2.13 1.74735 20.400.10 0.970.11 Zn 1242 yes 100, 15 72.7 13.64
Q1210+1731 U 2.54 1.89177 20.700.08 0.930.08 S 1242 yes 50, 50 71.3 13.77
Q1223+1753 U 2.94 2.46608 21.400.10 1.630.10 Zn 1242 yes 85, 150 54.6 13.55
Q1337+1121 U 2.92 2.79583 21.000.08 1.860.09 Si 1238 yes 80, 25 13.8 12.81
Q1354–1046 U 3.01 2.96680 20.800.10 1.390.10 Si 1238 no 50, 50 7.7 12.56
Q1409+0930 U 2.85 2.01882 20.650.10 1.620.16 Zn 1238 yes 50, 50 8.5 12.60
Q1409+0930 U 2.85 2.45595 20.530.08 2.060.08 Si 1238 yes 50, 50 29.0 12.96
Q2059–3604 U 3.09 3.08291 20.980.08 1.770.09 S 1242 no 25, 100 16.0 13.17
Q2138–4427 U 3.17 2.85235 20.980.05 1.740.05 Zn 1242 yes 270, 120 10.7 13.00
Q2206–1958 U 2.56 2.07622 20.440.05 2.320.05 Si 1242 yes 25, 50 16.7 12.99
Q2222–3939 U 2.18 2.15387 20.850.10 1.970.10 S 1242 no 25, 25 8.1 12.88
Q2228–3954 U 2.21 2.09437 21.200.10 1.360.12 Zn 1242 yes 35, 25 18.6 13.24
Q2230+0232 U 2.15 1.86377 20.900.10 0.810.10 S 1238 yes 50, 50 10.6 12.70
Q2311–3721 U 2.48 2.18210 20.480.13 1.33 Zn 1242 yes 100, 50 10.8 13.00
Q2314–4057 U 2.45 1.85733 20.900.10 1.020.14 Zn 1238 yes 100, 50 25.0 13.07
Q2332–0924 U 3.32 3.05725 20.500.07 1.330.08 S 1238 yes 130, 50 11.4 12.73
Q2341+0325 U 4.24 3.22030 21.350.07 1.63 Zn 1238 yes 20, 70 31.9 13.00
Q2342+3417 U 3.01 2.90910 21.100.10 1.040.02 Si 1238 yes 50, 50 38.7 13.12
Q2343+1232 U 2.76 2.43127 20.400.07 0.600.06 Si 1242 yes 350, 50 17.3 12.92
Q2348–0108 U 3.01 2.61473 21.300.08 2.020.08 Si 1242 yes 50, 50 10.5 12.99
Q2359–0216 U 2.81 2.09508 20.650.10 0.840.13 Zn 1242 yes 180, 100 44.8 13.62
Q2359–0216 U 2.81 2.15390 20.300.10 1.620.10 Si 1238 yes 150, 75 52.3 13.39
0 Our adopted QSO names follow one of three conventions, each based on the object coordinates. The UVES quasars are named either HEhhmm+ddmm (Hamburg-ESO survey, J2000) or Qhhmm+ddmm (J1950); the HIRES and ESI quasars are named Jhhmm+ddmm (J2000). We retain these (non-standardized) names to facilitate comparison with previous work. Absorbers are listed alphabetically within each category.
1 Instrument that provided the data: U=UVES, H=HIRES, E=ESI.
2 Redshift defined by velocity of strongest low-ionization component.
3 Metallicity on log scale relative to solar. Z=S, Si, or Zn as listed in adjacent column. Most [Z/H] and log (H i) measurements are from Ledoux et al. (2006), Prochaska et al. (2007), and Wolfe et al. (2008). Several others were taken from Lu et al. (1996), Ellison & Lopez (2001), Srianand & Petitjean (2001), Akerman et al. (2005), Heinmüller et al. (2006), Fox et al. (2007b), Noterdaeme et al. (2008), or Kaplan et al. (2009, in prep.).
4 N v line used for measurement.
5 Is the N v doublet in the Lyman- forest? If no, the system is within 5 600 km s-1 of background QSO, so “no” implies “proximate”.
6 N v rest-frame equivalent width, measured in the velocity range listed in the adjacent column. Upper limits are 3. In cases marked , the data are partly blended; the measurement listed here derives from the unblended velocity range, and the total could be higher.
7 For detections, is the sum of the component column densities from VPFIT. For non-detections, 3 upper limits were calculated using , where is the 3 upper limit on the equivalent width in mÅ, is in Å, and is in cm-2.
The N v doublet has =1238.821, 1242.804 Å and =0.157, 0.07821 respectively (Morton 2003).
List of DLAs with blended N v (QSO, , instrument):
HE0242–2917 2.55956 U;
J0022–1505 3.43890 H;
J0127–0045 3.72740 E;
J0133+0400 3.69260 H;
J0134+3307 3.76090 E;
J0203+1134 3.38690 H;
J0209+0517 3.66670 H;
J0209+0517 3.86430 H;
J0349–3810 3.02470 H;
J0426–2202 2.98310 E;
J0747+2739 3.90000 E;
J0808+5215 3.11320 E;
J0826+3148 2.91220 H;
J0956+4734 3.40360 E;
J0956+4734 3.89100 E;
J0956+4734 4.24420 E;
J1057+4555 3.31720 H;
J1155+0530 3.32680 H;
J1248+3110 3.69700 E;
J1253–0228 2.78280 E;
J1410+5111 2.93440 H;
J1432+3940 3.27250 E;
J1502+4803 2.56960 E;
J1723+2243 3.69470 E;
J2225+2040 3.11920 H;
Q0013–0029 1.97295 U;
Q0027–1836 2.40186 U;
Q0058–2914 2.67140 U;
Q0112–3030 2.70230 U;
Q0130+0345 3.77373 U;
Q0216+0803 1.76875 U;
Q0438–4338 2.34736 U;
Q0528–2505 2.14105 U;
Q0913+0715 2.61840 U;
Q0951–0450 3.85670 H;
Q0951–0450 4.20287 U;
Q0952–0115 4.02270 U;
Q1117–1329 3.35037 U;
Q1209+0919 2.58440 U;
Q1228–1122 2.19289 U;
Q1232+0815 2.33771 U;
Q1354–1046 2.50090 U;
Q1441+2737 4.22371 U;
Q1451+1223 2.25465 U;
Q1451+1223 2.46921 U;
Q2138–4427 2.38279 U;
Q2153+1344 3.31600 U;
Q2206–1958 1.91998 U;
Q2318–1107 1.98888 U;
Q2348–0108 2.42630 U.
[x]lcccc ccccc cc
Sub-DLA N v measurements
QSO0 Ins.1 2 log [Z/H]3 Z Line4 For.?5 , (N v)6 log
( in cm-2) (km s-1) (mÅ) ( in cm-2)
\endfirstheadSub-DLA N v measurements (continued)
QSO0 Ins.1 2 log [Z/H]3 Z Line4 For.?5 , (N v)6 log
( in cm-2) (km s-1) (mÅ) ( in cm-2)
\endhead\endfootDetection
Q0237–2321 U 2.22 1.67234 19.650.10 0.260.10 Si 1238 yes 50, 100 101.72.3 13.880.19
Q1037–2704 U 2.20 2.13906 19.700.05 0.020.10 Si 1238 yes 340, 280 67.12.0 13.770.01
Non-detection
HE0057–4126 U 2.05 1.72055 20.130.07 2.060.08 Si 1238 yes 50, 50 18.6 12.94
HE0438–1638 U 1.97 1.69420 19.850.10 0.930.10 Si 1238 yes 50, 50 30.9 13.16
J0953+5230 H 1.87 1.76780 20.100.10 0.050.05 Si 1242 yes 100, 200 58.0 13.51
Q0049–2820 U 2.26 1.88615 20.200.08 1.030.09 S 1238 yes 50, 50 24.4 13.06
Q0102–1902 U 3.04 2.92650 20.000.10 1.500.10 Si 1238 yes 50, 50 7.0 12.51
Q0331–4505 U 2.67 2.41120 20.150.07 1.41 Zn 1238 yes 40, 50 12.3 12.76
Q0331–4505 U 2.67 2.65618 19.820.05 1.490.05 Si 1238 no 50, 50 11.8 12.74
Q1101–2629 U 2.14 1.83890 19.350.04 0.820.14 S 1242 yes 65, 50 16.2 12.98
Q1220–1800 U 2.16 2.11285 20.120.07 0.930.07 S 1238 no 60, 60 11.3 12.72
Q1337+1121 U 2.92 2.50792 20.120.05 1.810.06 Si 1242 yes 50, 50 25.1 13.37
Q1340–1340 U 3.20 3.11835 20.050.08 1.420.08 S 1242 yes 125, 250 6.6 12.79
Q1409+0930 U 2.85 2.66818 19.800.08 1.410.09 S 1242 yes 200, 0 37.8 13.43
Q1444+0126 U 2.21 2.08679 20.250.07 0.800.09 Zn 1242 yes 100, 190 11.2 13.02
Q2059–3604 U 3.09 2.50735 20.290.07 1.850.20 S 1238 yes 50, 50 56.0 13.26
Q2153+1344 U 4.26 4.21225 19.700.10 1.810.10 Si 1242 no 50, 50 7.3 12.83
Q2314–4057 U 2.45 1.87519 20.100.20 1.19 Zn 1238 yes 20, 50 11.0 12.71
0 See footnote to Table A.1 for naming conventions.
1 Instrument that provided the data: U=UVES, H=HIRES, E=ESI.
2 Redshift defined by velocity of strongest low-ionization component.
3 Metallicity on log scale relative to solar. Z=S, Si, or Zn as listed in adjacent column. No ionization corrections have been applied.
4 N v line used for measurement.
5 Is the N v doublet in the Lyman- forest? If no, the system is within 5 600 km s-1 of background QSO, so “no” implies “proximate”.
6 N v rest-frame equivalent width, measured in the velocity range listed in the adjacent column. Upper limits are 3. In cases marked , the data are partly blended; the measurement listed here derives from the unblended velocity range, and the total could be higher.
7 For detections, is the sum of the component column densities from VPFIT. For non-detections, 3 upper limits were calculated using , where is the 3 upper limit on the equivalent width in mÅ, is in Å, and is in cm-2.
List of sub-DLAs with blended N v (QSO, , instrument):
Q0952–0115 3.47570 U;
Q1108–0747 3.48179 U;
Q2116–3537 1.99618 U;
Q2153+1344 3.14198 U;
Q2332–0924 2.28749 U.