A Suzaku observation of the ULIRG IRAS19254-7245: disclosing the AGN component.
Abstract
Context. We discuss here a long Suzaku observation of IRAS 19254-7245 (also known as
the Superantennae), one of the brightest and well studied Ultra Luminous Infrared
Galaxies in the local Universe.
This long observation provided the first
detection of IRAS 19254-7245 above 10 keV, and measured a 15–30 keV flux of erg cm-2 s-1 .
The detection above 10 keV has allowed us to
unveil, for the first time, the intrinsic luminosity of the AGN hosted in
IRAS 19254-7245, which is strongly absorbed (N cm-2) and
has an intrinsic luminosity in the QSO regime (L(2–10 keV) erg s-1).
The
2– 10 keV spectrum of IRAS 19254-7245 is remarkably hard (), and
presents a strong iron line (EW 0.7 keV), clearly suggesting that below 10
keV we are seeing only reprocessed radiation. Since the energy of the Fe K
emission is found to be at keV, consistent with He-like Fe, and its EW
is too high to be explained in a starburst dominated scenario, we suggest that the
2–10 keV emission of IRAS 19254-7245 is dominated by reflection/scattering from
highly ionized matter. Indeed, within this latter scenario we found that the
photon index of the illuminating source is , in
excellent agreement with the mean value found for radio quiet unobscured AGN.
Aims.
Methods.
Results.
Key Words.:
galaxies: active – galaxies: individual (IRAS 19254-7245) – galaxies: Seyfert – X-rays: galaxies1 Introduction
Ultra Luminous Infrared Galaxies (hereafter ULIRGs) are an enigmatic class of
sources which emit most of their energy in the far-infrared (FIR, 8–1000) domain (Sanders & Mirabel, 1996), with luminosities above L⊙,
(i.e., comparable to QSO luminosities). The importance of understanding the
physical processes at work in ULIRGs is strengthened by the observational
evidence that they are generally advanced mergers of gas-rich galaxies; these
events are now considered to be at the origin of some of the massive elliptical
and S0 galaxies (Hopkins et al., 2005, 2006; Springel et al., 2005) and the QSO stage
could be a phase during the evolution of these systems. However, understanding
their physical nature is complicated by the large amount of obscuration from
dust present in these sources, which makes it difficult to directly observe the
nuclear source.
X-ray observations of ULIRGs performed with XMM-Newton
(Franceschini et al., 2003; Braito et al., 2003) and Chandra (Ptak et al., 2003; Teng et al., 2005) and recently Suzaku
(Teng et al., 2009) have proved to be a
fundamental tool to disentangle the contribution of starburst and AGN activity
and to investigate the presence of hidden AGNs in these sources. These
observations have shown that ULIRGs are intrinsically faint X-ray sources,
their observed X-ray luminosities being typically L(2–10 keV)erg s-1. The X-ray spectra of ULIRGs are
complex and present the signatures of both the starburst and the AGN activity,
confirming the composite nature of ULIRGs.
These studies have
also shown that more than half of the local brightest AGN-ULIRGs (5/8) host an obscured AGN, with three
being Comption Thick (Ncm-2; NGC6240, Vignati et al. 1999; Mrk 231, Braito et al. 2004 and UGC5101,
Imanishi et al. 2003). Observations above 10
keV are thus fundamental for measuring the intrinsic X-ray luminosity of obscured
AGN hosted in ULIRGs and its contribution to their high observed FIR
emission.
IRAS 19254-7245 (also known as the SuperAntennae) belongs to a flux limited sample at m composed of the 15 brightest nearby ULIRGs (Genzel et al., 1998). Located at , IRAS 19254-7245 has an infrared luminosity of corresponding to a bolometric luminosity of erg s-1. Like most of the ULIRGs, IRAS 19254-7245 is a merger system of two gas-rich spiral galaxies.
The southern nucleus, optically classified as a Seyfert 2, is one of the
brightest nearby ULIRGs which has proved to host both a powerful starburst and an
obscured AGN, while there is no evidence of AGN activity in the northern
nucleus.
A previous X-ray observation of IRAS 19254-7245 performed with XMM-Newton suggested that this ULIRG harbors a heavily obscured and high-luminosity
AGN. Indeed the hard power-law continuum above 2 keV (photon index ) and the detection of a strong Fe-K emission line at
keV ( keV) were highly indicative of a Compton-thick source
(Braito et al., 2003). As the two nuclei are located 9 arcsec apart from each
other, XMM-Newton could not resolve them; however the centroid of the hard X-ray emission
was spatially coincident with the southern nucleus. Chandra observation which would settle or solve this
issue has not been performed yet.
The best fit model obtained
for the 0.5-10 keV X-ray emission detected with XMM-Newton was composed by a strong
soft thermal component, associated with the starburst emission and a hard X-ray
component associated with the AGN activity. This AGN component was parametrized with
a Compton thick AGN model and was composed of a pure Compton-reflected continuum (with ), a scattered power law component and a strong Fe emission line. The observed 2–10
keV luminosity of the AGN was found to be erg s-1. Due to the limited
energy bandpass of XMM-Newton, this observation did not allow us to directly see the intrinsic continuum, thus to measure
the absorbing column density and the intrinsic X-ray luminosity of
IRAS 19254-7245.
Here we present the analysis of a deep Suzaku observation ( ksec) of this system, which allowed us for the first time to constrain the intrinsic power of the AGN hosted in IRAS 19254-7245, as well as to investigate in detail the properties of the Fe line complex. In Sec. 2 we present the Suzaku data analysis and results, while in Sec. 3 we discuss the overall scenario for X-ray emission of IRAS 19254-7245. Throughout this paper, the current popular cosmology is assumed with km s-1 Mpc-1, and .
2 Observations and data reduction
Suzaku (Mitsuda et al., 2007) is the fifth Japanese X-ray satellite, which carries on board four sets
of X-ray mirrors, with a X-ray CCD (XIS; three front illuminated, FI, and one
back illuminated, BI Koyama et al., 2007) at their focal plane, and a non imaging hard X-ray
detector (HXD, Takahashi et al., 2007). The latter is composed by 2 main instruments: the Si PIN
photodiodes and the GSO scintillator counter. Altogether the XIS and the
HXD-PIN cover the 0.5–10 keV and 12–70 keV bands respectively.
Suzaku observed IRAS19254-7245 for a total exposure time of about 150 ksec; the
observation was performed at the beginning of November 2005, when all the 4 XIS were
still working111Later that month Suzaku XIS2 failed. No charge injection (see:
http://suzaku.gsfc.nasa.gov/docs/suzaku/analysis/sci.html) was applied at the time of the
observation so the nominal energy resolution of the XIS at 6 keV was degraded with
respect to the prelaunch one.
Cleaned event files from the version
2 of the Suzaku pipeline processing were used with the standard screening222The
screening filter all events within the South Atlantic Anomaly (SAA) as well as with an
Earth elevation angle (ELV) and Earth day-time elevation
angles (DYE_ELV) less than . Furthermore also data within
256 s of the SAA were excluded from the XIS and within 500s of the SAA for the HXD. Cut-off
rigidity (COR) criteria of for the HXD data and
for the XIS were used.. The net exposure times are ksec for each of the XIS
and ksec for the HXD-PIN. The XIS source spectra were extracted from a circular
region of 2.9′ radius ( which correspond to an energy encircled fraction of
90%333see ftp://legacy.gsfc.nasa.gov/suzaku/doc/xrt/suzakumemo-2008-04.pdf)
centered on the source. Background spectra were extracted from two circular regions of
2.4′ radius offset from the source and the calibration sources. The XIS response
(rmfs) and ancillary response (arfs) files were produced, using the latest calibration
files available, with the ftools tasks xisrmfgen and
xissimarfgen respectively. The net 0.5–10 keV count rates are: cts/s, cts/s, cts/s and cts/s for the XIS0, XIS2, XIS3 and
XIS1 respectively. The source spectra from the three FI CCDs were then combined, while
the BI (the XIS1) spectrum was kept separate and fitted simultaneously. The net XIS
source spectra were then binned in order to have a minimum S/N of 4 in each energy bin
and statistics have been used.
2.1 HXD-PIN data reduction
For the HXD-PIN data reduction and analysis
we followed the latest Suzaku data reduction guide (the ABC guide Version
2)444http://heasarc.gsfc.nasa.gov/docs/suzaku/analysis/abc/. For the
analysis we used the rev2 data, which include all 4 cluster units, and the
best background available (Fukazawa et al., 2009), which account for the instrumental background
(NXB; Takahashi et al., 2007; Kokubun et al., 2007). We then
simulated a spectrum for the cosmic X-ray background counts (Boldt, 1987; Gruber et al., 1999) and
added it to the instrumental one.
At the time of the writing two different instrumental background files have
been released (background A or “quick” background and the background D or
“tuned” background; Mizuno et al.
2008555http://www.astro.isas.jaxa.jp/suzaku/doc/suzakumemo/suzakumemo-2008-03.pdf;Fukazawa et al. 2009).
We tested both the instrumental backgrounds and we included a uncertainty
in the level of the CXB. The inspection of the IRAS 19254-7245 net spectrum shows that the
source is detected in the 15–30 keV with both the two background files. The net
count rate in the 15–30 keV using background A and D are respectively
cts s-1 and cts
s-1 and the corresponding background count rates are cts s-1
and cts s-1.
We then decided to use the latest
release (background D), which is affected by lower
systematic uncertainties (of about 1.3% at 1), which correspond to about half of the first
release of the NXB.
Using this background IRAS 19254-7245 is detected in the 15–30 keV band at % above the
background (a total of 2000 net counts have been collected),
corresponding to a signal-to
noise ratio . The dominant component in the background is the instrumental one with a
count rate of cts s-1, while the CXB count rate ranges from
to when we include the uncertainty on its level.
If we then assume a 10% higher CXB level the source is still detected at
% above the background (mean count rate in the 15–30 keV is
cts s-1) with S/N, thus the detection of
IRAS 19254-7245 is not dependent on the CXB absolute level.
As a further check for the level of the CXB we analyzed the Suzaku observation
of the Lockman Hole performed in May 2007. We performed an identical analysis of the CXB
HXD-PIN observation as we did for IRAS 19254-7245.
The flux of the CXB measured with the Lockman Hole observation is F(15–50 keV) erg cm-2 s-1 (corresponding to a flux density of erg cm-2 s-1 deg-2), in agreement with the flux of the simulated CXB (F(15–50 keV) erg cm-2 s-1 ) and with the flux measured with
BeppoSAX (Frontera et al. 2007) and the recent measurement obtained with Swift
(Moretti et al. 2009).
Since the HXD-PIN is a non
imaging detector, and taking into account the large field of view
of the instrument (0.56 deg 0.56 deg), we first checked that the
detection is not due to another X-ray source. In particular,
we searched the NED data base for known AGN in the HXD field of view
and we inspected the available XMM-Newton observation. Indeed, two X-ray
sources with a 2–10 keV flux comparable to IRAS 19254-7245’s emission are
detected with XMM-Newton. The two sources are both AGNs, belonging to
the XMM Bright Survey sample (XBS J193138.9-725115 and XBS J193248.8-723355;
Della Ceca et al. 2004; Caccianiga et al. 2008). XBS J193138.9-725115 is a type 1 AGN
(z=0.701) and its XMM-Newton spectrum is well modeled with single unabsorbed power law
component () with no evidence of absorption. XBS J193248.8-723355 is
a Seyfert 2 at z=0.287; the X-ray emission of this source is in
agreement with the classification as a Compton-Thin Seyfert; indeed, a
low energy cut-off is present in the XMM-Newton spectra corresponding to
cm-2 and there there is no evidence that this
source could be Compton thick.
The predicted 15–30 keV emission from these sources (derived from the analysis of the XMM-Newton and
Suzaku data) is less
than erg cm-2 s-1, which is below the HXD-PIN
sensitivity and a factor of below the measured 15–30 keV flux.
For the spectral analysis we rebinned the HXD-PIN spectrum of IRAS 19254-7245 to have a
signal-to-noise ratio of 5 in each energy bin. In order to have a first estimate of the
15–30 keV flux and luminosity of IRAS 19254-7245 we fitted the HXD-PIN spectrum assuming a power
law model with (i.e. a standard AGN value;
Reeves & Turner 2000; Page et al. 2004; Caccianiga et al. 2004). Taking
into account the systematic uncertainties of the NXB model, with this simple model we
obtained F(15–30 keV) erg cm-2 s-1 , and L (15–30 keV) erg s-1. The extrapolation of this model down to 2 keV predicts an
intrinsic luminosity (which does not include a correction for Compton scattering) of the AGN
in IRAS 19254-7245 of L(2–10 keV) erg s -1.
2.2 The broad band spectrum
Overall the Suzaku observation confirms the XMM-Newton results. A good fit for the 0.5–10
keV Suzaku data is obtained with a model composed by: a thermal emission component
( keV and abundance , likely associated with the starburst activity), a strong hard
power law component (, likely associated with the AGN emission),
and a strong iron K emission line ( eV, with respect to the
observed continuum). The flux and observed luminosity, [F(2–10 keV) erg cm-2 s-1 , and L(2–10 keV) erg s-1], are found to be
consistent with the values measured with XMM-Newton. The de-absorbed luminosity of the
starburst component is L(0.5–2 keV) erg s-1 also in agreement with
luminosity measured with XMM-Newton.
We then tested the best fit model obtained for the XMM-Newton spectrum. In this model the
soft X-ray emission is still modeled with a thermal component, while the hard () power law component is replaced with a pure Compton reflected continuum (the pexrav model in Xspec, Magdziarz & Zdziarski, 1995, with an intrinsic ) combined with a
moderately absorbed (cm-2) power law component with the
same , representing the possible scattered emission. The parameters of the reflection
component are: an inclination angle , abundance (using the abundances
of Wilms et al. 2000) and a reflection fraction (defined by the subtending solid angle of the
reflector ) R fixed to 1. The normalization of this component was allowed to
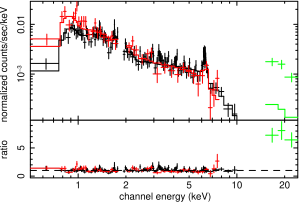
vary. This model is a good fit to the XIS data alone (, see Fig.
1) and the fluxes and observed luminosity of the AGN components are consistent with the values
measured with the XMM-Newton observation. However, this model clearly under predicts the counts detected
above 10 keV (see Fig. 1 green data points). Indeed, when we include in the fit the HXD-PIN
data, fixing the cross-normalization between the XIS and the PIN to 1.16 (Manabu et al.
2007; Maeda et al.
2008666http://www.astro.isas.jaxa.jp/suzaku/doc/suzakumemo/suzakumemo-2007-11.pdf;
http://www.astro.isas.jaxa.jp/suzaku/doc/suzakumemo/suzakumemo-2008-06.pdf), the model is
statistically unacceptable () and even allowing for a harder
photon index () it is not a good representation of the 0.5–30 keV
emission ().
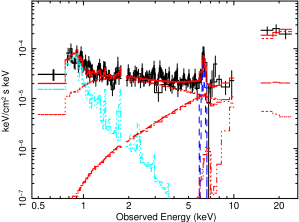
In order to account for the excess detected above 10 keV, we added to the model a
second heavily absorbed power law component. Since the HXD/PIN residuals suggest the presence of
a high column density absorber, we used for this component the model by
Yaqoob (1997) (plcabs in Xspec), which correctly takes into account Compton
down-scattering. Indeed, for high column densities the observed X-ray continuum may also be suppressed by
Compton down-scattering, and the intrinsic luminosity must be corrected by a factor
, where and cm2 is the
Thomson cross-section.
This model provides now a good fit for the 0.5–30 keV spectrum
(; see Fig. 2 upper panel and Table 1 model A). However, we found a
low value of the reflection fraction with respect to this primary absorbed power law component
(). This suggests that the line and the hard 2–10 keV
spectrum are unlikely to be produced by reflection off cold material. Indeed, the broad band
continuum could be also reproduced by a model without the reflected component (see Table 1 model B).
Statistically this model gives a slightly worse fit () than the previous one,
but it is not able to account for the hardness of the 2–10 keV emission. In particular clear residuals
are present in the 5–10 keV band where the reflected component dominates (see Fig. 2 top panel).
Finally, if we allow the photon index to vary, we found that although the fit
improves we again need an unusually hard photon index of the power law component
(, cm-2; see Table 1 model C).
One of the main results of this observation is that, although we can confirm the presence of a strong
Fe line as detected with XMM-Newton, the centroid of this line is now at keV in
the rest frame ( keV; for the model without the reflected component), consistent with
He-like Fe. Furthermore, the line appears to be marginally broad
( keV). The inclusion of the line in the model improves the fit by
for 3 degree of freedom777for the scenario with the reflected
component the fit improves by . However, if we constrain the line to be
unresolved the fit is worse only by
. In order to check the energy and the intrinsic width of the Fe line detected
in the XIS, we examined the spectra of the 55Fe calibration source lines, which are located
on two corners of each XIS. The calibration source produces lines from Mn at 5.899 keV and Mn at 5.899keV. From the spectrum
of the calibration source we found that the line energy is shifted red-wards by about 25 eV,
while the residual width is eV888This residual width is due to the degradation of the
XIS after the launch and prior to the correction with the charge injection; which confirms that the broadening of the line is intrinsic to
the source and not instrumental999 The intrinsic width of the Fe line in the spectrum of
IRAS 19254-7245 can be (where is the measured width and is the width of the calibration lines). After the subtraction in quadrature of this residual
width we get eV). However, taking into account the
present count statistics of the data, this broadening could be due to the presence of other line
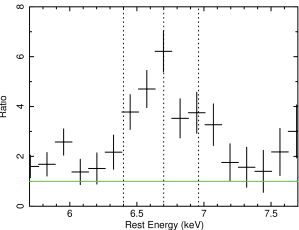
components, which are not resolved. In particular, the line profile can be explained with
three unresolved Gaussian lines (at 6.4 keV, 6.7 keV and 6.96 keV; see Fig. 3). Statistically
this model gives a similar good fit than models with a single broad line
() with the strongest line being the 6.7 keV line (
eV). Though the other two lines are not statistically required a weak ( eV) emission
line could be present at the energy of the neutral Fe K, while the 90% upper limit on the
6.96 keV line is eV.
Since the energy centroid of the line detected with Suzaku appears to be in disagreement with the XMM-Newton results and the EW appears to be lower we went back to the XMM-Newton data and compared them with the Suzaku results. The exposure time of the XMM-Newton observation was only 20 ksec and when we take into account the errors on the flux and line continuum we found that the two lines are consistent within each others. Furthermore, the energy centroids are consistent within the errors ( keV; keV). Finally, a possible blending of 3 lines was also present in the XMM-Newton data, but again the low exposure time of this observation does not allow a more detailed analysis of the Fe line profile.
From a statistical point of view all these models are a good representation of the 0.5–30
keV emission, but they are unable to account for the hardness of the continuum. Furthermore
the line energy of the strongest emission line is at odds with a scenario where the 2–10 keV
emission is dominated by reflection/scattering off cold material as assumed with the continuum
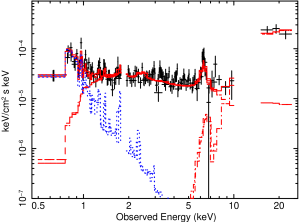
model tested above. One possibility is that the 6.7 keV line is due to reflection from highly ionized matter; we
thus replaced the cold reflected (pexrav) power law component with an ionized reflected
component, as is described by the the Ross & Fabian (2005) table (otherwise known as the reflion
model). This model allows different values for the ionization parameter of the reflecting
material and it also includes the Fe K emission line, as well as emission lines from other
elements in addition to the reflected continuum. We fixed the Fe abundance to solar and we
included a lower column density in front of the reflected component. The photon index of the
illuminating X-ray source is left as a free parameter. A good fit (see Fig. 2 lower panel and
Table 1 model D) of the 0.5-30 keV emission is obtained with a ionization parameter of erg cm s-1, where the value of the ionization is determined mainly by the
strength and energy of the Fe line; at this ionization level, Fe K emission is almost entirely
due
to Fe xxv. The reflected component is modified by a lower column density absorber with cm-2, which is probably on a larger scale
than the inner high column density absorber.
We stress that a second highly absorbed (cm-2) power-law component is still required to account for the
HXD-PIN emission and the intrinsic 2–10 keV luminosity is erg s-1. The photon index of the illuminating source is now
, consistent with the mean value measured in
unobscured radio quiet AGN (; Reeves & Turner 2000).
| Model | E | EWb | L(2–10 keV)c | L(10–30 keV)c | ||||
|---|---|---|---|---|---|---|---|---|
| cm-2 | keV/erg cm s-1 | keV | keV | 1044erg s-1 | 1044erg s-1 | |||
| A | 1.8fixed | 4.2 | 6.67 | 0.11 | 0.60 | 4.0 | 3.6 | 164/145 |
| Bd | 1.8fixed | 3.1 | 6.66 | 0.14 | 0.86 | 2.1 | 1.9 | 181/146 |
| Cd | 1.20 | 4.1 | 6.67 | 0.12 | 0.67 | 1.7 | 3.9 | 154/145 |
| Dd | 1.87 | 3.2 | 1000 | 2.6 | 2.2 | 199/147 |
a The values of are the measured ones, which are not corrected for
width of the calibration lines,
b The EW is measured against the total observed continuum
c The luminosities are derived from the XIS front illuminated CCDs
d These models do not include a cold reflected component
In
summary, this model is now able to reproduce in a consistent way all the main
characteristic of the the broad band X-ray emission of IRAS 19254-7245 and in particular the
Fe emission line detected at keV and the flatness of the observed
continuum. Finally, it is worth noting that, independently of the assumed model for
the 0.5-10 keV emission, we always need to include an absorbed power law component
to account for the HXD-PIN data with a cm-2,
and the derived 2-10 keV intrinsic luminosity is always above L(2–10 keV)
erg s-1, ranging from erg s-1to erg s-1(see Table 1).
3 Discussion and Conclusions
The detection of the Fe K emission line at 6.7 keV instead of the 6.4 keV emission line expected
from neutral iron may suggest that
this line is associated with strong starburst activity and that the emission below 10 keV is
not due to the AGN, but rather to a hot thermal plasma as expected in a starburst dominated scenario.
Indeed, from a statistical point of view we can obtain a good fit () replacing the
AGN reflected emission with a thermal component. This model gives a best fit temperature of
keV, cm-2, twice solar abundances () and a luminosity of erg s-1.
A possible origin of the high temperature ( keV) plasma could be
the presence of several SNe; their X-ray emission could in principle explain
the high temperature as well as the presence of the strong 6.7 keV line
(Persic & Rephaeli, 2002). From the FIR luminosity we estimated a SFR for IRAS 19254-7245 of 200M⊙yr-1 and a SN rate of SNe yr-1
(Mannucci et al. 2003). However, even assuming that the SNe are at the higher
end of the expected range of X-ray luminosity (erg s-1), we need
a factor 10 times more SNe than the predicted rate to maintain the observed hard
X-ray emission. Furthermore, X-ray observations of SB galaxies showed that
the major contributor to the 2–10 keV emission is the integrated emission
from High-mass X-ray binaries (HMXB) and that there is a linear relation
between the SFR and the 2–10 keV emission from HMXB. In the case of
IRAS 19254-7245 if all the FIR luminosity is due the SB activity, then the predicted
2–10 keV luminosity of the HMXB is erg s-1 (Grimm et al., 2003; Ranalli et al., 2003; Persic et al., 2004). In this scenario we would thus require
that, contrary to what seen in the other SB, the hot diffuse emission has a
luminosity similar to the contribution from HMXB. In summary, although the
starburst model can well reproduce the line intensity and the overall shape of
the 2–10 keV continuum, the luminosity of this thermal component (L (2–10
keV) erg s-1) is likely to be too high for a pure starburst
scenario.
Finally, we would like to note that if we assume that the emission
detected above 2 keV is dominated by the emission of unresolved HMXB we
still cannot explain the 6.7 keV emission line. Indeed, we would expect a
lower EW of the Fe line (EW keV; White et al. 1983; Persic & Rephaeli 2002),
which it is not consistent with the high value observed in IRAS 19254-7245. One possibility
is that only a fraction of the Fe line at 6.7 keV originates in a high
temperature plasma. We thus added to our best fit model a second high
temperature emission fixing the abundance to the solar value. This high
temperature thermal emission can account for of the flux of
the line at 6.7 keV. Though the inclusion of this emission can account
for a fraction of the Fe line at 6.7 keV, we still need a strong
ionized reflection component to account at the same time for the
continuum shape and the Fe line.
On the other hand if we attribute the hard X-ray emission to the presence of the
AGN the flatness of its observed continuum together with strong Fe
emission lines are usually considered evidence of a Compton-Thick source,
where no direct emission is seen below 10 keV and the shape is produced by
reflection off cold matter. However, contrary to what seen in other Compton
thick sources here the Fe K emission is predominately in the He-like state
with little or no 6.4 keV line.
It is often assumed that a hallmark of Compton-thick X-ray sources is a prominent Fe K emission line at keV, from neutral matter, with an EW that can exceed a keV. However, we show below that in practice, the Fe K line EW can be significantly reduced and rendered undetectable for large column densities of the order of or more. Now, the observed EW of the Fe K line is largest when only the reflected continuum that is associated with the production of the line is observed. However, if any additional continuum is observed and if its magnitude is comparable to, or greater, than the scattered/reflected continuum, the Fe K line will be “diluted” and the EW reduced. This is because for lines of sight that intercept the reprocessor, the absolute luminosity of the 6.4 keV Fe K line and its associated reflected continuum can be much less than the continuum from the Compton-thin scattering zone, so that the EW of the line measured against the total observed continuum can be much less than that measured against the continuum emerging from the Compton-thick reflector.
In this scenario the ionized Fe emission line could be produced in the same Compton-thin
zone that scatters a fraction of the intrinsic continuum into the line-of-sight. If this
scattered continuum is the dominant observed continuum (as would be the case if the direct
line-of-sight is obscured by Compton-thick matter), then the EW of the emission lines from
ionized Fe could be large, of the order of hundreds of eV or more. The details depend on
several factors, principally the ionization parameter and column density of the
line-emitting region, as well as the shape of the ionizing
continuum (see for example, detailed calculations of the EW of the Fe xxv and Fe xxvi
emission lines in Bianchi & Matt 2002). Suppose that the
Compton-thick reprocessor subtends a solid angle
at the X-ray source and that the system is observed along
a line-of-sight that does not give a direct view of
the X-ray source and that has the greatest column density, ,
(this maximizes the Fe K line EW).
Further suppose that the space between the reprocessor is
filled by a warm, optically-thin scattering zone with Thomson
depth (with ), subtending a solid angle
at the X-ray source. Then, a fraction
of the intrinsic X-ray continuum is
scattered into the observer’s line-of-sight and will reduce the EW
of the Fe K line if it dominates over the zeroth-order continuum
that is observed directly through the Compton-thick absorber.
Specifically, for column densities greater than a few , even a small value of can
significantly reduce the EW of the Fe K line. For example, for a
column density of , a scattering fraction
of will reduce the EW of an Fe K line by more than an
order of magnitude, so that an EW of 1 keV would be reduced to
less than eV, and it could render the line undetectable
(see Ghisellini et al. 1994).
Furthermore, the intrinsic EW (i.e. prior to the dilution effect) of Fe K lines depends on several
factors not only the column density of the absorber but also the geometry of the absorber
(e.g. the half opening angle of the putative torus; see
Ghisellini et al. 1994; Ikeda et al. 2009; Matt et al. 1996). For example for an half opening angle of and our estimate of the
column density of the neutral absorber the intrinsic EW of the 6.4 keV Fe line can span the range
from 1 to 4 keV (Ghisellini et al., 1994).
The inferred column
density of the Compton-thick reprocessor
implies that a scattering fraction of only in the
optically-thin zone is required to begin to dilute the
6.4 keV Fe K line and a scattering fraction of a few
percent is sufficient to reduce the EW of the line well
below 100 eV, consistent with the upper limit of the EW
and the % scattering fraction (measured with respect to
the de-absorbed primary power law component) as measured with the Suzaku data.
A second possible geometry is that we have a
direct view of the inner surface of the Compton-thick reprocessor, but the outer part of this
reprocessor is ionized. In this case, if the remaining part of the reprocessor is Compton-thin, the EW
of the 6.4 keV Fe K line will be reduced and the emission detected below 10 keV is the
reflected emission from this inner ionized surface of the torus which will also produce a strong 6.7
keV line.
Thus, we
see that the lack of a large EW neutral Fe K in
IRAS 192547245 is not unexpected.
The spectrum below 10 keV is then
dominated by this optically-thin scattered continuum and
the dominance of the emission line from ionized Fe is
consistent with this picture.
It is worth noting that this is not a unique case of a
detection of a strong 6.7 keV line in a luminous infrared
galaxy. Other examples are Arp299 (Ballo et al., 2004),
Arp220 (Iwasawa et al., 2005; Teng et al., 2009), and IRAS 00182-7112
(Nandra & Iwasawa, 2007). For all these sources although the
optical spectra show no clear signature of AGN
activity, their X-ray emission and the 6.7 keV line can
be explained with the presence of an AGN and an ionized
reflector as in the case of IRAS 19254-7245. However, while in the
case of Arp 299 and Arp 220, the X-ray luminosity is
not indicative that the major contributor to the
bolometric luminosity is a high-luminosity AGN, in the
case of IRAS 00182-7112 the X-ray luminosity is too large
to be accounted for by the strong starforming activity
(Lerg s-1) as for IRAS 19254-7245. For all these
sources, the presence of a strong ionized Fe line, with
little or no 6.4 keV line, could be reconciled with the
picture of a heavily obscured AGN assuming that we do not
have a direct view of the reflected continuum, because
it is is diluted by the scattering from
the ionized matter, that is associated with the production
of the line, or if the surface of the putative
Compton-thick reprocessor is highly ionized.
Overall to account for the X-ray emission of IRAS 19254-7245 above
2 keV, we need two absorbing/reflecting media: one
neutral and Compton-Thick and probably seen in transmission, and
one ionized and probably seen in reflection. This latter is
responsible for the flat X-ray spectrum emerging below 10
keV, for the He-like Fe K line and probably for the dilution
of the 6.4 keV Fe line produced in the neutral
Compton-Thick absorber.
Despite the various possible models for the 0.5–10 keV emission,
we always need a neutral high column density absorber to
account for the emission emerging above 10 keV.
Once we have corrected for the amount of absorption, the
intrinsic 2–10 keV luminosity of the primary AGN
component is erg s-1. This high column
density absorber may also be the one responsible for the
deep hydrocarbon absorption detected in the L-band
spectrum (Risaliti et al., 2003) at 3.4. Finally,
independently from the assumed model for the 2–35 keV
emission (i.e. ionized reflection or scattered power law
component), we always require the soft thermal component
to account for the 0.5–2 keV emission. As already found
for other ULIRGs this thermal component has a temperature
keV; the luminosity of this component is
erg s-1.
Although, we cannot exclude a possible contribution from
the ionized reflector, the measured soft X-ray
luminosity is in agreement with that expected from the
FIR luminosity and the SFR of IRAS 19254-7245 (Ranalli et al., 2003; Persic et al., 2004).
The total X-ray luminosity estimated from the intrinsic
component at keV can be converted into a bolometric
luminosity and compared with the total infrared emission.
We adopted the -luminosity correlation of
Steffen et al. 2006 in order to estimate the 2500 Å luminosity, and the Elvis et al. 1994 quasar spectral
energy distribution to estimate the total luminosity of
the AGN component. Assuming
erg s-1, we obtain
erg s-1, i.e. about
50% of the infrared luminosity. A different way to estimate the AGN luminosity is through
its emission in the mid-infrared, the only other band
where the continuum emission of the AGN is not completely
suppressed. Nardini et al. (2008), from an analysis of the
Spitzer-IRS spectrum estimated an AGN contribution to the
bolometric luminosity of IRAS 19254-7245 of %.
Considering the uncertainties in the bolometric
corrections in both the X-ray and the mid-infrared bands,
the two estimates can be considered in rough agreement.
If the difference is assumed to be real, this could be an indication
of the non-complete covering factor of the AGN circumnuclear absorber:
indeed, the estimate form the mid-infrared spectrum is done assuming
a complete reprocessing of the intrinsic AGN emission in the infrared.
However, the optical classification of IRAS 19254-7245 as a Seyfert 2
suggests that the obscuration of the nuclear source is not complete.
The estimates from the X-ray and infrared spectra would be then
perfectly reconciled assuming a covering factor
of the obscuring material of about 50%.
In conclusion, this deep Suzaku observation allowed us to measure for the first time the
hard X-ray emission of IRAS 19254-7245 and infer that its intrinsic 2–10 keV luminosity is
of about few times erg s-1. We have found evidence that the AGN hosted in IRAS 19254-7245 is
highly obscured, with a measured column density of the
neutral absorber of cm-2. We confirm the presence of a strong iron K emission line with an keV. The energy of iron K emission line is found to be consistent with Fe xxv.
We propose that the X-ray emission detected below 10 keV can be ascribed to
scattered/reflected emission from highly ionized matter, which could be identified with the
warm Compton-thin gas which fills the space between the neutral Compton-Thick reprocessor.
Acknowledgements.
VB acknowledge support from the UK STFC research council. RDC acknowledge financial support from the ASI (Agenzia Spaziale Italiana) grant I/088/06/0. Support for this work was provided by the National Aeronautics and Space Administration through the NASA grant NNG04GB78A. We thank the anonymous referee for his/her useful comments, which have improved this paper.References
- Ballo et al. (2004) Ballo, L., Braito, V., Della Ceca, R., Maraschi, L., Tavecchio, F., & Dadina, M. 2004, ApJ, 600, 634
- Bianchi & Matt (2002) Bianchi, S., & Matt, G. 2002, A&A, 387, 76
- Boldt (1987) Boldt, E. 1987, Phys. Rep, 146, 215
- Braito et al. (2003) Braito, V., et al. 2003, A&A, 398, 107
- Braito et al. (2004) Braito, V., et al. 2004, A&A, 420, 79
- Caccianiga et al. (2008) Caccianiga, A., et al. 2008, A&A, 477, 735
- Caccianiga et al. (2004) Caccianiga, A., et al. 2004, A&A, 416, 901
- Della Ceca et al. (2004) Della Ceca, R., et al. 2004, A&A, 428, 383
- Elvis et al. (1994) Elvis, M., et al. 1994, ApJS, 95, 1
- Franceschini et al. (2003) Franceschini, A., et al. 2003, MNRAS, 343, 1181
- Frontera et al. (2007) Frontera, F., et al. 2007, ApJ, 666, 86
- Fukazawa et al. (2009) Fukazawa, Y., et al. 2009, PASJ, 61, 17
- Genzel et al. (1998) Genzel, R., et al. 1998, ApJ, 498, 579
- Ghisellini et al. (1994) Ghisellini, G., Haardt, F., & Matt, G. 1994, MNRAS, 267, 743
- Grimm et al. (2003) Grimm, H.-J., Gilfanov, M., & Sunyaev, R. 2003, MNRAS, 339, 793
- Gruber et al. (1999) Gruber, D. E., Matteson, J. L., Peterson, L. E., & Jung, G. V. 1999, ApJ, 520, 124
- Kokubun et al. (2007) Kokubun, M., et al. 2007, PASJ, 59, 53
- Hopkins et al. (2005) Hopkins, P. F., Hernquist, L., Cox, T. J., Di Matteo, T., Martini, P., Robertson, B., & Springel, V. 2005, ApJ, 630, 705
- Hopkins et al. (2006) Hopkins, P. F., Hernquist, L., Cox, T. J., Di Matteo, T., Robertson, B., & Springel, V. 2006, ApJS, 163, 1
- Ikeda et al. (2009) Ikeda, S., Awaki, H., & Terashima, Y. 2009, ApJ, 692, 608
- Imanishi et al. (2003) Imanishi, M., Terashima, Y., Anabuki, N., & Nakagawa, T. 2003, ApJ, 596, L167
- Iwasawa et al. (2005) Iwasawa, K., Sanders, D. B., Evans, A. S., Trentham, N., Miniutti, G., & Spoon, H. W. W. 2005, MNRAS, 357, 565
- Koyama et al. (2007) Koyama, K., et al. 2007, PASJ, 59, 23
- Magdziarz & Zdziarski (1995) Magdziarz, P., & Zdziarski, A. A. 1995, MNRAS, 273, 837
- Mannucci et al. (2003) Mannucci, F., et al. 2003, A&A, 401, 519
- Matt et al. (1996) Matt, G., Brandt, W. N., & Fabian, A. C. 1996, MNRAS, 280, 823
- Mitsuda et al. (2007) Mitsuda, K., et al. 2007, PASJ, 59, 1
- Moretti et al. (2009) Moretti, A., et al. 2009, A&A, 493, 501
- Nandra & Iwasawa (2007) Nandra, K., & Iwasawa, K. 2007, MNRAS, 382, L1
- Nardini et al. (2008) Nardini, E., Risaliti, G., Salvati, M., Sani, E., Imanishi, M., Marconi, A., & Maiolino, R. 2008, MNRAS, 385, L130
- Page et al. (2004) Page, K. L., Reeves, J. N., O’Brien, P. T., Turner, M. J. L., & Worrall, D. M. 2004, MNRAS, 353, 133
- Persic & Rephaeli (2002) Persic, M., & Rephaeli, Y. 2002, A&A, 382, 843
- Persic et al. (2004) Persic, M., Rephaeli, Y., Braito, V., Cappi, M., Della Ceca, R., Franceschini, A., & Gruber, D. E. 2004, A&A, 419, 849
- Ptak et al. (2003) Ptak, A., Heckman, T., Levenson, N. A., Weaver, K., & Strickland, D. 2003, ApJ, 592, 782
- Ranalli et al. (2003) Ranalli, P., Comastri, A., & Setti, G. 2003, A&A, 399, 39
- Reeves & Turner (2000) Reeves, J. N., & Turner, M. J. L. 2000, MNRAS, 316, 234
- Risaliti et al. (2003) Risaliti, G., et al. 2003, ApJ, 595, L17
- Ross & Fabian (2005) Ross, R. R., & Fabian, A. C. 2005, MNRAS, 358, 211
- Sanders & Mirabel (1996) Sanders, D. B., & Mirabel, I. F. 1996, ARA&A, 34, 749
- Springel et al. (2005) Springel, V., Di Matteo, T., & Hernquist, L. 2005, MNRAS, 361, 776
- Steffen et al. (2006) Steffen, A. T., Strateva, I., Brandt, W. N., Alexander, D. M., Koekemoer, A. M., Lehmer, B. D., Schneider, D. P., & Vignali, C. 2006, AJ, 131, 2826
- Takahashi et al. (2007) Takahashi, T., et al. 2007, PASJ, 59, 35
- Teng et al. (2005) Teng, S. H., Wilson, A. S., Veilleux, S., Young, A. J., Sanders, D. B., & Nagar, N. M. 2005, ApJ, 633, 664
- Teng et al. (2009) Teng, S. H., et al. 2009, ApJ, 691, 261
- Vignati et al. (1999) Vignati, P., et al. 1999, A&A, 349, L57
- Weedman & Houck (2008) Weedman, D. W., & Houck, J. R. 2008, ApJ, 686, 127
- White et al. (1983) White, N. E., Swank, J. H., & Holt, S. S. 1983, ApJ, 270, 711
- Wilms et al. (2000) Wilms, J., Allen, A., & McCray, R. 2000, ApJ, 542, 914
- Yaqoob (1997) Yaqoob, T. 1997, ApJ, 479, 184