X-ray irradiated protoplanetary disk atmospheres II:
Predictions from models in hydrostatic equilibrium
Abstract
We present new models for the X-ray photoevaporation of circumstellar discs which suggest that the resulting mass loss (occurring mainly over the radial range AU) may be the dominant dispersal mechanism for gas around low mass pre-main sequence stars, contrary to the conclusions of previous workers. Our models combine use of the MOCASSIN Monte Carlo radiative transfer code and a self-consistent solution of the hydrostatic structure of the irradiated disc. We estimate the resulting photoevaporation rates assuming sonic outflow at the surface where the gas temperature equals the local escape temperature and derive mass loss rates of yr-1, typically a factor times lower than the corresponding rates in our previous work (Ercolano et al., 2008) where we did not adjust the density structure of the irradiated disc. The somewhat lower rates, and the fact that mass loss is concentrated towards slightly smaller radii, result from the puffing up of the heated disc at a few AU which partially screens the disc at tens of AU. Our mass loss fluxes agree with those of Alexander et al. (2004) but we differ with Alexander et al. in our assessment of the overall significance of X-ray photoevaporation, given the large disc radii (and hence emitting area) associated with X-ray driven winds. Gorti and Hollenbach (2009), on the other hand, predict considerably lower mass loss fluxes than either Alexander et al., (2004) or ourselves and we discuss possible reasons for this difference. We highlight the fact that X-ray photoevaporation has two generic advantages for disc dispersal compared with photoevaporation by extreme ultraviolet (EUV) photons that are only modestly beyond the Lyman limit: the demonstrably large X-ray fluxes of young stars even after they have lost their discs and the fact that X-rays are effective at penetrating much larger columns of material close to the star. We however stress that our X-ray driven mass loss rates are considerably more uncertain than the corresponding rates for EUV photoevaporation (around yr-1) and that this situation will need to be remedied through future radiation hydrodynamical simulations.
1. Introduction
The study of the structure and evolution of protoplanetary disks is currently an important area of astronomy as it can provide insights into both star and planet formation. In recent years there has been considerable debate about the final destination of disc material - do discs disperse through a mixture of accretion onto the star and internal consumption by conversion into planets, or are they instead dispersed by an extrinsic agent which can operate in competition with planet formation? Obviously, the answer to this question relates to the lifetime of circumstellar discs and the efficiency of planet formation around stars of various masses.
Since disc dispersal by central wind stripping is not very efficient (Matsuyama, Johnstone & Hollenbach, 2009) and since encounters with passing stars is ineffective in all but the densest environments (Scally & Clarke 2001, Pfalzner et al., 2006), and since likewise the effect of photoevaporation by neighbouring OB stars requires a very rich cluster environment (Johnstone et al., 1998), the most likely extrinsic agent of disc dispersal is via photoevaporation by energetic (ultraviolet or X-ray) radiation of the central star. Indeed the detection of Ne ii emission in the spectra of e.g Pascucci et al. (2007) and Herczeg et al. (2007) is widely interpreted as evidence for disc irradiation by high energy photons and potentially accompanying photoevaporation. Opinion is however currently divided as to whether this is best explained in terms of irradiation by X-rays (e.g. Glassgold 2007, Ercolano 2008b, Meijerink 2008) or ionising ultraviolet (EUV) radiation (Gorti & Hollenbach 2008, Alexander 2008).
The X-ray properties of low mass pre-main sequence stars are well determined (in contrast to the case for the EUV radiation from these stars), with flux levels that are, if anything, somewhat higher in the case of Weak Line (discless) T-Tauri stars than in their disc bearing (Classical T Tauri star) counterparts (Preibisch et al., 2005, Feigelson et al., 2007): although this may result from absorption of some of the X-ray emission in accretion flows close to the star (Gregory et al., 2007, but see also Drake et al., 2009), it at least demonstrates that the X-rays remain strong throughout and after the disc bearing stage and are therefore, in principle, available for disc dispersal. The corresponding observational situation in the EUV case is much less clear, given the lack of suitably high quality ultraviolet spectra, particularly in Weak Line T Tauri stars (Alexander, Clarke & Pringle, 2005; Kamp & Sammar, 2004).
Another potential drawback to EUV photoevaporation is that, even if one has an accurate estimate of the EUV output of the star, it does not necessarily follow that these photons can reach the disc, since photons near the Lyman limit are particularly susceptible to absorption by even small columns of neutral material close to the star. This represents a possible counter-argument to Ne ii emission being excited by EUV radiation in most cases. It is usually therefore argued (e.g. Gorti & Hollenbach, 2009) that EUV photoevaporation cannot be effective until late times when the subsiding of both accretion and outflow activity should allow the disc to be exposed to ionising photons. From this point onwards, the theory is well developed (Hollenbach et al., 1994, Clarke et al., 2001, Alexander et al., 2006a,b), with a predicted photoevaporation rate of yr-1, for an EUV luminosity of 1041s-1 (the rate goes as the square root of the assumed luminosity), and the interplay between photoevaporation and accretion producing a characteristic evolutionary sequence involving the creation and rapid outward expansion of an inner disc hole. Thus EUV photoevaporation provides an alternative to planet formation as the origin of inner hole (transition disc) systems (see e.g. Najita et al., 2007).
Notwithstanding this success of EUV photoevaporation at late times in removing the last few Jupiter masses of gas from the disc, there has also been some discussion of whether other radiation sources, such as X-rays or non-ionising (FUV) ultraviolet photons, might not be much more effective disc photoevaporation agents at early times and might indeed be capable of removing much larger quantities of disc gas. Gorti & Hollenbach (2009) investigated this issue and argued that FUV photoevaporation is indeed a very significant effect at early times when accretion produces a strong FUV flux: their predicted FUV mass loss rates of yr-1 exceed EUV rates by more than two orders of magnitude. They however concluded, by contrast, that X-rays, in the absence of FUV radiation, are considerably less important even than the EUV, a conclusion also shared by Alexander et al. (2004).
Another recent study of X-ray photoevaporation was provided by Ercolano et al 2008b, henceforth Paper I. While Paper I mainly aimed at understanding the thermochemical structure of the irradiated regions of the disk and at identifying gas-phase emission line diagnostics (see also Ercolano, Drake & Clarke 2008c), it also yielded an estimate for the X-ray photoevaporation rate that was considerably higher than those found by Gorti & Hollenbach (2009) and Alexander et al (2004), being around yr-1. This estimate was however very preliminary, due not only to the general difficulty of estimating mass loss rates from static models (see Section 6), but on account of the fact that the disc’s density structure was not modified in response to heating of its upper layers. Instead it was assumed that the disc adopted the fixed structure that it would have in the case that its temperature structure was controlled by full thermal coupling between dust and gas (d’Alessio et al., 1998). This is clearly inconsistent given that the gas and dust temperatures in the X-ray irradiated disc turn out to be completely decoupled down to a column depth of 51021 cm-2. In contrast, Gorti & Hollenbach (2009) and Alexander et al. (2004) both iterated to a self-consistent hydrostatic density structure for the irradiated disc. Since these authors had previously concluded that X-ray photoevaporation is a minor effect, it would appear necessary to check how a similar iteration onto a hydrostatic structure would affect the initial estimate of Paper I. The reason for pursuing a study that is broadly similar to those of Gorti & Hollenbach (2009) and Alexander et al. (2004), is that there are a number of differences in the way that the radiative transfer is treated in the three works. We employ a fully three dimensional Monte Carlo approach to the radiative transfer through dust and gas, and, while - in the present paper - we iterate on the density profile at each cylindrical radius, the final radiation field and temperature structure represents the thermal equilibrium condition for a given density field, without any simplifying assumptions about the geometry of the resulting radiative flux vectors. The other two works instead employ methods that are pseudo-one dimensional in that they integrate along a range of lines of sight from the X-ray source. There are also some other differences concerning the assumed spectrum of the X-ray source and some details about the detailed interaction between X-rays and gas that are discussed in more detail in Section 5.
The calculations presented here thus aim specifically at providing an improved estimate of X-ray photoevaporation rates, together with a comparison with the results of using irradiating spectra that also include an EUV component. For computational tractability, only the inner 50AU of the disk, from which significant photoevaporation is found, are considered here and therefore a full emission line spectrum is not available. This will be investigated in future work.
A description of the computational methods is given in Section 2. Our improved photoevaporation rates are presented and discussed in Section 3, while Section 4 describes the resulting thermal and ionisation structures. Section 5 analyses differences in methods and results compared with previous studies and Section 6 sets out the main uncertainties involved in estimating mass loss rates from hydrostatic models. Section 7 summarises our main results.
2. Photoionisation models in hydrostatic equilibrium
We have used a modified version of the 3D photoionisation and dust radiative transfer code mocassin (Ercolano et al., 2003; 2005; 2008a). This code uses a Monte Carlo approach to the three-dimensional transfer of radiation, allowing for the self-consistent transfer of both the stellar (primary) and diffuse (secondary) components of the radiation field. Details of atomic data and physical processes used for the photoionisation calculations are given by Ercolano et al. (2003, 2008a) and Ercolano & Storey (2006). The main changes to the thermal balance and dimensional setup of the code have been described in detail in Paper I and are briefly summarised here. (i) A treatment of viscous heating is included using the formulation for a thin disk by Pringle (1981). (ii) Gas cooling by collisions of grains with a mixture of atomic and molecular hydrogen is calculated using the method of Hollenbach & McKee (1979), also discussed by Glassgold et al. (2004). (iii) mocassin was adapted to allow for two dimensional simulations in order to exploit the symmetry of the system.
In Paper I, viscous accretion heating was included using the standard treatment for a thin disk (Pringle 1981) with viscosity parameter =0.01. This corresponds to an accretion rate of the order of 10. This is rather high, in particular as we are interested in the effects of X-ray photoevaporation in later stages of disk evolution when accretion has turned off. This is achieved in our models by setting =10-10 which effectively renders accretion heating negligible. We have also improved the model in Paper I by including excitation of C i and O i fine structure lines by collisions with neutral hydrogen (only collisions with electrons were previously included, see Ercolano, Drake & Clarke, 2008 for more details).
2.1. Hydrostatic Equilibrium
We have further modified the mocassin code to include a self-consistent calculation of the 1D vertical hydrostatic equilibrium structure (HSE) of the X-ray heated disk. We used the methods described by Alexander, Clarke and Pringle (2004, ACP04) to update the disk density structure after convergence of the thermal and ionisation structure based on the previous HSE iteration.
Our initial density distribution is the same as that used in Paper I and it consists of the disk model structure calculated by D’Alessio et al. (1998), selected to be that which best fits the median SED of T Tauri stars in Taurus (d’Alessio, 2003). This model was calculated under the assumption of full thermal coupling between dust and gas and featured an irradiating star of mass 0.7 M⊙, radius 2.5 R⊙, and an effective temperature of 4000 K. Disk parameters include a mass accretion rate of 10 M⊙ yr-1 and a viscosity parameter = 0.01. The total mass of the disk is 0.027 M⊙ and the outer radius of 500 AU. The surface density in the disk is inversely proportional to the cylindrical radius.
We perform HSE calculations in the vertical direction, using as a lower boundary the point on the z-axis where the gas and dust temperatures become decoupled. As in Paper I, we keep the dust temperatures fixed to the values calculated by D’Alessio et al. (2001) given that without treating the stellar or interstellar optical and far-UV fields, the dust temperatures we would obtain from our model would be incorrect. Calculating the hydrostatic equilibrium from the decoupling point has the advantage of keeping a realistic density structure below this point even when only X-ray irradiation is considered (i.e. not treating the photospheric emission of the pre-main sequence star).
The density structure from the lower boundary point is calculated using a slightly modified version of equation A9 of ACP04, as shown below. At a given cylindrical radius, the number density of the gas as a function of height above the midplane, , is given by
| (1) |
where and are density and temperature at the lower boundary, is the mass of the star, is the gravitational constant, is the mass of the hydrogen atom and is the Boltzmann constant. is calculated as follows
| (2) |
where is the mean molecular weight of the gas at and is the cylindrical radius.
Equations 1 and 2 differ from equation A9 of ACP04 in that we do not assume z R. We note, however, that a full treatment would consist of a two-dimensional HSE in the radial and vertical directions – with gravity balanced by pressure in the vertical direction and with gravity balanced by a combination of pressure and centrifugal forces in the radial directions. In the case of an irradiated disk with significant vertical extent the pressure terms are very complicated and a full solution is not attempted in this paper. It is indeed unclear whether a fully two-dimensional hydrostatic solution would improve our calculations, particularly in the upper layers of the disk, where the assumption of hydrostatic equilibrium is altogether poor given that material is likely to be flowing in a photoevaporative wind. However a full hydrodynamical flow solution is beyond the scope of this paper.
2.2. The dust model
Although we do not calculate the dust temperatures, the effects of gas-dust interactions on the temperature structure of the gas, are still taken into account in our gas thermal balance as well as in the radiative transfer, where the competition between dust and gas for the absorption of radiation is properly treated (see Ercolano et al., 2005). Our dust treatment consists of a standard MRN-type model (Mathis, Rumpl & Nordsiek, 1977) with minimum and maximum grain radii m and . The disk structure of d’Alessio et al. (1998), which provides our starting density distribution, employs a bimodal dust distribution, where atmospheric dust follows the standard MRN model and interior dust consists of larger grains with a size distribution still described by a power law of index of , but with m and . The transition between atmospheric and interior dust occurs at an height of 0.1 times the midplane gas scale height. As we are mainly interested in regions well above the transition point, we have chosen for simplicity to use atmospheric dust everywhere. Following d’Alessio et al. (2001) the dust to gas mass ratio of graphite is 0.00025 and that of silicates is 0.0004.
High energy dust absorption and scattering coefficients are calculated from the dielectric constants for graphite and silicates of Laor & Draine (1993), which extend to the X-ray domain. Spherical grains are assumed and we use the standard Mie scattering series expansion for complex refractive indices, , where is the scattering parameter (see Laor & Draine, 1993). For and we use Rayleigh-Gans theory (Bohren & Huffman, 1983), and for and we use the treatment specified by Laor & Draine (1993), which is based on geometric optics.
2.3. T-Tauri EUV-X-ray Spectra
We illuminate the disk using synthetic X-ray spectra representative of the high-energy emission from a typical T Tauri star corona. This coronal X-ray emission arises from a collision-dominated optically-thin plasma.
We first assumed a single X-ray temperature, , and a number of luminosities spanning 2 orders of magnitudes around our base luminosity of (0.1-10 keV) erg/sec (Model XS0H10Lx1). The labelling scheme of our models is explained in Section 2.4. The bulk of the luminosity in these models is emitted in the 1-2 keV region as shown in Figure 1. The same unabsorbed isothermal model spectrum for Log(TX) = 7.2 was also used in Paper I and we refer to that work for a more detailed description of the computational methods and atomic data used.

While such a model provides an accurate description of the X-ray spectrum, it represents only a lower limit to the unabsorbed flux at EUV wavelengths ( Å) where cooler plasma can contribute significant flux. In Paper I we argued that for most of a disk’s lifetime EUV photons would not easily reach the disk due to absorption from circumstellar material and restricted our investigation to the X-ray dominated irradiation spectrum above. Here we expand our study to explore the effects that different amounts of EUV irradiation would have on a disk that is also simultaneously irradiated by X-ray. In a companion paper (Glassgold et al., 2009 in prep.) we study the relative importance of EUV and X-rays on ionisation and heating rates, while here we focus on their effects on photoevaporation. To this aim, we employ a more sophisticated multi-temperature plasma model developed to provide an accurate representation of the ionizing coronal spectrum throughout the EUV-X-ray range. We have not included any contributions to the ionizing flux from accretion here; this will be considered in future work.
Observed line-of-sight absorbing columns toward T Tauri stars are typically greater than atoms cm-2 (e.g. Feigelson & Montmerle 1999), and consequently their EUV spectra are completely obscured from our view by photoelectric absorption. While this would appear to be a rather serious impediment to producing a realistic T Tauri EUV spectrum, there are much more nearby and relatively unabsorbed sources that provide a template: the RS CVn class of active binaries that comprise at least one evolved star lying on the sub-giant or giant branch. The coronal emission of RS CVn binaries is largely dominated by the evolved component that is likely to be magnetically more similar to a T Tauri star than are active main-sequence stars with shallower convection zones. Rotation periods of RS CVn binaries are also similar to those of T Tauri stars and typically lie in the range 1-10 days (e.g., Strassmeier et al. 1993, Getman et al., 2005).
The expected resemblance of the coronal properties of RS CVn-type binaries and T Tauri stars is borne out in X-ray studies. For example, the Einstein survey of late-type stars by Schmitt et al. (1990) obtained plasma temperatures for RS CVns in the range with a mean of order , and X-ray luminosities in the range erg s-1. These ranges are very similar to those found for T Tauri stars of the Orion Nebular Cluster (ONC) in the mass range 1-2 by Preibisch et al. (2005). On this basis, the use of RS CVn EUV spectra as a proxy for the coronal spectra of T Tauri stars seems well-justified.
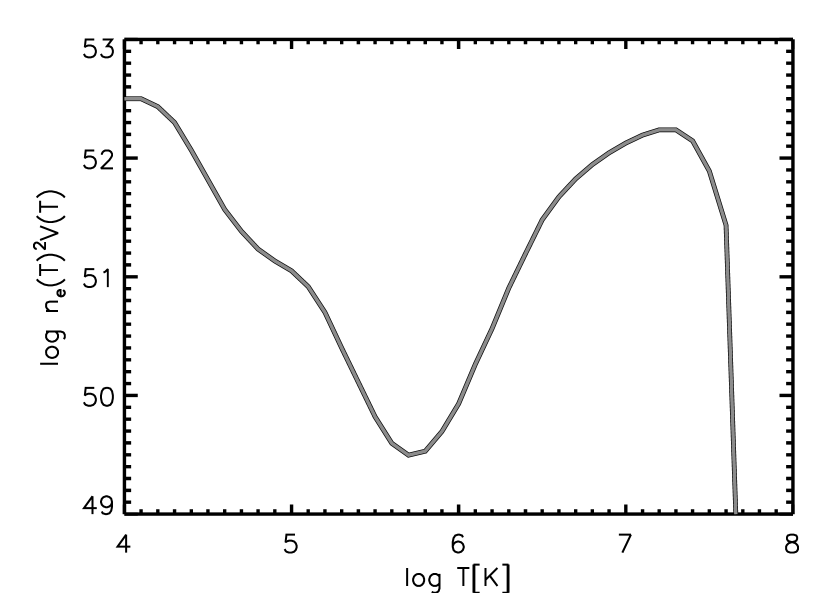
Detailed studies of the outer atmospheric temperature structure of RS CVn-type binaries also finds similarity in the transition regions and lower coronae of different stars. Sanz-Forcada et al. (2002) studied four active RS CVns in detail from UV to the shortest EUV wavelengths using spectra obtained from the International Ultraviolet Explorer (IUE), the Extreme Ultraviolet Explorer (EUVE) and the Orbiting and Retrievable Far and Extreme Ultraviolet Spectrometer (ORFEUS). They derived emission measure distributions as a function of temperature for the range –7.2 and we use a representation of these for the emission measure distribution adopted as the basis of our T Tauri model. This emission measure distribution is illustrated in Figure 2. The Sanz-Forcada et al. (2002) emission measures are rather ill-constrained for temperatures owing to the paucity of spectral line diagnostics in the EUV range at these temperatures. For this range we have adopted a smooth function that peaks at and drops off fairly sharply for temperatures . The temperature of the peak is based on the two-temperature optically-thin thermal plasma model fits to the large sample of Chandra ONC T Tauri spectra by Maggio et al. (2007).
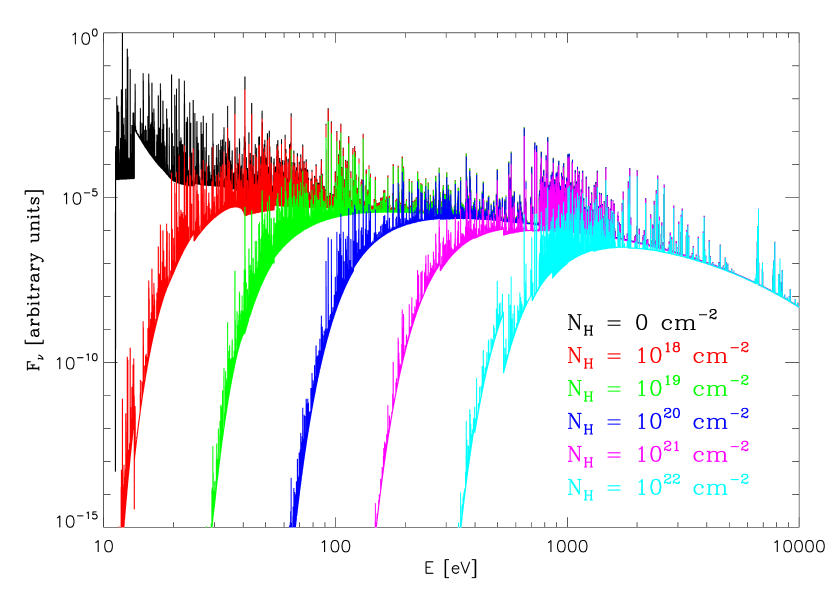
Coronal spectra based on the emission measure distribution in Figure 2 were computed as described in Paper I using the PINTofALE IDL software suite111PINTofALE is freely available from http://hea-www.harvard.edu/PINTofALE (Kashyap & Drake 2000), using line and continuum emissivities from the CHIANTI compilation of atomic data (Landi & Phillips 2006, and references therein), ion populations from Mazzotta et al. (1998), and the solar chemical composition of Grevesse & Sauval (1998). Figure 3 shows the resulting EUV+X-ray spectrum produced (black line); the emergent luminosity is roughly the same in the EUV (13.6100 eV) and X-ray regions ().
In order to account for absorption of coronal EUV and X-ray photons in the immediate local stellar and circumstellar environment, disk irradiation calculations were also performed for spectra attenuated by photoelectric absorption corresponding to neutral hydrogen column densities in the range – cm2. The gas transmittance was computed using the cross-sections compiled by Wilms, Allen, & McCray (2000) as implemented in PINTofALE. The effects of different ’pre-screening’ columns on the radiation impinging on the disk are shown by the coloured lines in Figure 3, where the black, red, green, blue, magenta and cyan lines show the transmitted spectrum through columns of 0., 1018, 1019, 1020, 1021 and 1022 cm-2, respectively. The corresponding models are labeled FS0H2, FS18H2, FS19H2, FS20H2, FS21H2, FS22H2. For the disk photoionisation calculations, spectra were normalised to an X-ray luminosity .
Finally, in Paper I, we assumed the height of the stellar irradiating source to be 10 stellar radii (R∗) above the disk mid-plane, as was adopted in earlier studies (e.g. Glassgold et al., 1997, Igea & Glassgold 1999) This represents quite a large scale height for coronal emission, and the source of quiescent X-rays is likely to reside much closer to the star. Indeed, Flaccomio et al. (2005) found evidence for rotationally modulated X-rays from T Tauri stars in the Orion Nebular Cluster, indicating that the dominant emission from those stars lies at scale heights of order the stellar radius or below. Gregory et al. (2006) also find that simple extrapolations of T Tauri surface magnetograms suggest compact coronal structures. We therefore adopt here a height of 2 R∗ for the X-ray source, corresponding to the X-ray emission originating from a point located 1 R∗ above the stellar pole. We also investigate the effect of this scale height choice and find that changing the source height between 2 and 10 R∗ has relatively little influence on the results.
2.4. Model specification
Table 1 contains a summary of the parameters used for the models presented in this paper. In general models are labeled as nSsHhLxl, where ’n’ is ’F’ for models using EUV+X-ray irradiating spectra (Figure 3) and ’X’ for models using the single temperature Log(TX) = 7.2 spectrum. ’s’ indicates the pre-screening column and it is 0 for no pre-screening and 22 for a pre-screening column of 10. ’h’ indicates the height of the irradiating source which is 2 or 10 (stellar radii). ’l’ indicates the X-ray luminosity used, e.g. 01, 1, 10 for L, 2, 2, respectively.
| Spectrum | Column | Height | Hydro | Ṁ | ||
|---|---|---|---|---|---|---|
| [M⊙/yr] | ||||||
| XS0H2Lx1 | X-ray | 0. | 2 | 2.e30 | TRUE | 2.0e-9 |
| XS0H10Lx1 | X-ray | 0. | 10 | 2.e30 | TRUE | 1.2e-9 |
| XS0H10Lx01 | X-ray | 0. | 10 | 2.e29 | TRUE | 2.4e-10 |
| XS0H10Lx02 | X-ray | 0. | 10 | 4.e29 | TRUE | 4.5e-10 |
| XS0H10Lx04 | X-ray | 0. | 10 | 8.e29 | TRUE | 7.0e-10 |
| XS0H10Lx08 | X-ray | 0. | 10 | 1.6e30 | TRUE | 1.1e-9 |
| XS0H10Lx2 | X-ray | 0. | 10 | 4.e30 | TRUE | 2.2e-9 |
| XS0H10Lx4 | X-ray | 0. | 10 | 8.e31 | TRUE | 4.0e-9 |
| XS0H10Lx10 | X-ray | 0. | 10 | 2.e31 | TRUE | 5.9e-9 |
| XS0H10Lx20 | X-ray | 0. | 10 | 4.e31 | TRUE | 1.1e-8 |
| FS0H10Lx1 | X-ray+EUV | 0. | 10 | 2.e30 | TRUE | 3.5e-9 |
| FS0H2Lx1 | X-ray+EUV | 0. | 2 | 2.e30 | TRUE | 4.5e-9 |
| FS18H2Lx1 | X-ray+EUV | 1018 | 2 | 2.e30 | TRUE | 4.5e-9 |
| FS19H2Lx1 | X-ray+EUV | 1019 | 2 | 2.e30 | TRUE | 4.2e-9 |
| FS20H2Lx1 | X-ray+EUV | 1020 | 2 | 2.e30 | TRUE | 4.0e-9 |
| FS21H2Lx1 | X-ray+EUV | 1021 | 2 | 2.e30 | TRUE | 2.7e-11 |
| FS22H2Lx1 | X-ray+EUV | 1022 | 2 | 2.e30 | TRUE | – |
| XS0H2Lx1_FG | X-ray | 0. | 2 | 2.e30 | FALSE | 1.1e-8 |
| XS0H10Lx1_FG | X-ray | 0. | 10 | 2.e30 | FALSE | 8.1e-9 |
| FS0H10Lx1_FG | X-ray+EUV | 0. | 10 | 2.e30 | FALSE | 2.2e-8 |
| FS0H2Lx_FG | X-ray+EUV | 0. | 2 | 2.e30 | FALSE | 2.2e-8 |
| FS18H2Lx1_FG | X-ray+EUV | 1018 | 2 | 2.e30 | FALSE | 1.5e-8 |
| FS19H2Lx1_FG | X-ray+EUV | 1019 | 2 | 2.e30 | FALSE | 1.3e-8 |
| FS20H2Lx1_FG | X-ray+EUV | 1020 | 2 | 2.e30 | FALSE | 7.7e-9 |
| FS21H2Lx1_FG | X-ray+EUV | 1021 | 2 | 2.e30 | FALSE | 1.3e-9 |
| FS22H2Lx1_FG | X-ray+EUV | 1022 | 2 | 2.e30 | FALSE | – |
We have adopted the following elemental abundances, given as number densities with respect to hydrogen, He/H = 0.1, C/H = 1.410-4, N/H = 8.3210-5, O/H = 3.210-4, Ne/H = 1.210-4, Mg/H = 1.110-6, Si/H = 1.710-6, S/H = 2.810-5. These are solar abundances (Asplund et al. 2005) depleted according to Savage & Sembach (1996).
Given the differences in the code and input parameters from those used in Paper I, we also produced a set of fixed density structure models in order to compare with the HSE and isolate the effects of the latter. This is made necessary particularly by the fact that the HSE models are likely to overestimate the densities in the upper layers (which would be in reality part of a photoevaporative flow), hence fixed density structure models, which underestimate the density of the upper layers, can be used to provide an educated guess of the uncertainties in the results. “Fixed grid” models are listed in Table 1 with the suffix ’FG’.
3. X-ray photoevaporation rates and timescales for disk dispersal
We estimate photoevaporation rates assuming that the mass loss rate per unit surface is roughly , where and are, respectively, the gas density and the sound speed evaluated at the base of the flow. The base of the flow is defined as the location in the disk atmosphere where the gas temperature exceeds the local escape temperature, , where is the stellar mass and is the radial distance. The total mass loss rates Ṁ are obtained by integrating over the disk surface. This simple approach, as discussed in Paper I, introduces significant uncertainties in the calculation of mass loss rates. These are further discussed in Section 5 and 6.
The last column of Table 1 lists the mass loss rates obtained by our models. The sensitivity of these rates to the model parameters are discussed in more detail below. Our general results show that soft X-rays (roughly a few 100 eV) are most efficient at driving a photoevaporative wind, producing a mass loss rate of the order of 10-9 M⊙/yr.
Illuminating spectrum and pre-screening columns
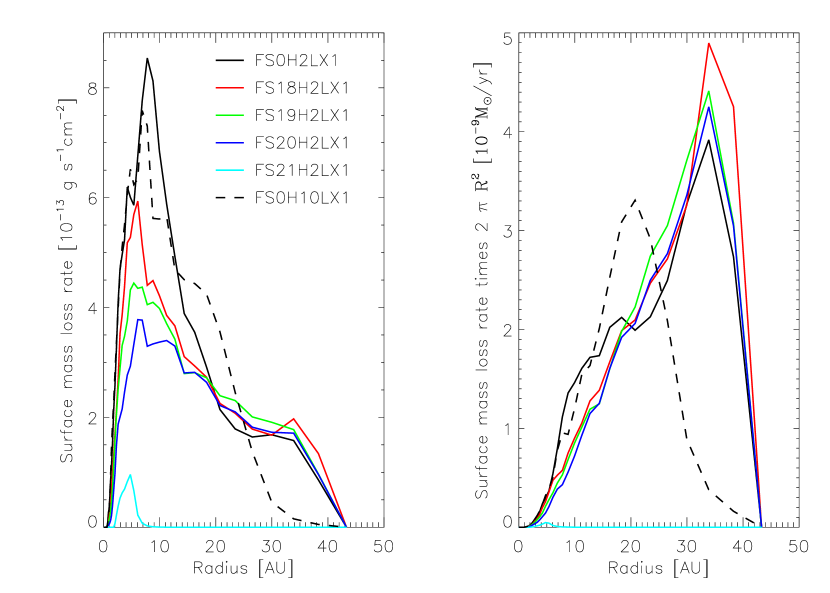
The values in Table 1 show that both for HSE and fixed density structure models the total mass loss rates are not very sensitive to the inclusion of EUV (100eV) radiation. The models show very similar values of Ṁ for pre-screening columns ranging from 0. to 10, implying that the radiation screened by columns of up to 10 (energies less than 100eV) is less efficient than higher energy radiation at dispersing the disk by photoevaporation. This can be understood by examining the surface mass loss rates, , and total mass loss rates, Ṁ, of models with different pre-screening columns, as shown for the hydrostatic equilibrium models in Figure 4. Although at 5-10AU decreases as the pre-screening column increases (see left panel of Figure 4), however at larger radii (20-30 AU) is roughly invariant for columns up to 10. Total mass loss rates are dominated by the surface emission at larger radii, due to the radius squared dependence of the mass loss rate integral, and therefore they also appear to be invariant for absorbing columns up to 10. This is shown in the right panel of Figure 4 where the quantity is plotted as a function of radius, R. We plot as this quantity is generally used as a rough estimate of Ṁ; in Table 1, however, we give the values of Ṁ obtained by formally integrating over the whole disk.
The reason why at radii in the 20-30 AU range appears to be roughly the same for models with obscuring columns up to (which screen out EUV radiation) is that the thermal structure of the disk at this radial distance is hardly affected by EUV radiation which is very weak at these radii due to large neutral H opacity of the disk at EUV wavelengths. Radiation at soft X-ray wavelengths, on the other hand, is optimal for heating this region of the disk.
For columns larger than 10 we see a drastic drop in total mass loss rates, as shown in Table 1. A model with a pre-screening column of 10 (FS21H2Lx1; cyan line in Figure 4) is approximately a factor of 200 lower than for models with lower pre-screening columns and a model with a pre-screening column (FS22H2Lx1; not plotted in Figure 4) shows no photoevaporation at all. This is due to the fact that these high pre-screening column models, while having the same total X-ray luminosity as less screened ones, have a much harder spectrum (see Figure 3, but note that for clarity the spectra shown in this figure have not been normalised). The reason for keeping the total X-ray luminosity constant is to be able to isolate the effects of the irradiating spectral shape. “Hard” X-rays ( 1 keV) have very large penetration depths and therefore they do not heat the upper layers of the disk as efficiently as their lower energy counterparts. Their energy is “dispersed” in a larger column and, while these photons are vital to achieve a low-level ionisation deep in the disk interior, which is a basic requirement of the magneto rotational instability theory (Balbus and Hawley, 1991), their contribution to the heating of the upper disk layers and therefore to disk dispersal is insignificant. We note at this point that previous work by Gorti & Hollenbach (2009, GH09), who used a rather hard X-ray spectrum to irradiate their disks also obtained very low photoevaporation rates (see discussion in Section 5).
Height of the illuminating source
Results of models with the illuminating source at a height H = 2 are not too dissimilar from those with H = 10 (as assumed in Paper I). The radial dependences of and Ṁ for a model with H = 10 (FS0H10Lx1) are represented by the dashed lines in the left and right panels of Figure 4, respectively. at 5-10 AU for the H = 10 model (FS0H10Lx1) is comparable to the values obtained for the H = 2 model (FS0H2Lx1), at 20 AU, however the H = 10 model produces about a factor of two higher , but negligible levels of photoevaporation at larger radii (30-40 AU). This results in peaking at 20 AU rather than 35 AU as for the model with H = 2 . The reason for this inward shift of the peak mass loss flow is due to the fact that radiation emitted from H = 10 hits the inner disk traveling along rays that are closer to the normal to the disk surface, resulting in a more efficient heating of these regions. A warmer inner disk is more puffed up and more likely to screen the material at larger radii, hence producing lower photoevaporation rates than in the H = 2 case.
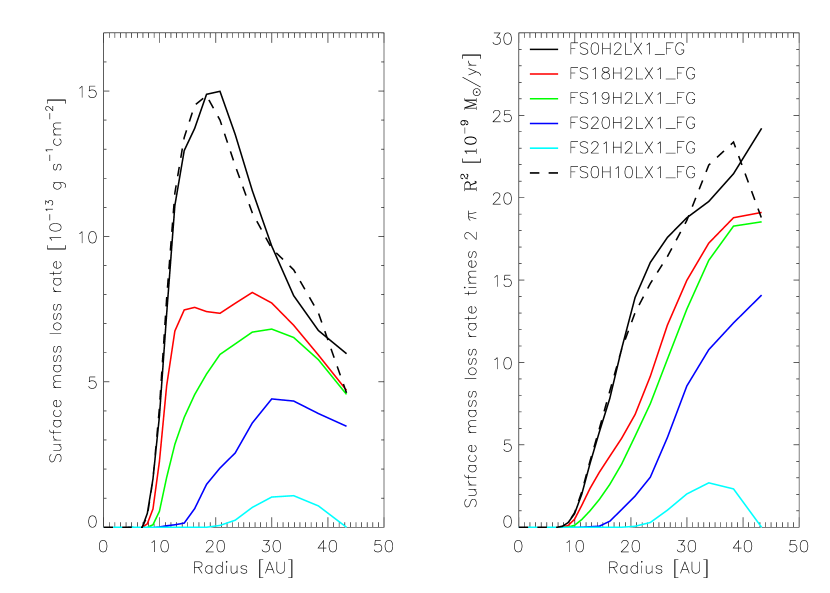
The above interpretation is borne out by the fixed density structure model results for H = 10 and H = 2 (FS0H10Lx1_FG and FS0H2Lx1_FG). Here the density distribution of the disk is fixed and equal for both models and, indeed, we see no difference in the mass loss rates (see Table 1 and dashed lines in Figure 5).
We finally note that the total mass loss rate obtained from the HSE model with H = 10 (FS0H10Lx1) is only about 20% smaller than that obtained for the same model with with H = 2 FS0H10Lx1 (FS0H2Lx1), and therefore not a real cause for concern, given the (larger) error implicit to our estimate of (see Section 6).
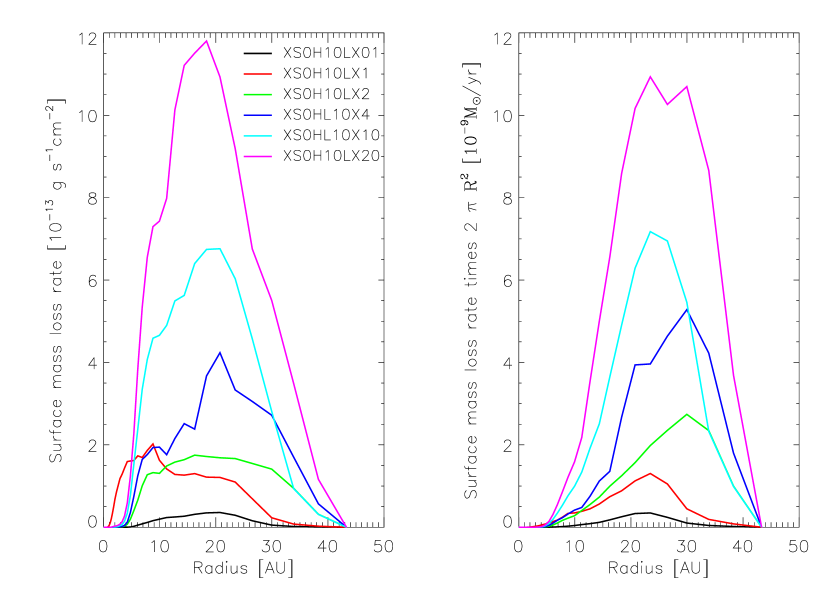
X-ray luminosity
Since X-ray luminosities of T Tauri stars range over two orders of magnitude or more, it is of interest to investigate the general trends of photoevaporative mass loss rates with varying model X-ray luminosity. For a discussion of the connection between photoevaporation, accretion rate and X-ray luminosities we refer to a companion paper by Drake et al. (2009).
To eliminate the effects of EUV radiation, which may complicate any trends due to X-rays, we irradiate the disk with the single temperature X-ray model already used in Paper I (Figure 1). Figure 6 shows the results for the radial distribution of and Ṁ for models with X-ray luminosities varying between and . The total mass loss rates are plotted as a function of X-ray luminosity in Figure 10, which shows a roughly linear correlation of these quantities. The increase in X-ray luminosity means that deeper layers (higher density) in the disk can be heated to temperatures in excess of the local escape temperatures, directly resulting in an increase in the mass loss rates. In addition the higher temperatures cause a vertical expansion of the heated surface material, hence increasing the solid angle directly irradiated by the source. However, the puffed up inner disk also obscures the disk at higher radii, hence inhibiting further increases in mass loss rate. This explains the slightly weaker than linear LX-Ṁ relation in Figure 10 for high LX.
Disk structure and Hydrostatic Equilibrium
The results of models that use the HSE procedure described in Section 2.1 are compared here with those obtained using a fixed density structure for the same parameters.
A casual inspection of Table 1 shows that hydrostatic equilibrium models produce smaller mass loss rates than the fixed density structure models with the same parameters. As in the case of the height of the illuminating source, the difference is due to the fact that, unlike fixed density structure models, heated material in the disk of HSE models puffs up and screens material at larger radii from the source, producing lower photoevaporation rates.
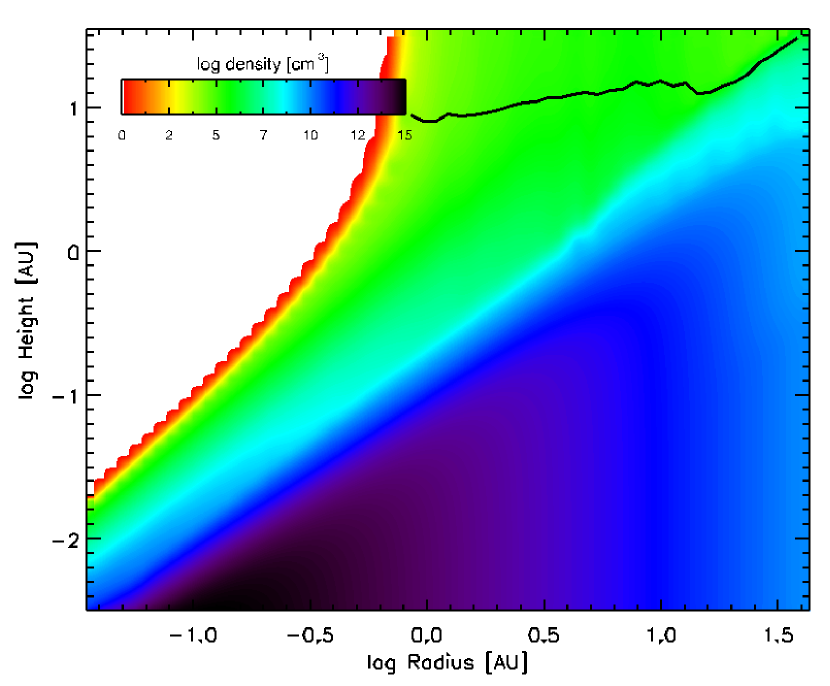
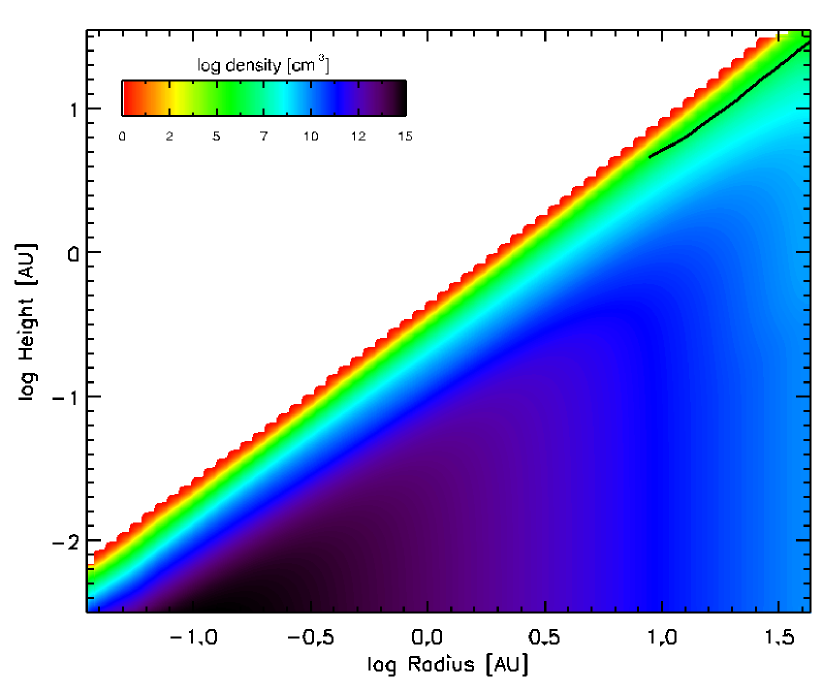
Figures 7 and 8 show the two-dimensional density distribution of the disk for unscreened X-ray+EUV models respectively in HSE and with a fixed density (FS0H2Lx1 and FS0H2Lx1_FG). The base of the photoevaporative envelope is marked by the thick black line. The physical height, density and temperatures of the flow surfaces are shown in Figure 9.
Figure 5 shows the radial distribution of and Ṁ for the fixed density structure models. A comparison with Figure 4, which shows the same quantities for the HSE models, promptly reveals that, unlike fixed density structure models, HSE models show photoevaporation from radii smaller than 10 AU. This is due to the fact that heated gas in HSE models is allowed to expand in the z-direction, moving away from the star to locations of lower gravitational potential where escape temperatures are lower, thus establishing a photoevaporative flow.
Furthermore gas at larger radii in fixed density structure models does not suffer from attenuation from puffed up inner material, resulting in substantial mass loss rates being supported in a larger portion of the disk. For ease of computation, our simulations only included the inner 50AU of the disk. As it is apparent from the left panel of Figure 5, this is not sufficient to estimate total mass loss rates from low pre-screening () fixed density structure models, and the values of Ṁ given in Table 1 should be regarded as lower limits.
4. Density and temperature structure
A detailed discussion of the thermochemical and density structures predicted by our models will be presented in future work, where predictions for gas emission line diagnostics will also be compiled for a larger disk model. Nonetheless, it is helpful to illustrate briefly here the effects of X-ray and EUV irradiation on the density and temperature distribution of gas in the disk, in particular for those regions where the photoevaporative flow is predicted to be significant.
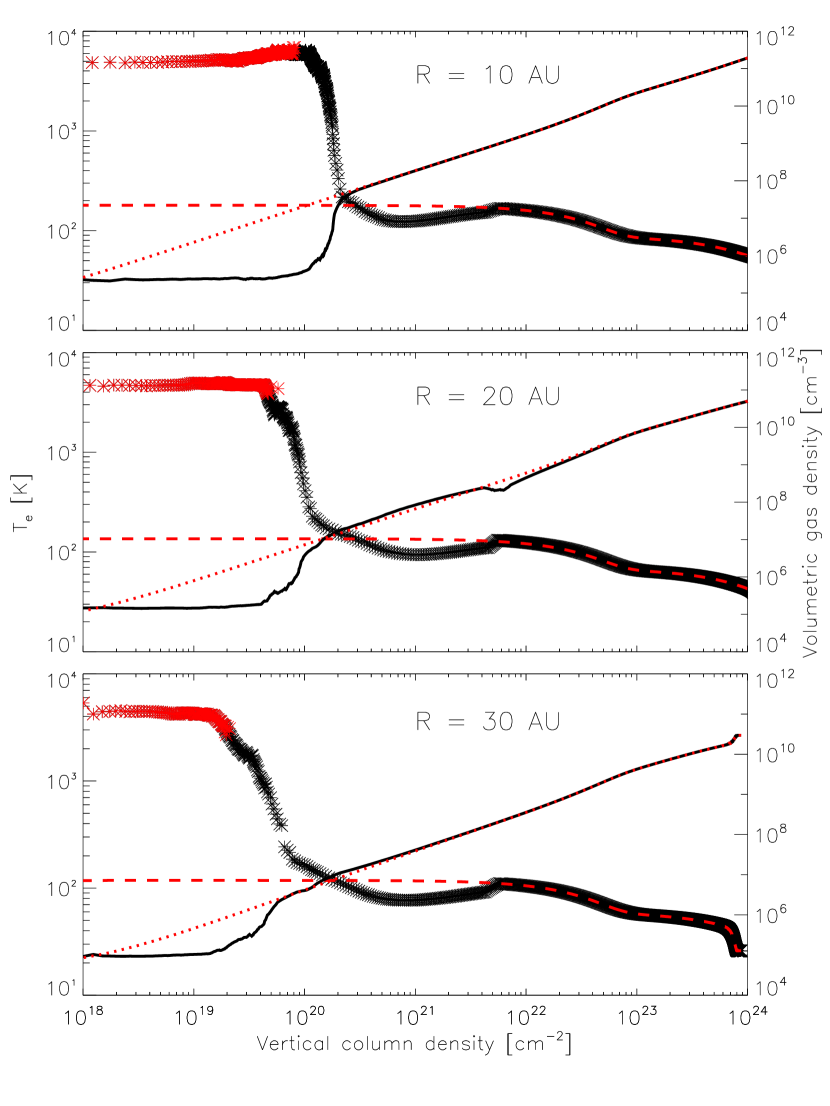
Figure 11 shows the density (black solid line) and temperature structure (black asterisks) of the gas as a function of vertical column density at radii and for the X-ray+EUV model with no pre-screening and (FS0H2Lx1). The red dashed and the red dotted lines show the dust temperatures and densities, respectively, calculated by d’Alessio et al. (1998).
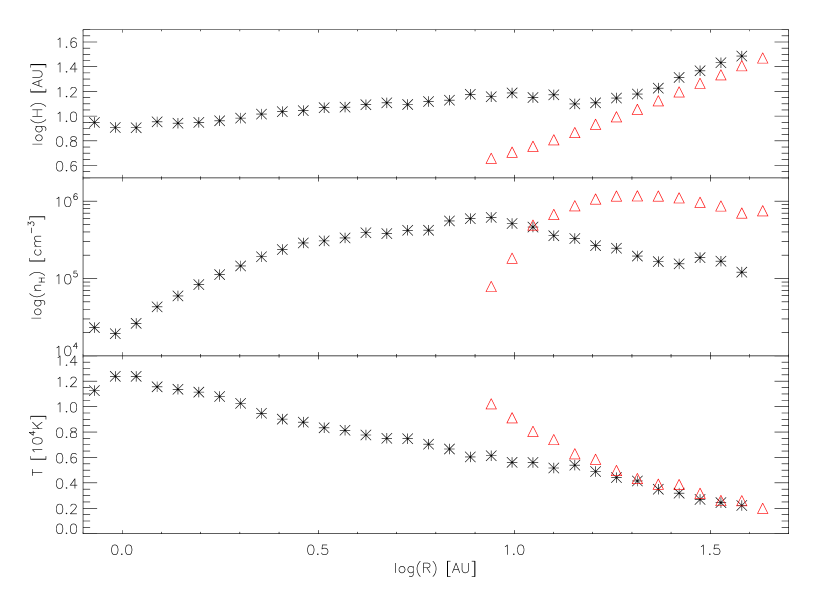
The red asterisks indicate temperatures that are above the local escape temperature, and therefore the base of the flow is located by the red point at the highest column density. Since a small error on the location of the flow could potentially translate into a large error on the density (and therefore photoevaporation rates) great care was taken to ensure that the Monte Carlo error is small in the region where the base of the flow is located.
The gas temperatures show a small step at columns of . This is not realistic and an artifact of our models which do not include a self-consistent treatment of molecular chemistry. We impose the edge of the “molecular zone” from the models of Glassgold et al. (2004), and assume that in the molecular zone fine structure lines of neutrals are no longer efficient at cooling the gas (since all gas is molecular). This causes the temperature to rise slightly as the gas and dust become thermally coupled. We stress that our temperature calculations in the deeper layers are not reliable and we postpone further discussion to future work when a chemical network will be introduced in the models.
In the X-ray/EUV heated region the gas temperatures increase steeply and the gas densities respond with an initial steep decline, however both gas temperatures and densities flatten out at low column densities. This temperature behaviour is expected for a photoionised gas whose thermal balance in this region is dominated by heating by photoionisation and cooling by collisionally excited line emission. The density behaviour is due to the fact that at high z’s, where gravity is weak, the exponential term in Equation 1 tends to unity and therefore the density at given height is then only proportional to the ratio of the gas temperature at the lower boundary point to the local gas temperature, i.e. the hydrostatic structure is roughly isobaric.

This flattening of the densities at large heights demonstrates somewhat a failure of the HSE assumption. In reality, material in the upper disk atmosphere will be part of a flow and not bound to the disk itself. This should not have a significant effect on the photoevaporation rates, given that the isobaric layers are not in the line of sight between the source and the flow surface.
5. Comparison with previous work
Previous studies of the thermochemical properties and photoevaporation of X-ray irradiated gas in protoplanetary disks include ACP04, Glassgold et al. (2004, 2007), Ercolano et al. (2008, Paper I) and Gorti & Hollenbach (2009, GH09).
ACP04 used cloudy (Ferland, 1996) (a one-dimensional photoionisation code) to construct a simple 1+1D model to investigate the importance of X-ray photoevaporation for the dispersal of gaseous protoplanetary disks around solar mass stars. Using the simple approximation they obtained a surface-normalized mass loss rate at a radial distance of 19.1 AU. Although their model was rather idealised and they used slightly different input parameters for the central star and illuminating spectral shape and luminosity, the values of they estimated is in the range of those obtained in this work (see Figure 4), and corresponds to a total mass loss rate of roughly 10. ACP04 compared their estimate of with that previously obtained for UV photoevaporation by Hollenbach et al. (1994), and found comparable values ( at 6.7 AU), which lead them to the conclusion that X-ray photoevaporation does not play an important role. However, at a much larger radial distance of 19 AU—approximately the region that Ercolano et al. (2008) found to dominate X-ray photoevaporation—ACP04 obtained similar values of . Due to the R2 dependence of the total mass loss rates, this translates to a photoevaporation rate nearly an order of magnitude higher than that at 6.7 AU. Therefore, while we agree with the numerical results of ACP04, we interpret the result differently and stress that our calculations (and those of ACP04) both suggest that X-ray photoevaporation does play a significant role in disk dispersal.
Glassgold et al. (2007) calculated the thermochemical structure of a disk around a 0.5 pre-main sequence star, irradiated by X-rays from a central source. The authors focused on the characterisation of the physical properties of the disk and the prediction of gas-phase diagnostics and do not give an estimate for X-ray photoevaporation from their models. However from the model grids which were kindly made available to us by these authors, we find at 20 AU. While this is higher than the estimates of this work and ACP04, it agrees very well with the values reported in Paper I. We note that Glassgold et al. (2007) and Paper I both used a fixed density structure for their calculations, and the higher photoevaporation rates are due to the fact that no obstruction by the puffed-up inner disk is accounted for in these models.
Contrary to this work and to the results mentioned above, recent work by Gorti & Hollenbach (2009, GH09) predicts much smaller photoevaporation rates due to direct X-ray heating and concludes that X-rays are only of indirect importance for the dispersal of protoplanetary disks around solar mass stars. Instead, their models predict that X-ray ionization generally acts to “amplify” FUV photoevaporation rates. While the authors state that their results are in agreement with those of ACP04, inspection of their Figure 5 (curve labeled ) shows that for their “X-ray only” model they estimate of the order of 10 at 20 AU, which is two orders of magnitude smaller than our and ACP04’s estimates. We also note that ACP04 obtained their estimate of at a radius of 19.1 AU, rather than 10 AU as stated in the GH09 paper.
Comparison of complicated theoretical calculations can be difficult and the reason for disagreement may be buried in the codes themselves or in the physical assumptions adopted. However we have identified at least one reason for the discrepancy between our calculations and those of GH09 which is the hardness of the illuminating X-ray spectrum.
Indeed, we find that the soft-X-ray region is the most efficient at heating the gas in the photoevaporation layer. GH09 use a rather hard spectrum, which peaks at 2keV and is approximated by a power-law with dLX/dE E for keV and dLx/dE E-2 for keV. This is a significantly harder spectrum than that used by ACP04 (which peaked at 0.7keV), ourselves in Paper I (see Figure 1) and by Glassgold et al. (2007, which peaked at 1keV). In this work we found that models irradiated by a hard spectrum such as that produced by high column screens (e.g. FS22 models) did not yield significant photoevaporation.
We have run a model using the GH09 spectrum and we obtained at 20 AU (using the approximation) and a total mass loss rate of 10. While a step in the right direction, the hardness of the illuminating spectrum alone does not seem to be sufficient to explain the discrepancy and other factors must also come into play.
6. Limitations of current models
6.1. The estimation of photoevaporation rates from the models
By far the biggest uncertainties concern our attempt to use these hydrostatic radiative equilibrium models to estimate the resulting mass loss rates. This now becomes a critical problem given that our preliminary estimates suggest that, contrary to previous claims (ACP04, GH09), X-ray photoevaporation may be the major agent of disc dispersal.
The uncertainties stem from the fact that we have derived the modified disc structure under the assumption of HSE, and although this probably gives a reasonable description of the density structure at small z, it is obviously the case that a static description does not produce a corresponding mass flow rate. Instead, we have employed the simple approach of deriving the hydrostatic structure and then, at the height where the disc material exceeds the local escape temperature, assume free sonic outflow from that point. A similar approach in the EUV case is less questionable for two reasons: i) the steep temperature discontinuity at the ionisation front and the near isothermal conditions above it means that the location of the launch surface is independent of detailed modeling and just depends on the regions of the disc where photoionised gas is unbound and ii) the density at the launch surface depends only on conditions above the ionisation front and not on the structure of the underlying disc. Thus the fact that the disc below the launch surface is not strictly static has no effect on the resulting outflow rates.
In the X-ray case, the temperature rises much more gradually with height: for example, for our model at 20 AU, the temperature rises from roughly to K over a region about 6.5 AU in height, over which the density of the hydrostatic structure falls by one order of magnitude. In reality, pressure gradients will cause the flow to be initiated below our nominal launch point, i.e. at a height where its temperature is less than the escape speed, and the density structure will be progressively modified over the region where the flow is accelerated. It therefore becomes little more than an exercise in educated guesswork to assign a point for estimating the escaping mass flux - the lower down in the structure one tries to do this, the more reliably the density structure will be known, but the less easy it is to assign a flow speed. At greater heights, it’s easier to assign a flow speed (unbound gas expands at about the sound speed), but the estimate of local density becomes unreliable, as the underlying density structure is now considerably modified by the flow.
It is tempting (see e.g. GH09) to propose a simple, physically motivated prescription that maps the structure of the photo-heated region onto an analytic flow solution at large radius (for example, the isothermal Parker wind solution). The problem with this is that although at large radii the flow will indeed approximate a quasi-spherical radial outflow, the transition between the nearly hydrostatic structure at the base and the Parker-like structure at large radius is quite different from a Parker wind - in particular, when the flow is non-radial, the interplay between terms in the momentum equation involving the divergence of the velocity, the gravitational acceleration and the centrifugal acceleration is quite different from the non-rotating Parker case. The problem boils down to the fact that, until one knows the topology of the streamlines, one cannot compute the variation of quantities along the streamlines - but that the steady state topology of the streamlines itself depends on the variation of quantities along the streamlines: in other words, it is a truly two dimensional problem. (See Begelman et al., 1983 for an attempt to parameterise the problem in terms of an ad hoc variation of the divergence of the velocity along streamlines). Our initial hydrodynamic investigations of this problem (Alexander & Clarke in prep.) demonstrate that the streamline topology and the mapping between base density and mass flux is very dependent on how the base density varies with radius in the disc. We therefore think that it is presently unwarranted to try and go beyond the simple estimates employed here and that further progress in estimating photoevaporation rates will require a combined hydrodynamics/radiative transfer approach.
A further shortcoming is that a molecular chemistry network is still not included in our calculations. This poses a limitation on the accuracy of our gas temperature calculations in the lower layers where cooling by H2 and CO rovibrational and rotational lines may become important. For example at a radial distance of 1 AU and column densities of 1021-1022 cm-2 Glassgold et al. (2004) find that CO rovibrational lines dominate disk cooling. CO rotational lines were also found to contribute somewhat to the cooling at greater depths, although in these regions the thermal balance is dominated by dust-gas collisions (GNI04). We are currently in the process of developing a chemical network to be included in future studies and will therefore be able to derive a more accurate thermal/hydrostatic structure at low temperatures (). It is questionable, however, how much such improvements will affect our estimates of photoevaporation rates, given that gas in this temperature range is strongly bound at radii less than 100 AU.
7. Summary
Our calculations of the structure of X-ray irradiated discs in low mass pre-main sequence stars imply total photoevaporation rates that, taken at face value, exceed the photoevaporation rates produced by extreme ultraviolet (EUV) radiation by an order of magnitude. This difference is attributable to the fact that a much more extended region of the disc is subject to X-ray photoevaporation than in the EUV case (i.e. significant evaporation out to AU, in contrast to the EUV case where little mass is lost beyond AU). The reason for this different photoevaporation profile is that the X-rays are able to penetrate columns of up to cm-2 through the disc’s puffed up, X-ray irradiated atmosphere and thus still produce significant mass flows when they impact the disc at several tens of AU. In the EUV case, by contrast, the regions of the disc from which the flow can be launched are shielded from direct irradiation by stellar photons and are instead subject only to recombination photons from the bound region of the disc’s ionised atmosphere. Since gas at K is only bound out to AU, most of the EUV induced mass loss is restricted to regions modestly greater than this (Hollenbach et al., 1994, Richling & Yorke, 2000; Font et al, 2004). Our conclusion that X-ray photoevaporation is more important than EUV photoevaporation is only strengthened when one considers two additional factors: i) the possibility of further attenuation of the EUV flux by absorption by any neutral flows (such as winds) close to the star and ii) the fact that we have unambiguous evidence that young stars remain strong X-ray sources even after disc dispersal and thus are clearly available as a potential disc dispersal mechanism.
However, we emphasise that our estimates of X-ray photoevaporation rates are much more uncertain than the EUV values, notwithstanding our careful treatment of two-dimensional radiative transfer and our derivation of the puffed up density structure of the irradiated disc (see discussion in Section 6). These uncertainties were of academic interest as long as it seemed likely that X-ray photoevaporation was in any case a minor agent for disc dispersal. We argue that future radiation hydrodynamical simulations are required in order to make firm predictions about the role of X-ray photoevaporation in disc dispersal.
Acknowledgments
We thank Uma Gorti and David Hollenbach for useful discussion. We thank Al Glassgold for providing the data grids for their model. We thank John Raymond for helpful discussions and a critical assessment of this work. We thank Paola D’Alessio for providing us with the electronic data for the gas density distribution in the disk. JJD was supported by the Chandra X-ray Center NASA contract NAS8-39073 during the course of this research. This work was performed using the Darwin Supercomputer of the University of Cambridge High Performance Computing Service (http://www.hpc.cam.ac.uk/), provided by Dell Inc. using Strategic Research Infrastructure Funding from the Higher Education Funding Council for England.
References
- Alexander et al. (2004) Alexander, R. D., Clarke, C. J., & Pringle, J. E. 2004, MNRAS, 354, 71, ACP04
- Alexander et al. (2005) Alexander, R. D., Clarke, C. J., & Pringle, J. E. 2005, MNRAS, 358, 283
- Alexander et al. (2006a) Alexander, R. D., Clarke, C. J., & Pringle, J. E. 2006, MNRAS, 369, 216
- Alexander et al. (2006b) Alexander, R. D., Clarke, C. J., & Pringle, J. E. 2006, MNRAS, 369, 229
- Alexander (2008) Alexander, R. D. 2008, MNRAS, 391, L64
- Asplund et al. (2005) Asplund, M., Grevesse, N., & Sauval, A. J. 2005, Cosmic Abundances as Records of Stellar Evolution and Nucleosynthesis, 336, 25
- Balbus & Hawley (1991) Balbus, S. A., & Hawley, J. F. 1991, ApJ, 376, 214
- Begelman et al. (1983) Begelman, M. C., McKee, C. F., & Shields, G. A. 1983, ApJ, 271, 70
- Bohren & Huffman (1983) Bohren, C. F., & Huffman, D. R. 1983, New York: Wiley, 1983,
- Clarke et al. (2001) Clarke, C. J., Gendrin, A., & Sotomayor, M. 2001, MNRAS, 328, 485
- D’Alessio et al. (1998) D’Alessio, P., Canto, J., Calvet, N., & Lizano, S. 1998, ApJ, 500, 411
- D’Alessio et al. (2001) D’Alessio, P., Calvet, N., & Hartmann, L. 2001, ApJ, 553, 321
- D’Alessio (2003) D’Alessio, P. 2003, Revista Mexicana de Astronomia y Astrofisica Conference Series, 18, 14
- Drake (2009) Drake, J.J., Ercolano, B., Flaccomio, E., Micela, G. 2009, ApJL, in press
- Ercolano et al. (2003) Ercolano, B., Barlow, M. J., Storey, P. J., & Liu, X.-W. 2003a, MNRAS, 340, 1136
- Ercolano et al. (2005) Ercolano, B., Barlow, M. J., & Storey, P. J. 2005, MNRAS, 362, 1038
- Ercolano & Storey (2006) Ercolano, B., & Storey, P. J. 2006, MNRAS, 372, 1875
- Ercolano et al. (2008) Ercolano, B., Young, P. R., Drake, J. J., & Raymond, J. C. 2008, ApJS, 175, 534
- Ercolano et al. (2008b) Ercolano, B., Drake, J. J., Raymond, J. C., & Clarke, C. C. 2008, ApJ, 688, 398, Paper I
- Ercolano et al. (2008c) Ercolano, B., Drake, J. J., & Clarke, C. J. 2008, arXiv:0811.3520
- Feigelson & Montmerle (1999) Feigelson, E. D., & Montmerle, T. 1999, ARA&A, 37, 363
- Ferland (1996) Ferland, G. J. 1996, University of Kentucky Internal Report, 565 pages,
- Flaccomio et al. (2005) Flaccomio, E., Micela, G., Sciortino, S., Feigelson, E. D., Herbst, W., Favata, F., Harnden, F. R., Jr., & Vrtilek, S. D. 2005, ApJS, 160, 450
- Font et al. (2004) Font, A. S., McCarthy, I. G., Johnstone, D., & Ballantyne, D. R. 2004, ApJ, 607, 890
- Getman et al. (2005) Getman, K. V., Feigelson, E. D., Grosso, N., McCaughrean, M. J., Micela, G., Broos, P., Garmire, G., & Townsley, L. 2005, ApJS, 160, 353
- Glassgold et al. (1997) Glassgold, A. E., Najita, J., & Igea, J. 1997, ApJ, 480, 344
- Glassgold et al. (2004) Glassgold, A. E., Najita, J., & Igea, J. 2004, ApJ, 615, 972, GNI04
- Glassgold et al. (2007) Glassgold, A. E., Najita, J. R., & Igea, J. 2007, ApJ, 656, 515
- Gorti & Hollenbach (2008) Gorti, U., & Hollenbach, D. 2008, ApJ, 683, 287
- Gorti & Hollenbach (2009) Gorti, U., & Hollenbach, D. 2009, ApJ, 690, 1539, GH09
- Gregory et al. (2006) Gregory, S. G., Jardine, M., Simpson, I., & Donati, J.-F. 2006, MNRAS, 371, 999
- Grevesse & Sauval (1998) Grevesse, N., & Sauval, A. J. 1998, Space Science Reviews, 85, 161
- Herczeg et al. (2007) Herczeg, G. J., Najita, J. R., Hillenbrand, L. A., & Pascucci, I. 2007, ApJ, 670, 509
- Hollenbach et al. (1994) Hollenbach, D., Johnstone, D., Lizano, S., & Shu, F. 1994, ApJ, 428, 654
- Hollenbach & McKee (1979) Hollenbach, D., & McKee, C. F. 1979, ApJS, 41, 555
- Igea & Glassgold (1999) Igea, J., & Glassgold, A. E. 1999, ApJ, 518, 848
- Johnstone et al. (1998) Johnstone, D., Hollenbach, D., & Bally, J. 1998, ApJ, 499, 758
- Kamp & Sammar (2004) Kamp, I., & Sammar, F. 2004, A&A, 427, 561
- Kashyap & Drake (2000) Kashyap, V., & Drake, J. J. 2000, Bulletin of the Astronomical Society of India, 28, 475
- Landi & Phillips (2006) Landi, E., & Phillips, K. J. H. 2006, ApJS, 166, 421
- Laor & Draine (1993) Laor, A., & Draine, B. T. 1993, ApJ, 402, 441
- Maggio et al. (2007) Maggio, A., Flaccomio, E., Favata, F., Micela, G., Sciortino, S., Feigelson, E. D., & Getman, K. V. 2007, ApJ, 660, 1462
- Mathis et al. (1977) Mathis, J. S., Rumpl, W., & Nordsieck, K. H. 1977, ApJ, 217, 425
- Matsuyama et al. (2009) Matsuyama, I., Johnstone, D., & Hollenbach, D. 2009, arXiv:0904.3363
- Mazzotta et al. (1998) Mazzotta, P., Mazzitelli, G., Colafrancesco, S., & Vittorio, N. 1998, A&AS, 133, 403
- Meijerink et al. (2007) Meijerink, R., Glassgold, A. E., & Najita, J. R. 2007, ArXiv e-prints, 712, arXiv:0712.0112, MGN08
- Najita et al. (2007) Najita, J. R., Carr, J. S., Glassgold, A. E., & Valenti, J. 2007, ArXiv e-prints, 704, arXiv:0704.1841
- Pascucci et al. (2007) Pascucci, I., et al. 2007, ApJ, 663, 383
- Pfalzner et al. (2006) Pfalzner, S., Olczak, C., & Eckart, A. 2006, A&A, 454, 811
- Preibisch et al. (2005) Preibisch, T., et al. 2005, ApJS, 160, 401
- Pringle (1981) Pringle, J. E. 1981, ARA&A, 19, 137
- Richling & Yorke (2000) Richling, S., & Yorke, H. W. 2000, ApJ, 539, 258
- Sanz-Forcada et al. (2002) Sanz-Forcada, J., Brickhouse, N. S., & Dupree, A. K. 2002, ApJ, 570, 799
- Savage & Sembach (1996) Savage, B. D., & Sembach, K. R. 1996, ApJ, 470, 893
- Scally & Clarke (2001) Scally, A., & Clarke, C. 2001, MNRAS, 325, 449
- Schmitt et al. (1990) Schmitt, J. H. M. M., Collura, A., Sciortino, S., Vaiana, G. S., Harnden, F. R., Jr., & Rosner, R. 1990, ApJ, 365, 704
- Shull & van Steenberg (1985) Shull, J. M., & van Steenberg, M. E. 1985, ApJ, 298, 268
- Strassmeier et al. (1993) Strassmeier, K. G., Hall, D. S., Fekel, F. C., & Scheck, M. 1993, A&AS, 100, 173
- Wilms et al. (2000) Wilms, J., Allen, A., & McCray, R. 2000, ApJ, 542, 914
- Xu & McCray (1991) Xu, Y., & McCray, R. 1991, ApJ, 375, 190