A near-infrared excess in the continuum of high-redshift galaxies: a tracer of star formation and circumstellar disks?
Abstract
A broad continuum excess in the near-infrared, peaking in the rest-frame at 2-5 µm, is detected in a spectroscopic sample of 88 galaxies at taken from the Gemini Deep Deep Survey. Line emission from polycyclic aromatic hydrocarbons (PAHs) at 3.3 µm alone cannot explain the excess, which can be fit by a spectral component consisting of a template of PAH emission lines superposed on a modified blackbody of temperature K. The luminosity of this near-infrared excess emission at 3 µm is found to be correlated with the star formation rate of the galaxy. The origin of the near-infrared excess is explored by examining similar excesses observed locally in massive star forming regions, reflection and planetary nebulae, post-asymptotic giant branch stars and in the galactic cirrus. We also consider the potential contribution from dust heated around low-luminosity active galactic nuclei. We conclude that the most likely explanation for the 2-5 excess is the contribution from circumstellar disks around massive young stellar objects seen in the integrated light of high-redshift galaxies. Assuming circumstellar disks extend down to lower masses, as they do in our own Galaxy, the excess emission presents us with an exciting opportunity to measure the formation rate of planetary systems at cosmic epochs before our own Solar System formed.
Subject headings:
infrared: galaxies – galaxies: evolution – galaxies: stellar content – infrared:stars – stars: circumstellar matter - planetary systems: protoplanetary disks1. Introduction
The spectral energy distributions (SEDs) of most normal star-forming galaxies can be well-described by a model which is simply the superposition of a component due to starlight and a component due to re-radiated dust emission. The physical details of the stellar component are well understood on the basis of many decades of observations made at visible wavelengths, but it is only recently that near (NIR) and mid-infrared (MIR) space-based observatories have revealed the richer spectral information contained in the dust component. This component is dominated by broadband thermal emission from dust grains, but emission associated with polycyclic aromatic hydrocarbons (PAHs) has also been found to be important in the NIR and MIR (Desert et al. 1990). Sensitive spectroscopic and broadband observations from the Spitzer Space Telescope (Werner et al. 2004) and Infrared Space Observatory (Kessler et al. 1996) of both the PAH emission and the warm thermal component, combined with laboratory measurements of the physical properties of interstellar dust provide a general understanding of dust in the context of galactic properties (see for example Draine & Li 2007) and can provide unique clues to our understanding of prominent dust processes such as metal enrichment and embedded star formation.
In large surveys of high-z galaxies, broadband photometry is commonly fit to SEDs produced by stellar population synthesis models to determine photometric redshifts, stellar masses, star formation rates (SFRs) and other global quantities of galaxies. Although, the high number of parameters involved in these models leads to large degeneracies in the fitted parameters, stellar masses can be measured robustly if rest-frame -band light is known. However, at longer wavelengths the contribution from PAHs and emission from other non-stellar sources of luminosity are not included in the models. For this reason, band fluxes beyond rest-frame 2 µm are often excluded from stellar population synthesis SED fitting routines (see for example Papovich et al. 2006; Pérez-González et al. 2008; Magnelli et al. 2008). A more ideal approach is to include non-stellar sources of emission in the SED models to help break the degeneracies that plague stellar population synthesis models, such as those associated with age, metallicity, dust attenuation.
A new result that has emerged recently is the discovery of an excess in the NIR continuum of galaxies at 2-5 µm, (Lu et al. 2003; Helou et al. 2004; Magnelli et al. 2008). This excess cannot be attributed solely to narrow emission from the 3.3 µm PAH feature and is instead due to a combination of line emission and an additional thermal component. The emission can be significant at wavelengths around 3µm, but it is not a major contributor to a galaxy’s total bolometric flux. For example, in a survey of 45 star-forming galaxies Lu et al. (2003) measure a weak excess component of continuum emission in the range of 2-5 µm that is characterized by a very high color temperature ( K), but is only a few percent of the far-infrared (FIR; 8-1000 µm) luminosity attributed to larger dust grains. The origin and physical mechanism of the NIR excess in galaxies is not known, although Lu et al. (2003) suggest it likely originates in the ISM.
An NIR excess continuum has also been seen locally in a range of objects. Reflection nebulae (RNae) around massive O and B-type stars have a smooth continuum feature from 1.25 to 4.8 µm that is characterized by a blackbody with a K temperature in addition to a narrow emission feature at 3.3 µm (Sellgren et al. 1983, 1996), attributed to the thermal emission of very small ( Å) grains (Sellgren 1984). photometry of massive stars in the Myr old star forming regions NGC 3576 (Maercker et al. 2006), G305.2+0.2 (Longmore et al. 2007), and 30 Dor in the LMC (Maercker & Burton 2005) show L-band (3.5 µm) excesses in more than half of their stars with masses 10 that is attributed to circumstellar disks (Lada & Adams 1992). Excess continuum emission can also come from more diffuse sources. Observations by Spitzer’s Infrared Array Camera (IRAC; Fazio et al. 2004) and the Cosmic Background Explorer/Diffuse Infrared Background Explorer COBE/DIRBE of the galactic cirrus (Flagey et al. 2006) reveal a continuum component in the NIR whose contribution to the IRAC [3.6 µm]-band is %, while the PAH feature at 3.3 µm contributes the remaining flux.
The ultimate cause of K blackbody emission in the empirical data described above is still unknown. Large dust grains are fragile at such high temperatures, and are unlikely to be the source of the excess emission. In the canonical interstellar dust model of Desert et al. (1990), PAH molecules, unlike dust grains, can exhibit both line emission at 3.3 µm and broad continuum emission at 2-5 µm, and lead to significant NIR emission. Large PAH molecules (1 nm) display strong broadband NIR emission and are more resilient to strong ionizing fields, while smaller PAH molecules display a larger line-to-continuum emission ratio in the NIR. This would naturally lead to broad NIR continuum emission of molecules in the vicinity of massive stars, likely contained in circumstellar disks, a mechanism for the NIR excess in galaxies not previously explored. Theoretically for local young stellar objects (YSOs), Dullemond et al. (2001) show that the puffed up inner edges of circumstellar disks can radiate at high temperatures and lead to L-band excess luminosities in the NIR of more than in the most massive stars. In agreement with the circumstellar disk interpretation of the excess, observations presented in Arendt et al. (1994) with the COBE/DIRBE show that NIR continuum emission of nearby star-forming regions correlate well with bright mid-IR observations and that the dust must lie very close to the stars, as it was unresolved by the DIRBE beam. More recently, resolved excess NIR continuum emission is observed in young stars that possess circumstellar disks (see Figure 3 in Wood et al. 2008).
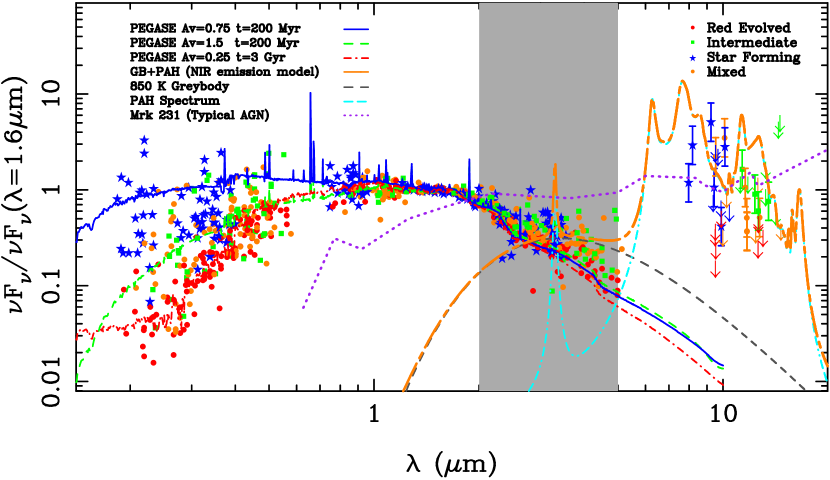
Whatever the cause of the emission, we will show in this paper that it is apparently fairly easy to detect such excess emission at high redshifts, at least in an optically selected sample like the Gemini Deep Deep Survey (GDDS; Abraham et al. 2004). At first glance this seems rather surprising, since (as we have already noted) the excess emission corresponds to only a tiny fraction of a typical galaxy’s bolometric flux. However, as demonstrated in Figure 1, the peak wavelength of a blackbody radiator emitting at K (gray dashed curve) falls near the global minimum in a typical galaxy’s SED when modeled as a two-component system of starlight + IR emission. Therefore the contrast of even a small amount of K emission seen at 2-5 µm can be significant, giving us an opportunity to probe a new component of a galaxy’s flux that is ordinarily overwhelmed by either starlight or re-radiated emission from large dust grains. This new component is interesting on its own and also may be useful for calibration of the SFR. Studies of the NIR component in ultra-luminous infrared galaxies (ULIRGS; Mouri et al. 1990; Imanishi et al. 2006; Magnelli et al. 2008) suggest that the 3.3 µm emission can be used as a good indicator of the SFR in some galaxies, although further calibration and study of star-forming galaxies is needed to justify this as a useful diagnostic.
In this paper, we quantify the NIR excess continuum in a spectroscopic sample of high redshift galaxies, described in Section 2 by performing linear least-squares fits of broadband optical+IRAC photometry to SED models. We compare two sets of SED models, the first consisting of a stellar component SED only and the second, a two component SED model consisting of both a stellar component and an additional NIR dust emission component consisting of an 850 K graybody plus PAH emission template (da Cunha et al. 2008) as described in Section 3. The case for an NIR excess continuum in GDDS galaxies is made through IRAC color-color diagrams and SED example fits in Section 4. We show that the luminosity of the NIR emission component is correlated with a galaxy’s star-formation rate in Section 4.6. In Section 5 we speculate on the origin and potential significance of the excess, and show that the most likely candidate is a population of heated circumstellar disks in the high redshift galaxies.
Throughout this paper, we adopt a concordance cosmology with =70 km s-1 Mpc-1, , and . All photometric magnitudes are given in AB magnitudes, unless otherwise noted.
2. Observations
2.1. Summary of GDDS Observations
The Gemini Deep Deep Survey (hereafter GDDS; Abraham et al. 2004) is a spectroscopically defined color selected subset of the 1 deg Las Campanas Infrared Survey (LCIRS; McCarthy et al. 2001). It consists of four 5′.5 5′.5 fields chosen from the parent sample to minimize cosmic variance. The sample consists of galaxies with mag and mag ( mag and mag) in the redshift interval . The GDDS multi-band coverage includes broadband colors in addition to high-resolution Advanced Camera for Surveys (ACS) coverage of % of the fields. For this analysis, we only select objects with high-confidence spectroscopic redshifts and those which are confidently detected in the longest IRAC channel (we required mag). This results in 103 galaxies from the 309 objects in the original GDDS sample.
All objects were given a spectral type classification as outlined in Table 5 of Abraham et al. (2004). The classification is based on three digits that refer to young, intermediate-age, and old stellar populations. Objects showing nearly pure signatures of an evolved stellar population were assigned a GDDS class of “001” in Abraham et al. (2004). In Figure 1 and many figures in this paper, we key each galaxy to their galactic spectral type. The evolved “001” galaxies are plotted as red circles. Objects showing a strong-UV continuum dominated by massive stars were classified as “100” and are plotted as blue stars. Objects with intermediate ages (e.g., strong Balmer absorption) were classified as “010” and are plotted as green squares. Some objects consist of both an evolved population plus a younger more recent star formation component. These objects are listed as mixed populations with spectral types of “110” or “101” in and are plotted as orange dots in our figures.
2.2. Spitzer IRAC Photometry
Near-infrared observations are important for determining stellar masses through SED fitting, particularly at high redshift where the light from evolved stellar populations, which trace the stellar mass of a galaxy, is redshifted out of the optical. In order to determine stellar masses of GDDS galaxies, a total of 10.9 hours of Spitzer IRAC observations were obtained for three of the four GDDS fields (Program ID: 3554; McCarthy et al. 2004) yielding 5 depths of 0.45, 0.9, 6 and 8 Jy in respective IRAC bands. The final field, GDDS-SA22, was observed through an existing GTO-reserved program (Program ID: 30328; Fazio et al. 2006). Mosaics were created from the archived Basic Calibration Data (BCD) images using MOPEX (Final Version 18.2), a more current and improved post-BCD mosaicing tool of the Spitzer Science Center to achieve better background removal and a spatial resolution of 0.6″/pixel. The first three short-exposure BCD images were thrown away to correct for the IRAC “first-frame effect”. The background was corrected, for each remaining BCD image, by subtracting the peak of a count histogram of the entire image. The resulting [5.8 µm] and [8.0 µm] images displayed noticeable gradients and in addition had to be gradient-corrected. This gradient correction was not performed in the deeper GDDS-SA22 field. The resulting BCD images were background corrected to an AB magnitude zeropoint of 21.85 and drizzle-combined to create the final post-BCD mosaics.
Objects in the post-BCD IRAC mosaics were detected by running SExtractor in dual-image mode, where a weighted-sum of [3.6 µm] and [4.5 µm] images were used as the detection image. A Mexhat filter was used instead of a Gaussian filter to better de-blend and detect objects in these relatively low resolution, but deep, images. Magnitudes were then measured in each IRAC band in 4″ diameter apertures. To extrapolate the total flux of the galaxy, aperture corrections of 0.317, 0.360, 0.545 and 0.677 mags were added to the [3.6 µm], [4.5 µm], [5.8 µm], [8.0 µm] magnitudes, respectively.
Source blending from objects on the edge of our 4″ apertures could potentially add a flux excess. We went through our sample of 103 galaxies by eye (inspecting both our ground-based -band and HST ACS [814W] images) and flagged any object that has a neighbor within a 7″ aperture. We found 15 such objects in total and will show in Section 4 that these objects are relatively poorly fit by our SED models as a result of the photometric confusion, so we opt to exclude them from most analyses. Thus our final sample is comprised of 88 spectroscopically confirmed galaxies. This sample covers the full GDDS redshift range of , with objects ranging from to (32 objects from , 41 objects from , and 14 objects from ).
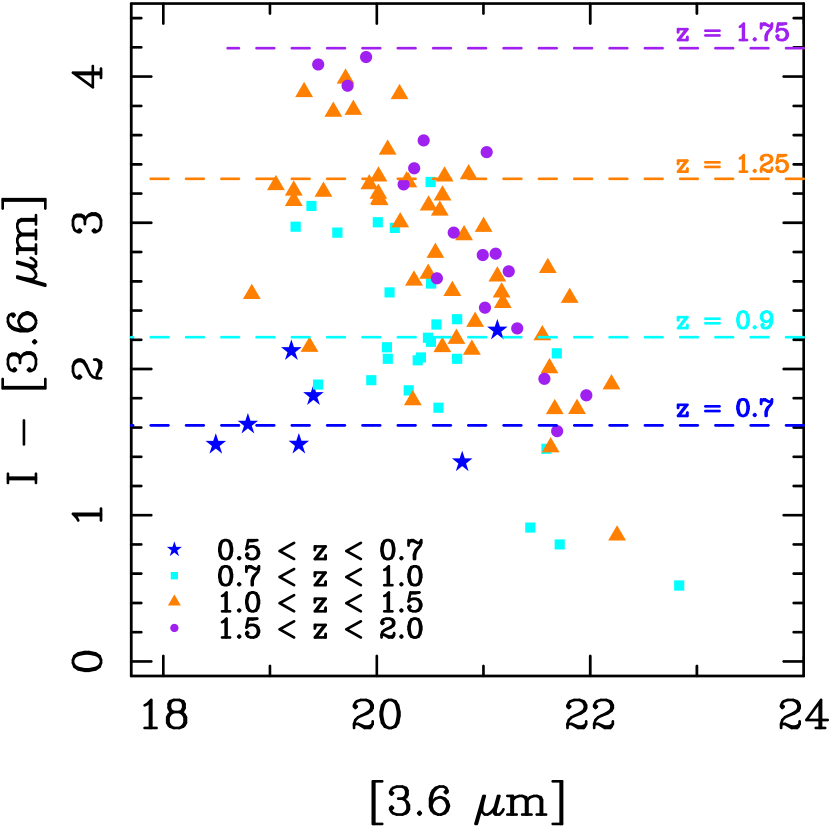
The - [3.6 µm] color-magnitude diagram presented in Figure 2 shows that -[3.6 µm] color is a strong function of redshift for our mass-selected sample of galaxies. This dependence is most pronounced for the brighter galaxies, suggesting that for these galaxies the red sequence is set in place by . We plot for reference the color of an evolved galaxy (age=3 Gyr, Myr, Av=0.25, Z=Z⊙) at each redshift interval. The brightest galaxies are well matched by this evolved population model, while the fainter galaxies are bluer, indicative of younger ages.
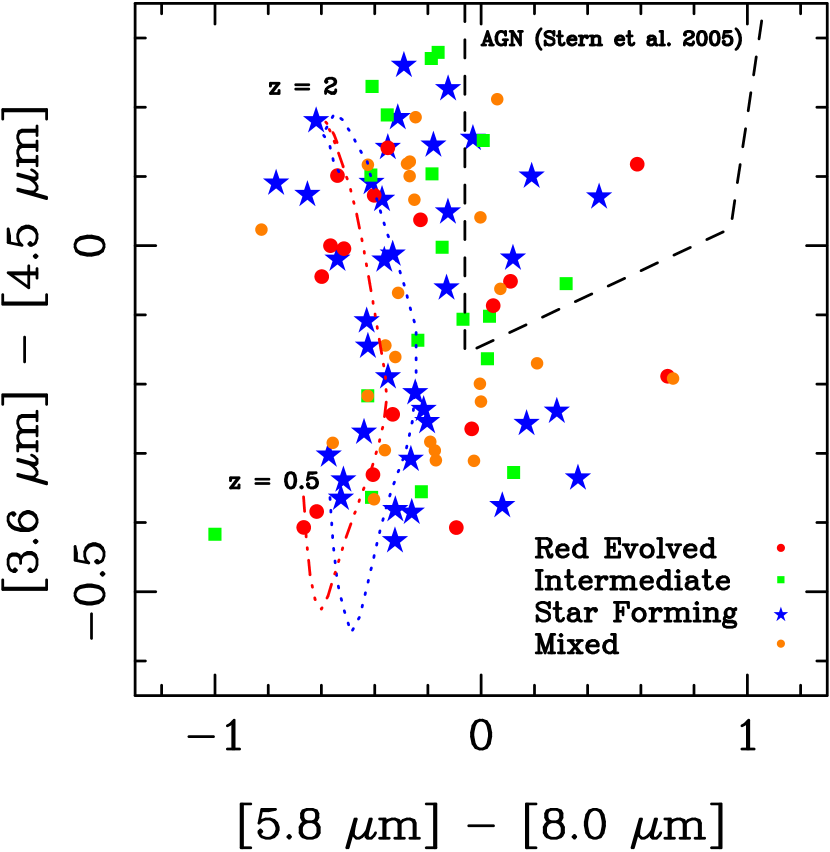
In Figure 3 an IRAC color-color plot for the sample is presented. For reference we plot the evolution of a star-forming and evolved galaxy computed with PEGASE.2 code. The GDDS sample generally traces these tracks, although many galaxies show redder [5.8 µm]-[8.0 µm] colors, possibly indicating an NIR excess at rest-frame 3 µm. We plot the IRAC color-color selection criteria to pick out an active galactic nucleus (AGN) from Stern et al. (2005) as the region contained in the dashed region in Figure 3. Only 11% of the objects from the selected GDDS sample fall in this region and most of those are near the selection boundary, showing little contamination from strong AGNs in our sample. Objects are plotted with plot symbols keyed to their galaxy spectral types using the scheme described in Section 2.1. There is no obvious relationship between a galaxy’s location in the color-color space and its spectral type.
2.3. Spitzer 24 µm MIPS Photometry
For one of our fields, GDDS-SA22, a 1320 s exposure was observed with Spitzer’s Multiband Imaging Photometer for Spitzer (MIPS; Rieke et al. 2004) under a GTO reserved program (Program ID: 30328; Fazio et al. 2006). Our 24 µm MIPS imaging was reduced using a combination of the Spitzer Science Center’s MOPEX post-processing suite and a set of custom routines developed to better remove background and artifacts. The source finding and photometry/extraction pipeline (D.V. O’Donnell et al. 2010, in preparation) employed PPP (Yee 1991), DAOPHOT (Stetson 1987) and additional routines for calibration. A Monte Carlo technique in which the theoretical MIPS point-spread function (PSF) was scaled, inserted into the science images and retrieved by the photometry pipeline was used to determine an aperture correction for all sources on the order of % of the source’s measured band flux.
Because a number of our objects had poor MIPS correlations, we inspected each source by eye to confirm whether they were in fact counterparts. Source confusion is a problem in some of our objects which we later flag in our analysis (Section 4.1). To any objects non-detected we assigned an upper limit of 70 Jy, our 1 detection limit computed from Monte Carlo completeness tests.
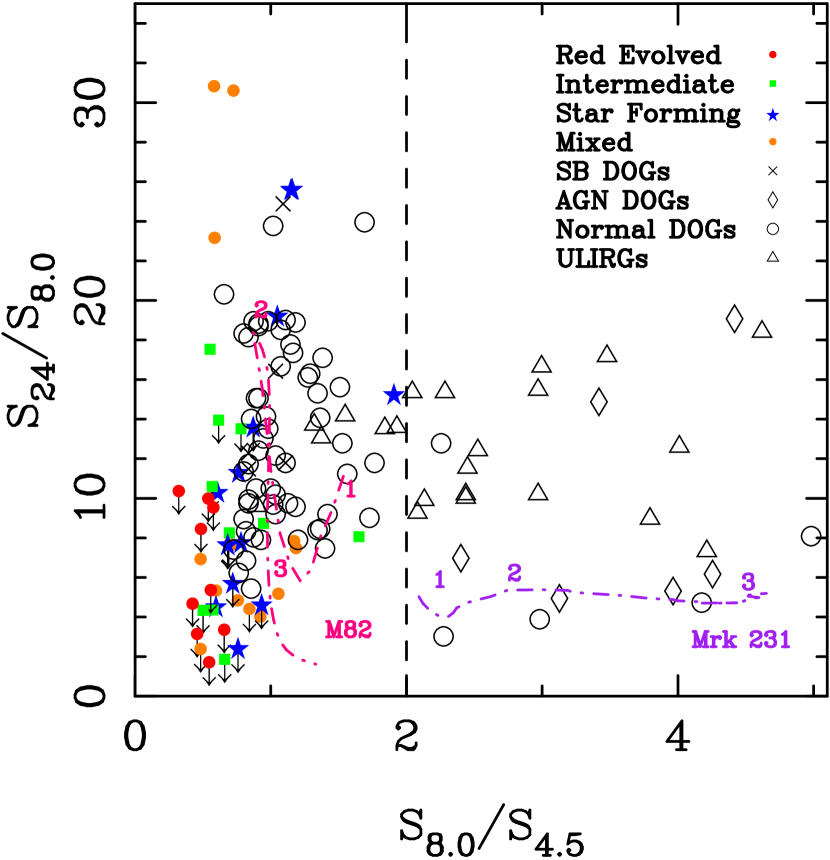
MIPS fluxes are available for 40/88 galaxies in our selected sample. The IRAC-MIPS 24 m color-color plot, presented in Figure 4, shows the majority of objects in the GDDS-SA22 field lie in the region of starburst galaxies, left of the dashed line, as defined by Pope et al. (2008b), with a general trend of the star-forming and mixed population galaxies showing stronger S24/S8 ratios than the evolved galaxies. Non-detections (25/40) are plotted as upper limits. None of our objects have S8.0/S, an indication of a significant AGN component (Ivison et al. 2004; Pope et al. 2008b). We are thus confident that our optically and mass-selected sample does not have a large contamination of strong AGN. Due to selection biases between our sample and other high-z AGN samples, we cannot completely rule out contamination due to lower luminosity AGN (see later discussion in Section 5.1.1).
For comparison with other high-z galaxy samples, we also show in Figure 4 the locations in the IRAC-MIPS color-color plane of a sample of 24 µm-selected ULIRGS at (Sajina et al. 2007) and a sample of faint 24 µm-selected dust obscured galaxies (DOGs; Pope et al. 2008a). Pope et al. (2008b) use X-ray, far-IR, sub-mm and radio observations to determine whether the DOGs have strong AGN or starburst components which we plot as separate symbols in Figure 4. No GDDS galaxy shows similar IRAC-MIPS colors as the class of AGN-dominated galaxies. For reference, evolutionary tracks for a typical AGN (Mrk 231) and starburst (M82) (taken from Pope et al. 2008a) are shown. It is evident that the GDDS mass-selected sample probes the less active parameter space of high-z galaxies (i.e., lower SFRs, smaller contributions from the AGN).
3. Spectral Energy Distribution Fitting
We aim to understand the NIR excess by incorporating emission from dust as an additional component in each galaxy’s SED. Each galaxy’s stellar component is modeled using the techniques of population synthesis. In contrast to the well-worn techniques of stellar population synthesis, our modeling of dust is rather simplistic. However, we will show that even relatively crude dust models can provide interesting constraints. As astronomical facilities which explore faint galaxy populations continue to probe further into the IR (e.g., JWST, ALMA) it will become increasingly important to embrace dust as an essential component when modeling galaxy SEDs. Our analysis might therefore be viewed as an early attempt to move in this general direction.
3.1. Stellar component
To model the stellar SED component, a library of SEDs is generated consisting of a range of two component star formation histories (SFHs). We generate two sets of SED libraries, one from PEGASE.2 software (Fioc & Rocca-Volmerange 1997) and one from Maraston (2005) (hereafter M05), whose treatment of thermally pulsing asymptotic giant branch (TP-AGB) stars is scaled to match photometry of globular clusters in the NIR. Both sets consist of a primary SFH component consisting of a monotonically evolving stellar population with a SFR , Gyr for PEGASE.2 models and Gyr for M05 models. The first approximates an instantaneous starburst and the last a constant SFR. A secondary SFH component models a starburst event, with a Gyr exponential. In the PEGASE.2 models, this secondary component can occur at any time between and , while in the M05 models it is fixed to 50 Myr before since the SFH is not a user input parameter in the M05 models, as it is in the PEGASE.2 models. We note here that fixing this parameter does not affect the relevant parameters (, ) derived from the SED fits. The strength of the second burst component can have a mass between and 2 times the initial component. The two component stellar model allows for a more robust determination of stellar masses by correctly modeling the light from evolved populations and that from a recent star forming episode. We opt to use the initial mass function (IMF) from Kroupa (2001).
Extinction is added to the spectra ourselves in eleven reddening bins covering mag. We assume that nebular extinction is twice the stellar continuum and use the Small Magellanic Cloud (SMC) reddening law of Pei (1992) which provides a numerical fit to the extinction in the SMC. For the PEGASE.2 models, evolution of the stellar population assumes constant metallicity, and does not include effects due to galactic winds, infall or substellar objects. The PEGASE.2 models vary in five possible metallicity values from , while the M05 models are fixed to solar metallicity.
We refer the reader to Figure 1 for examples of the SED model components plotted with the normalized (at ) rest-frame fluxes of our data set. The observed NIR excess region is highlighted in gray. Two examples of a young (t=200 Myr), star-forming galaxy are shown with different extinction values as the blue solid () and green dashed () curves. An evolved stellar population (t=3 Gyr; ) is plotted as the red dot-dashed curve. These illustrative SEDs, computed with PEGASE.2, are for a galaxy with an exponentially declining SFR of =500 Myr and .
3.2. Additional dust component
Broadband multi-wavelength (UV, optical, and IR) empirical SED modeling performed by da Cunha et al. (2008) of galaxies from the Spitzer Infrared Nearby Galaxies Survey (SINGS; Kennicutt et al. 2003; Dale et al. 2005) show that emission in the NIR, from 2-5 µm, can be modeled by an additional SED component described by a PAH template spectrum superposed on an 850 K graybody modified by extinction (hereafter written as GB+PAH to identify this as a single parameter SED component). The PAH template is scaled to match the NIR continuum excess (e.g., the graybody) seen in star-forming galaxies in Lu et al. (2003) & Dale et al. (2005) and is shown to also match the relative, but not absolute, intensities of the galactic cirrus (see Figure 1 of da Cunha et al. 2008). For reference we plot the GB+PAH component as the orange dash-long-dashed line in Figure 1. As well, we show the separate components that comprise this model: an 850 K graybody (dark gray dashed line), and a PAH template spectrum (cyan dot-dashed line).
3.3. Methods
First we fit optical [3.6 µm] [4.5 µm] photometry to the stellar component models (both PEGASE.2 and M05). 111To justify that the longer IRAC bands are inadequately modeled by stellar component only models, we also fit all the [3.6 µm] [4.5 µm] [5.8 µm] [8.0 µm] photometry. This also allows us to compare the quality of fits (see s:qof) between the single stellar component model and the two component stellar plus NIR emission model. We then fit all optical + IRAC [3.6 µm] [4.5 µm] [5.8 µm] [8.0 µm] photometry to the second model set consisting of the same library of stellar component SEDs with the additional GB+PAH component just described in Section 3.2 fit as a sum of linear least-squares. The normalization of this component is thus an additional free parameter.
A grid of apparent AB magnitudes is generated by redshifting each rest-frame model to the galaxy’s spectroscopic redshift and convolving this spectrum with the transmission curves for all observed filters: and Spitzer IRAC [3.6 µm], [4.5 µm], [5.8 µm], [8.0 µm]. The for each model is calculated in flux space with the normalization of each component as a fitted parameter. We restrict the age of the model to be less than the age of the Universe at the observed redshift. To estimate errors in the fitted parameters, we consider 20 Monte-Carlo realizations of the data through a random Poisson distribution of the count rate, thus simulating the detector shot noise.
4. Results
4.1. SED fitting: the stellar component model
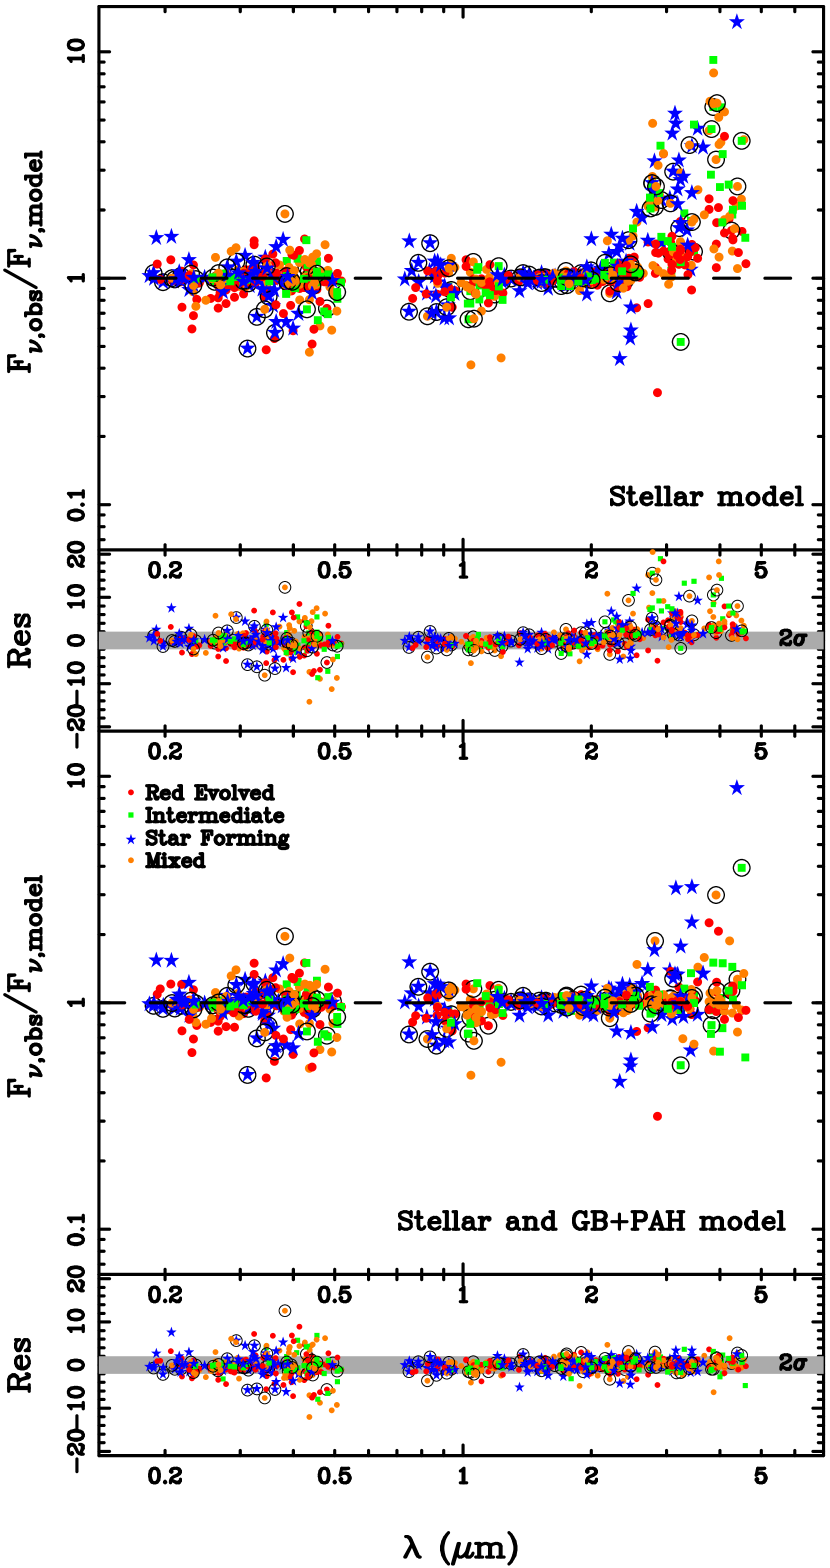
Figure 5 shows the observed-to-model flux ratios and residuals of the broadband optical+IRAC photometry fit to the two sets of models as described in Section 3; one consisting of a stellar component only and the other consisting of two components, a stellar and an 850 K GB+PAH SED component. Here, stellar models from M05 are shown, but the results are consistent with residuals from fits to the PEGASE.2 models. The wavelength has been blue-shifted to the rest-frame wavelength for comparison. The top panel shows the fit of the stellar component to the optical +IRAC [3.6 µm] [4.5 µm] photometry. Spitzer IRAC [5.8 µm] and [8.0 µm] band fluxes are also compared to the model band fluxes, although they were not used to find the best-fit SEDs. We separate the data points into their optical spectral types as described in Section 2.1. For the -[4.5 µm] bands, the residuals are on average with a scatter of , while the residuals for the [5.8 µm] and [8.0 µm] bands have a significant offset of and a scatter of . Thus the stellar component models do a good job estimating the light blueward of 2µm where the flux is driven by the evolved population, and as a consequence galaxy stellar mass. However, redward of 2 µm, there is a significant excess in the majority of GDDS galaxies seen in the rest-frame range of 2-5 µm.
We flag points in this figure (using thin circles) to identify galaxies that are possibly contaminated by light from nearby galaxies due to blending of the IRAC PSF (see Section 2.2). On the whole, these systems are poorly fit by the models, and will drop them from subsequent figures and analyses, although including them changes none of our conclusions.
A single or two-component SFH stellar population model alone is not sufficient to describe the flux generated in the NIR beyond rest-frame 2 µm. The amount of NIR excess is dependent on the galaxy spectral type as we see strong excesses of in the star-forming galaxies (blue stars), and in the mixed and intermediate populations (green squares and orange dots) and a smaller, but still noticeable excess of in galaxies dominated by an evolved stellar population (red circles). The NIR excess covers a broad spectral range indicating that a single narrow emission line such as the 3.3 µm PAH emission line is not sufficient to explain all of the excess.
4.2. SED fitting: additional dust component
The second set of models consists of two components: one, a stellar SED component and the other, an NIR emission component consisting of 850 K graybody emission plus a PAH spectrum (GB+PAH) that is scaled with the 850 K graybody to match NIR observations of star-forming galaxies and the galactic cirrus (da Cunha et al. 2008). The resulting ratio and residuals between observed and model band fluxes are plotted in the bottom panel of Figure 5 with wavelength blue-shifted to the rest-frame. The additional component matches the IRAC photometry, particularly the [5.8 µm] and [8.0 µm] bands, remarkably well. For the -[4.5 µm] bands, the residuals are similar to the fits with just a stellar component model with a negligible offset of and a scatter of , while the residuals for the [5.8 µm] and [8.0 µm] bands no longer have a significant offset with an average value of and a much smaller scatter of .
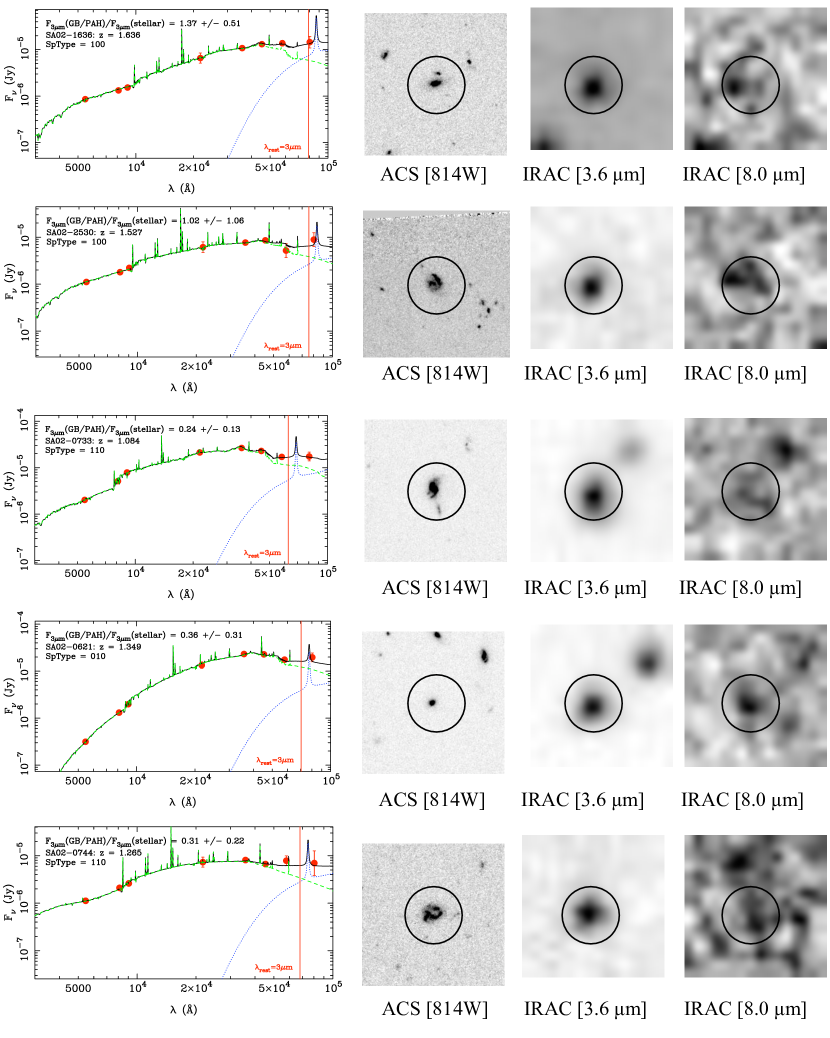
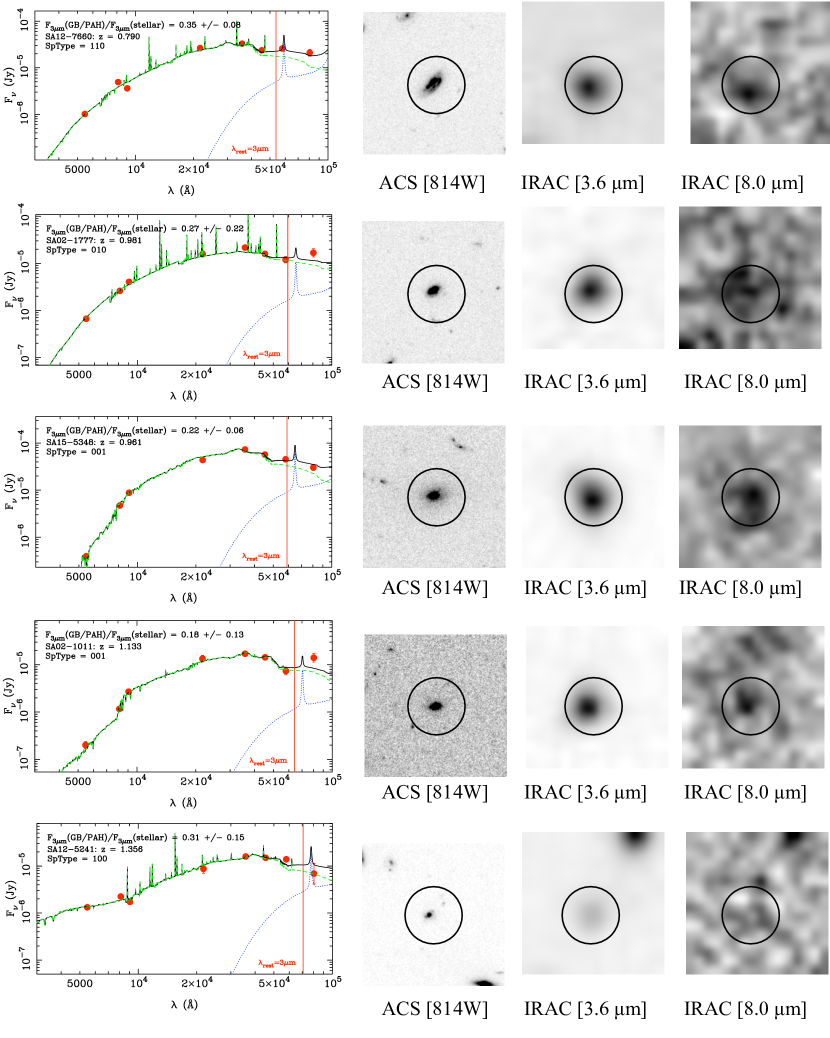
Examples of fitting the two component SED to the optical+IRAC photometry are presented in Figures 6 and 7. The black solid line represents the sum of the stellar (dashed green line) and the additional GB+PAH component (blue dotted line). We plot 10 ″ postage stamps from HST ACS images of the galaxy to show morphology of each galaxy. There is no strong correlation between the amount of NIR excess and galaxy morphology, both qualitatively or quantitatively according to the asymmetry or Gini coefficient morphological quantities as measured for the GDDS sample in Abraham et al. (2007). We also plot images from IRAC [3.6 µm] and [8.0 µm], and show the 4″ apertures used for our photometry.
4.3. Quality of fits
Comparing the top and bottom panels of Figure 5, we see that the addition of a GB+PAH component greatly improves the fits qualitatively. The SED fitting routine minimizes but we emphasize that the interpretation of the absolute value of the minimum returned requires some careful consideration, since the number of fitted parameters exceeds the number of data points. This is a very common occurrence in broadband photometry SED fitting (e.g., Glazebrook et al. 2004), the consequence of which is that output model parameters are expected to be strongly correlated, and interpretation of statistical significance is mainly based on Monte Carlo simulations. We calculate errors and assess the statistical significance of fit improvements by refitting the photometry to randomized versions of the single best-fit SED model.
We compare values from least-square fits with both sets of models. We fit the stellar component model two times, once with the inclusion of the two longer IRAC channels, and once with the [5.8 µm] and [8.0 µm] bands excluded. We then fit the optical and all IRAC channels to the two component model. The lowest quality SED fits are when all IRAC channels are fit to a stellar component SED model (median ). The highest quality fits are to the two component model (median ), which are just slightly better than the fits to the stellar model excluding the two longer IRAC channels (median ). The additional component improves the ensemble quality of fit by , which our Monte Carlo simulations indicate is far above the nominal improvement expected from additional free parameters when fitting to an underlying SED with no excess flux. Thus, an SED modeled by both a stellar component and a near-infrared emission dust component represented by a 850 K GB+PAH emission spectrum is a significantly better model of a galaxy’s near-infrared light than one based on stellar emission alone.
4.4. Graybody temperatures and other limitations on the dust model
The choice of NIR emission model is based on observations compiled by da Cunha et al. (2008). Our observations do not constrain any of the parameters in the model, such as the relative scaling between the NIR continuum and PAH emission or the temperature of the continuum emission. Due to our limited spectral coverage, we only allow its normalization to be a free parameter. Other graybody temperatures were explored and we find that the continuum excess is equally fit (yielding consistent values) by graybody temperatures ranging from 700 to 1500 K. As a comparison, Flagey et al. (2006) find that a K works well for the galactic diffuse medium, while Lu et al. (2003) show that both a K and a K graybody with emissivity can match the IRAC photometry. A different extinction law () was also explored but provided no improvement in the quality of fit.
We attempted to add the temperature of the graybody as an additional parameter but found it was not possible to constrain the blackbody temperature at lower temperatures once the spectral peak of the graybody shifted outside the range of our observed photometry (for reference, an 850 K blackbody peaks at about 3.4 µm, which our IRAC observations straddle throughout ). Finally, fits to a model consisting solely of the 3.3 µm PAH emission feature do not succeed, showing only modest improvements to and unrealistically high equivalent widths, as the broad wings of the line are forced to fit the broad continuum excess. The ratio of the PAH line emission to continuum emission could not be constrained by our broadband observations, but follow up with NIR spectroscopy may prove fruitful in constraining neutral to ionized PAH fractions and PAH size distributions (e.g., Desert et al. 1990; Draine & Li 2007).
4.5. Model consistency with MIPS photometry
Almost half (40/88) of our subset of GDDS objects with spectroscopic redshifts are found in the GDDS-SA22 field, for which archival MIPS data are available. Since MIPS data were not incorporated into any of our fits, any post-facto agreement between the MIPS observations and our model strongly supports the central idea of the NIR excess continuum being scaled to the MIR PAH spectrum. The MIPS band probes rest-frame 8-12 µm, where PAH features are known to exist. Thus we visually compare the MIPS band fluxes with the GB+PAH SED component (orange dash-long-dashed line in Figure 1), using the normalization of this component derived from our two component spectral fitting. All non-detected (25/40) objects in the GDDS-SA22 field are consistent with the predicted 24 µm fluxes (Jy) from the GB+PAH component. Only 15 out of the 40 objects are detected at 24 µm with MIPS. Eleven of these 15 MIPS-detected objects show 24 µm fluxes consistent with the best-fit SED model predictions. To illustrate the degree of concordance, in Figure 8 we show typical fits for a range of galaxy spectral types. The figure shows NIR excesses for 3 of the 11 objects with confident 24 µm detections, as well as an example showing a typically informative non-detection (last row in the figure). Only four galaxies do not have 24 µm fluxes consistent with the model SEDs, and three of these show obvious source blending in the HST ACS images as a result of the larger MIPS PSF.
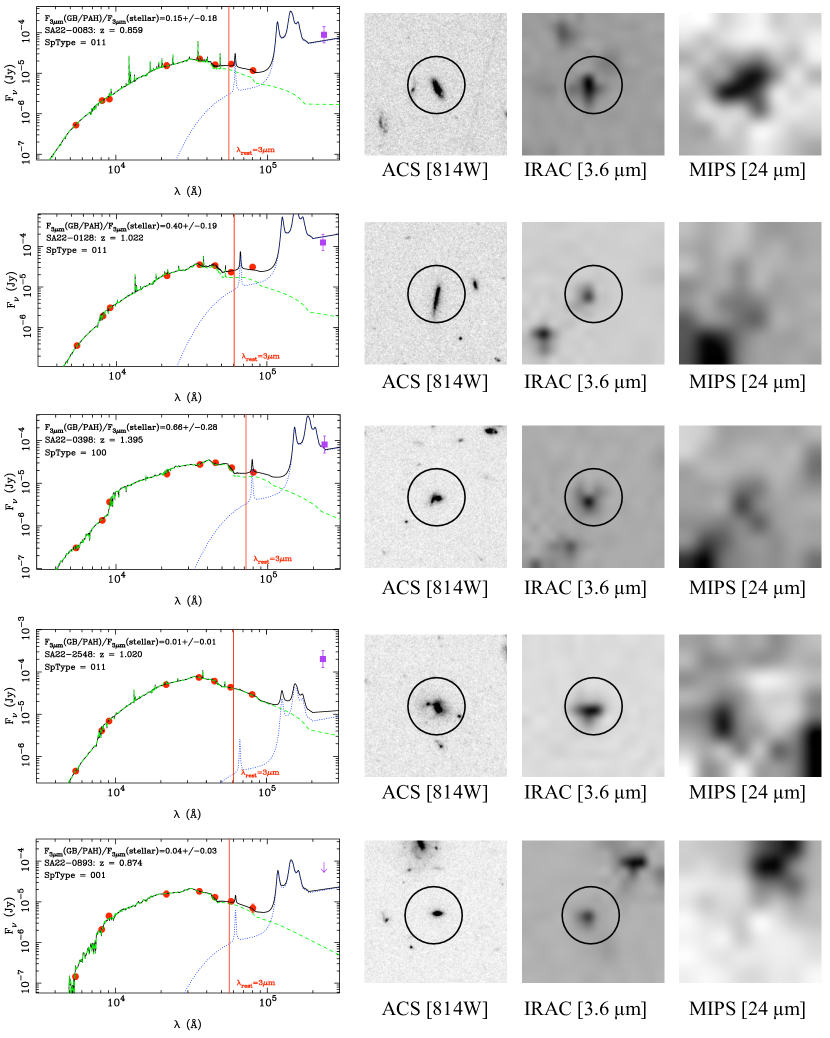
Therefore only a single galaxy (SA22-2548; plotted in the 4th row of Figure 8) is not consistent with the stellar and GB+PAH two component model for that object (computed entirely independently of MIPS)222SA22-2548 is unusual in other ways: it has strong 24 µm flux slightly offset from the optical GDDS counterpart, and the ACS image shows some indication of interaction, so its 24 µm excess may be the result of a strong AGN due to merging (although its IRAC colors ([3.6 µm] - [4.5 µm] = -0.216; [5.8 µm]-[8.0 µm] = -0.426) do not seem consistent with this).. We conclude that an additional GB+PAH model is consistent with the measured 24 µm MIPS fluxes for 97.5% of the GDDS objects observed in the only GDDS field with MIPS data.
4.6. Correlation of the Near-Infrared excess with the Star Formation Rate
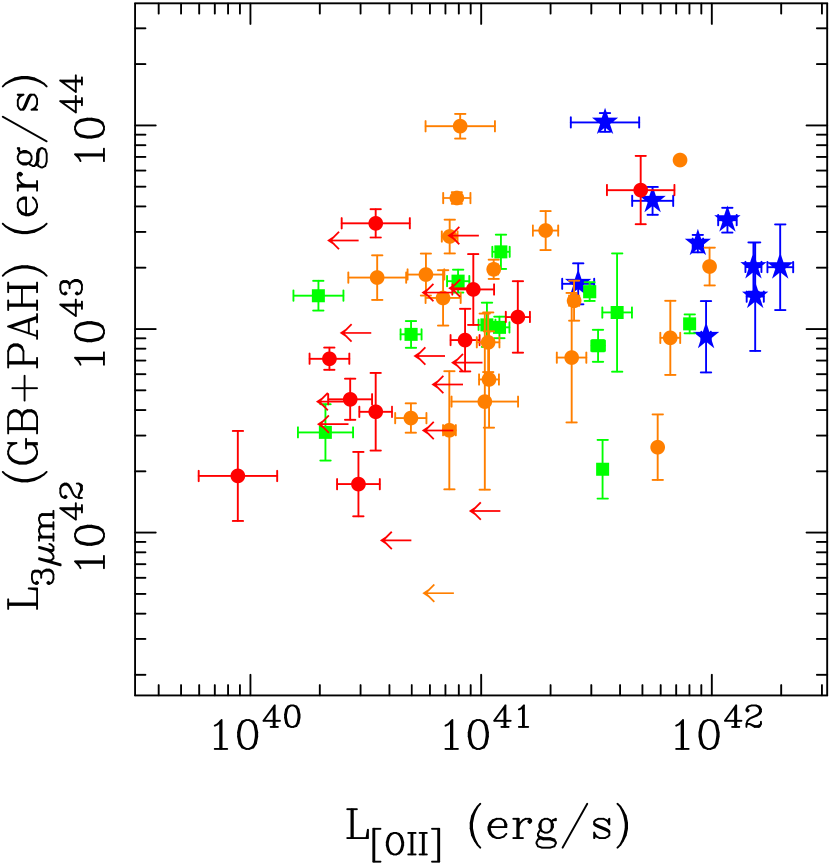
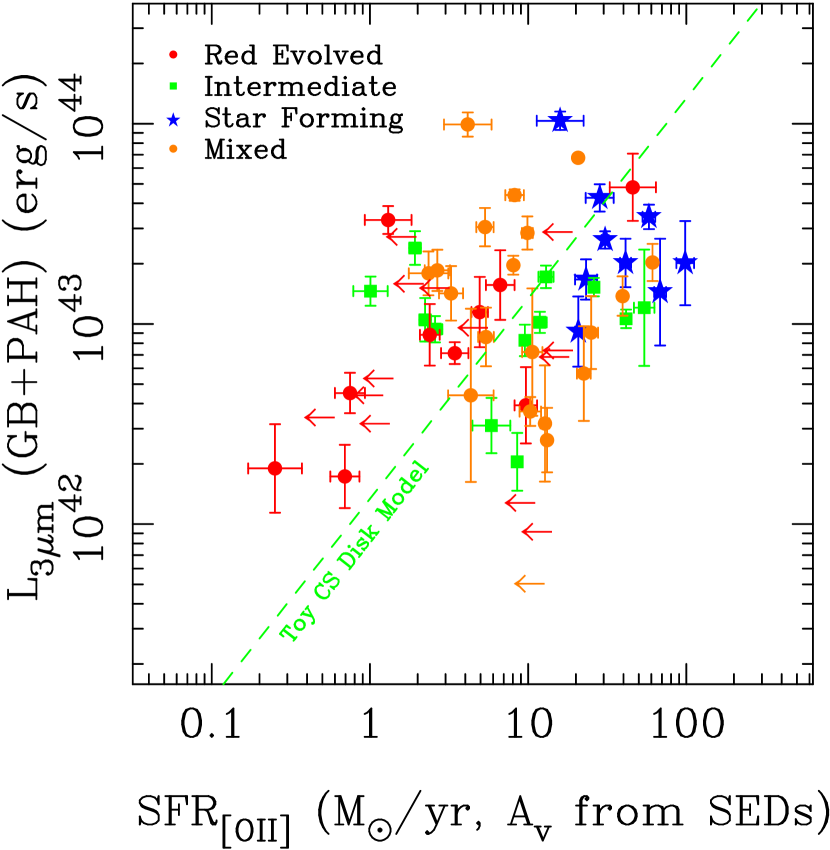
We quantify the amplitude of the NIR excess in our sample as the luminosity in the additional GB+PAH component at 3 µm. The stellar component determined from SED fits is subtracted from this quantity such that both the light from stars formed in the evolved population and the instantaneous burst are excluded. We find that this NIR luminosity is correlated () with a galaxy’s intrinsic [O II] line luminosity and its corresponding SFR derived from this line as demonstrated in Figure 9. SFRs are converted according to Juneau et al. (2005), except we apply a non-uniform dust attenuation correction using the dust attenuation given as an output parameter in the SED fitting procedure. Because the [O II] line probes the formation of massive stars, the correlation indicates that the NIR excess in these galaxies is primarily driven by star formation, and is likely powered by the radiation field provided by massive hot stars.
The correlation between the 3 µm luminosity of the GB+PAH component and the SFR is not strongly dependent on model choices. Both the PEGASE.2 and M05 models yield a similar correlation, although we have chosen to highlight the results from the M05 models which are shown to be a better representation of the NIR stellar light of globular clusters in the Magellanic Clouds due to their treatment of TP-AGB stars. However, some dependence would be expected on the choice of the dust model, in this case the GB+PAH component described in 3.2, as the broad continuum modeling in the NIR is different in various dust models (see Desert et al. 1990; Draine & Li 2007 for some examples of theoretical dust models). These dust components may also successfully model the NIR excess, but data at longer infrared wavelengths, combined with NIR and MIR observations, are required to correctly model the behavior of the dust.
5. Interpretation
The correlation between the NIR excess emission and SFR is interesting for a number of reasons. As noted in the previous section, it provides us with a potentially useful mechanism for determining the instantaneous SFR from the flux density at rest-frame 2-5 µm. Unlike visible-wavelength indicators of the SFR like the UV continuum or the [O II] line, the amount of light extinguished by dust is likely to be minimal at 3-4 µm, so that the rest-frame color may be useful as a sensitive and nearly extinction-free tracer of star-formation.
The further importance of the results presented in the previous section depends on the nature of the sources responsible for the excess emission. As we have already noted, the source of the emission may be a component of a galaxy that at other wavelengths is overwhelmed by either starlight or re-radiated emission from large dust grains (note in Figure 1 that a K blackbody peaks at the minimum of these components). If, for example, it could be shown that the emission originates from protostellar or protoplanetary disk emission, then the excess emission might present us with an opportunity to probe the formation rate of planetary systems at high redshifts. On the other hand, if the emission originates in the interstellar medium (ISM) or post-AGB stars, it presents us with an opportunity to learn more about the interplay between radiation-driven winds and chemical enrichment in young galaxies. Furthermore, if low-luminosity AGNs are responsible for the excess, the correlation with the SFR indicates a connection between the growth of black holes and star-formation in our mass-selected sample.
The five best candidates for excess emission are:
- 1.
- 2.
- 3.
- 4.
- 5.
In the following sections we investigate whether these candidates can be responsible for the observed excess. We first consider large scale, non-stellar, sources of NIR emission in Section 5.1 and then in Section 5.2 we extrapolate the NIR luminosity from dust emission around stellar candidates, to determine if it is enough to account for the total galactic NIR excess emission.
5.1. Non-stellar candidate sources of excess emission
5.1.1 Low luminosity AGN candidates
As noted in Section 2.2 and 2.3, IRAC & MIPS colors suggest that contamination of our sample from strong AGN is likely to be small. However, recent MIR spectroscopy of a survey of nearby bright galaxies from Goulding & Alexander (2009) suggests that optical spectroscopic surveys can miss up to half of the AGN population due to large dust obscuration. Indeed, NIR and MIR excesses observed in a deeper K-selected sample than ours are attributed by Daddi et al. (2007) to be due to AGN. They find that 20%-30% of their sample show MIR excesses higher than those expected from UV derived SFRs alone. On the other hand, Donley et al. (2008) show that MIR AGN detection criteria, although successful at detecting an AGN, can be significantly contaminated by star-forming galaxies and the fraction of MIR sources with an AGN is at MIR flux densities less than 300 (only 2/15 of our objects with MIPS detections have MIR flux densities greater than 300 ). Thus, we can rule out strong AGNs as a candidate for the excess emission which is seen in the majority of our sample.
Since weak AGNs outnumber strong AGNs by a large factor (e.g., Trump et al. 2007), the degree of contamination by AGNs in any sample depends on depth and we cannot rule out contamination by weak AGNs at the level. It is therefore interesting to consider whether hot dust heated by a contaminating sample of weak AGN at this level could contribute significantly to the 3 µm excess seen in our observations.
We think this is implausible for a number of reasons. First, heating large quantities of hot dust to the required 800 K – 1200 K is likely to be important only for strong AGN. For example, (Riffel et al. 2009) studied the NIR spectral properties of 24 Seyfert galaxies, and they show that the NIR continuum in AGN is well-described using a three component model made up of a featureless continuum plus two hot blackbody components (Riffel et al. 2009). We can certainly exclude a dominant featureless continuum AGN component from our sample on the basis of our IRAC colors (see Figure 3), and based on the absence of a significant K-band excess. Figure 1 shows an SED for Mrk 231, a typical AGN, which has excess emission blueward of 2 µm, we do not find this type of excess in our photometry (see Figure 5). These authors then show that SyI and SyII samples have markedly different contributions from hot dust: 90% of SyI systems show evidence for hot dust, as opposed to only 25% for the SyII population. Therefore, even if our sample is being contaminated by a population of weak AGN, only a small subset of these is likely to be contributing significantly to the 3 µm excess. This is clearly inconsisent with Figure 9, which shows that the excess is a common characteristic of star-forming systems, reinforcing the view that star formation, and not an AGN, is primarily powering the NIR excess in our K-selected sample.
5.1.2 Galactic cirrus
Could the NIR continuum excess seen simply be a scaled up galactic cirrus component? This idea seems attractive, because after all the canonical SED being used to model the component is based on da Cunha et al. (2008)’s NIR emission model which is shown to match the observed colors of the galactic cirrus. Attributing the excess to cirrus would seem a natural interpretation, provided the energetics can be made to work.
Large-scale observations by Spitzer and COBE of the galactic cirrus reveal a continuum component in the NIR, whose field to field variations are weak and has a strong contribution to the IRAC [3.6 µm] channel, contributing 50%-80% of the flux, while the PAH feature at 3.3 µm contributes the remaining flux (Flagey et al. 2006) . Two papers have quoted the irradiance of the galactic cirrus in the -band and they are similar, on average, for two fields at different galactic latitudes. DIRBE measurements from Bernard et al. (1994) find for for two strips of the galactic plane covering to and to below and above the galactic plane. Using IRAC measurements of the galactic cirrus, at latitudes ranging from to , Flagey et al. (2006) find an average intensity of at . On the basis of these measurements, it seems that galactic cirrus has a surface brightness on the order of Jy/arcsec2. In an Euclidean universe surface brightness is conserved with distance, although in reality cosmological surface brightness dimming reduces the apparent surface brightness by a factor of around 40 at . The cirrus is expected to have a surface brightness on the order of several tens of nJy/arcsec2 at . A typical GDDS galaxy subtends an area around 1 arcsec2 at these redshifts, so the total flux contributed from cirrus will be around 50 nJy at a rest-wavelength of 3m. Inspection of Figures 5–8 makes it clear that this corresponds of the NIR excess. On the other hand, it may be the case that cirrus at high redshifts is far brighter than is the case in the Milky Way. Cirrus NIR emission is expected to scale linearly with the interstellar radiation field (Desert et al. 1990), so an interstellar radiation field 1000 times that in our own galaxy is needed. Given the modest SFRs in our sample ranging to a maximum of (at most 20–50 times that of the Milky Way), we conclude that it is unlikely that emission from cirrus dominates the NIR excess, though we cannot rule out a contribution from cirrus at the 10% level.
5.2. Stellar candidate sources of excess emission
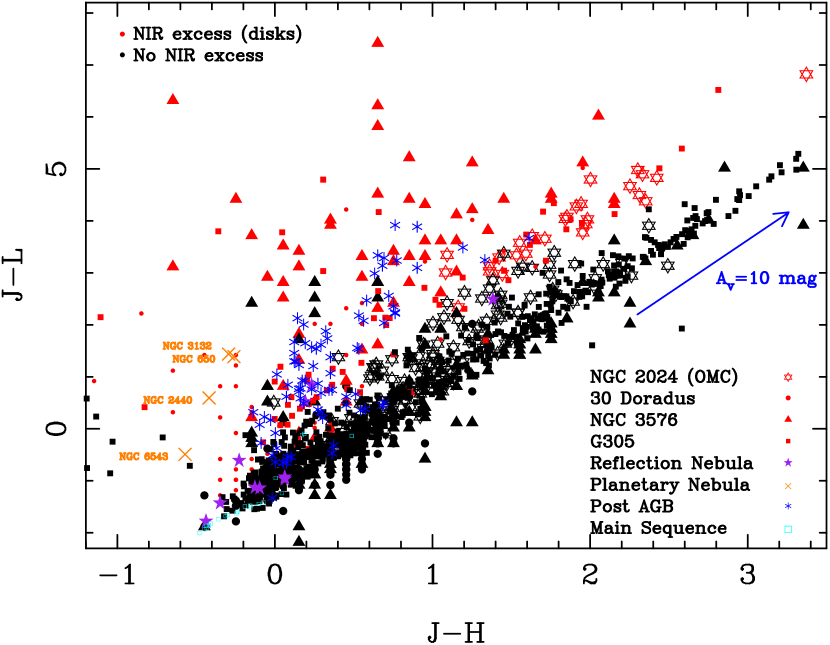
In Figure 10, we synthesize observations from the Milky Way and the LMC in a (AB) color-color diagram for each of the proposed stellar candidates (3-5) for the NIR excess emission. Main-sequence (MS) stars (open cyan squares) not embedded in a dust cloud occupy a region in the bottom left (Leggett et al. 2003, 2006). For dust embedded sources, both the and colors are reddened due to extinction away from the MS along the plotted vector for 10 mag of visual extinction (Indebetouw et al. 2005) .
Using Figure 10 as a starting point, we now consider in turn which of these local candidates seems most likely to be responsible for the bulk of the NIR excess seen in the high-redshift population. The luminosity in the NIR excess component plotted as a function of SFR in Figure 9 demonstrates that a useful fiducial luminosity is erg/s. Our simple strategy is to explore how much of each possible candidate would be needed to reach this luminosity in a typical galaxy.
5.2.1 Reflection nebulae
NIR excesses are commonly seen in the diffuse emission around visual reflection nebulae (RNae) (Sellgren et al. 1983, 1996) and Sturm et al. (2000) show that a scaled spectrum of NGC 7023, the archetypal RN, matches the spectrum of the starbursting galaxy M82 in the near to mid-IR. We investigate how many RNae are needed to contribute to the NIR excess seen in the GDDS galaxies. Some of the central massive stars powering visual RNae (Sellgren et al. 1996) also show NIR excess colors as plotted as purple stars in Figure 10. For concreteness, we adopt NGC 7023 (d=430 pc) as a reference object, and note that in this object the integrated NIR excess for the star and the nebula are similar in integrated luminosity. The central star of NGC 7023, the B2e type star HD 200755, has an L-band magnitude of (Sellgren et al. 1996). This leads to an intrinsic NIR luminosity of erg/s. Sellgren et al. (1983) measure the intensity of the diffuse nebular region at a number of positions offset from the central star. The intensity drops off as a function of distance. To estimate the integrated flux, we opt for maximizing the potential contribution of the excess by choosing the strongest intensity measured ( W/m2/Hz-1/sr) and integrating the surface brightness over the nebula out to 120″, where the surface brightness drops by a factor of 10. We find the nebular region to have a maximum integrated luminosity of erg/s.
NGC 7023 is a special RN as the central star also exhibits strong NIR excess in addition to the diffuse NIR excess. However, the amount of integrated NIR luminosity for the diffuse region is not special for this source. NGC 2023 and NGC 2068, also relatively bright RNae measured in Sellgren et al. (1983), have similar intrinsic NIR luminosities integrated over their surfaces of erg/s and erg/s, respectively. In both cases, we used the distance to the Orion Nebula (d=490 pc) and assumed the nebula covered a circular aperture in the sky of 180″ in diameter. To match the fiducial NIR excesses in GDDS galaxies of erg/s, about 107 RNae like NGC 7023, NGC 2023 and NGC 2068 would have to populate an average GDDS galaxy at the time of observation. Locally, RNae typically reside around stars ranging in effective temperatures from 6,800-33,000 K ( M⊙), but only a fraction of those surveyed (16/23) display NIR excesses (Sellgren et al. 1983, 1996). Given that only about (Magakian 2003) have been observed in our Galaxy, it is unlikely that reflection nebulae are responsible for much of the observed NIR excess, but they cannot be completely ruled out given the selection bias of the RNae surveyed locally.
5.2.2 Post-AGB stars/planetary nebulae
NIR excesses with spectral signatures indicative of hot ( K) continuum emission have been observed in post-AGB stars (de Ruyter et al. 2006) and planetary nebulae (Phillips & Ramos-Larios 2005). Strong mass outflows from intermediate initial mass stars () excites both gas and dust surrounding the luminous (100 - 1000 L⊙) post-AGB stars for relatively short timescales of 104 yrs (de Ruyter et al. 2006). Phillips & Ramos-Larios (2005) attribute -band excesses found in a range of planetary nebula to photon heating of very small grains to temperatures on the order of K. In Figure 10 we plot the location of several planetary nebulae as orange crosses. In a study of 51 post-AGB stars, de Ruyter et al. (2006) find that all post-AGB stars contain large IR excesses with dust excess starting near the sublimation temperature, irrespective of the effective temperature of the central star. They argue that in all systems, gravitationally bound dusty disks are present. The disks must be puffed-up to cover a large opening angle for the central star and we argue that the disks have some similarity with the passive disks detected around young stellar objects (see Section 5.2.3). The dust excesses of post-AGB stars are noted to be bluer with smaller mid- and far-IR colors compared to the excesses found around Herbig Ae/Be stars and are therefore likely more compact (de Ruyter et al. 2006).
It is straightforward to show that the contribution to the NIR excess from post-AGB stars is not enough to fully account for the NIR excess seen in the integrated luminosity of high-z star-forming galaxies. About of the mass formed in an episode of star formation will be in stars with masses of that will enter the post-AGB phase stage within 200 Myr after a instantaneous burst of star formation (the average burst age output by our SED modeling is 247 Myr). To see a noticeable contribution from the short-lived AGB stars to the NIR excess, large-scale and high duty cycle star formation is required. We find in our SED modeling that the average amount of mass formed in an instantaneous burst of star formation is . In order to reach luminosities of 1043erg/s, all of the stars formed in the instantaneous burst would have to be in the post-AGB phase at the time of observation, assuming such a star has a , a conservative upper limit. This requires 108.5 M⊙ to be formed in just 104 years (de Ruyter et al. 2006), the typical timescale for the AGB phase and for all the 4-8 M⊙ stars to enter post-MS evolution at the same time, an unrealistic scenario since we know the spread in turnoff ages for the masses are larger than 104 years. We also note that due to the delayed response of the post-AGB phase, we would not expect a correlation between NIR excess in AGB stars and O II luminosity (the SFR indicator traces the most massive population).
5.2.3 Circumstellar disks around young massive stars
A number of observations (e.g., Haisch et al. 2000; Maercker & Burton 2005; Maercker et al. 2006; Longmore et al. 2007) suggest that protostellar/protoplanetary circumstellar disks in star-forming regions are attractive candidates for the NIR excess. These observations, compiled in Figure 10, show that the largest L-band excesses locally (up to 5 mags) are due to excesses seen in massive stars () in massive star-forming complexes. Circumstellar disks are proving ubiquitous in regions of high star-formation, and the inner puffed up rims of circumstellar disks are predicted to be heated to temperatures high enough to produce prominent spectral bumps that peak at .
The taxonomy used to describe such systems has grown rather large, encompassing various classes, stages, and groups, and the reader interested in the terminology used to describe young disks is referred to the ‘diskionary’ presented by Evans et al. (2009). For present purposes it suffices to consider whether the IR excess we have detected could be due to any class (or classes) of circumstellar disks in a general sense, although for the sake of concreteness we will base much of our discussion on the flared disk model presented by Dullemond et al. (2001). In this particular model, the inner part of the disk is removed out to a radius (6 AU for a B2 star) of the dust evaporation temperature ( K). Unlike the top and bottom surfaces of the flared disk which receive radiation from the star at a grazing angle, the inner edge of the disk receives radiation face-on and has a large covering fraction of the central star. The result is a disk that is substantially heated to temperatures up to and the disk becomes puffed up, increasing the surface area of the inner rim and the NIR emission (see Dullemond et al. 2001 for schematic diagrams).
We once again refer the reader to Figure 10 for a summary of the local observations. The figure presents a number of data points (open stars) showing the colors of YSOs in NGC 2024 (Haisch et al. 2000), a young (0.3 Myr; Meyer 1996) massive star-forming region in the Orion molecular cloud (OMC). Haisch et al. (2000) conclude that of NGC 2024’s members exhibit NIR excesses due to circumstellar disks as indicated by their colors. These excesses are seen down to quite low stellar masses, further suggesting that disks form around the majority of the stars. From their sample of 328 pre-main-sequence stars, 45 objects exhibit extremely red excesses of . They attribute these to being Class I protostars, but another possible scenario we present is that the excess NIR emission could be from disks around the more massive objects.
Moving beyond the OMC to 30 Doradus in the LMC and other large star-forming complexes in our own Galaxy, Maercker & Burton (2005), Maercker et al. (2006) and Longmore et al. (2007) have studied IR excess objects using photometry obtained in and the IRAC bands. These points are also shown in Figure 10. Objects that have -band IR excesses are plotted using red symbols, while those without excesses are plotted as black symbols. The non-IR excess objects roughly follow a linear trend expected due to extinction through the line of sight of the molecular clouds they are embedded in. IR-excess objects in the Maercker & Burton (2005) and Maercker et al. (2006) papers show a striking divide from typical reddening to IR-excess with a shift of mag redder in L-band. This is likely because they are only reaching the more massive stars in the clusters ( for 30 Dor and for NGC 3576) and in agreement with the model of Dullemond et al. (2001) this would lead to the largest L-band excess. In the OMC sample from Haisch et al. (2000), which extends down to lower masses, the L-band excess objects are classified based on their NIR colors, however, it is apparent that there is a smooth transition away from the reddening locus, indicative of an NIR excess that increases with stellar mass also in agreement with the disk model of Dullemond et al. (2001).
Can the NIR excess due to emission from the inner puffed up rims of circumstellar disks provide enough excess flux to account for the excess seen in the integrated light of galaxies? Dullemond et al. (2001) calculate the NIR excess fluxes due to disks to be , for stars of spectral types B2, A0, G2 and M2, luminosities of and masses of . Using the results of their Table 1, the NIR excess due to the flared disk is related to the mass of the star by
| (1) |
We can integrate this over the IMF to figure out the total luminosity excess in the NIR for a given amount of mass formed during a period of star formation. Using the Kroupa (2001) IMF, we find the NIR excess due to circumstellar disks is . While this seems like a high light-to-mass ratio, it is in fact very typical for very young Myr star-forming regions, which output high IR luminosities.
We can then estimate the total NIR excess luminosity for a galaxy forming stars at a given SFR as:
| (2) |
The cluster disk fraction drops drastically from at Myr to by Myr (Maercker & Burton 2005; Maercker et al. 2006) so Myr is a good order of magnitude estimate for the timescale of circumstellar disks. We plot this simple linear relationship along with the distribution of GDDS data points in right panel of Figure 9. The overall normalization of the model is remarkably consistent with the data points. We find that circumstellar disks with a puffed up inner rim can contribute enough NIR luminosity to be seen over the stellar component of a galaxy and these objects may well be responsible for the NIR excess seen in our high-redshift sample.
We emphasize that the model presented is very simple and rather crude. Changing the viewing angle of the disks would lead to changes in the excess, and the relevant timescales may well be shorter than 1 Myr for the most massive stars which would be provide the bulk of the light. And although we integrate the IMF down to 0.1 , the actual contribution from stars with to the NIR excess luminosity is only % of the total NIR excess luminosity for a Kroupa (2001) IMF, so we are really only seeing light from disks around massive young stars.
Given the simplicity of the assumptions in our toy model, the order of magnitude agreement with the data seems rather striking. Nevertheless, the scatter in the data clearly shows that a simple scaling of the IMF is only an approximation. Any number of physical differences in these galaxies could lead to the scatter from this simple model, such as variations in metalliticity, IMF or reddening. For example, a heavier IMF would result in a higher NIR excess since the fraction of the most massive stars which have the highest excesses would be greater. Alternatively lower metallicity might also lead to a smaller NIR excess for a given galaxy if the density of grains or molecules which cause the excess is smaller. And it is interesting to note that nearby, MIR and PAH emission is shown to be smaller in low-metallicity environments (Engelbracht et al. 2005; Madden et al. 2006). Another possibility is that the optical measure of the SFR upon which this diagram has been constructed may have been over-estimated, due to incorrect dust corrections which impact the most actively star-forming galaxies more than they do the quiescent galaxies. In any case, the important point is that if the IR excess is indeed due to a population of circumstellar/protostellar/protoplanetary disks, modeling the data shown in Figure 9 as a function of these input parameters presents us with an opportunity to determine the rate at which disks form in high-redshift galaxies as a function of basic observables, such as a galaxy’s global metallicity, mass, and SFR. Furthermore, if the presence of disks around massive young stars can be extrapolated to lower mass systems which harbor the potential to form planets, then measurements of the NIR excess provide us with a chance to explore protoplanetary/protostellar disk formation in a galactic context, opening up a wide range of interesting studies. The most exciting from a cosmological standpoint might be the measurement of the volume-averaged cosmic evolution of planet formation.
6. Conclusions
In a sample of 88 galaxies from the GDDS, a near-infrared excess is detected in the observed IRAC [5.8 µm] and [8.0 µm] bands. The excess can be modeled as an additional SED component consisting of a modified 850 K graybody augmented with a mid-IR PAH emission template spectrum (da Cunha et al. 2008). The luminosity of the excess SED component is correlated with the SFR of the galaxy, implying the possibility of using NIR luminosity as an extinction-free star formation tracer. Our exploration of the origin of the excess flux by examining NIR excesses in our own Galaxy has provided a number of tantalizing possibilities. From all of the possible NIR excess candidates seen locally, we find that circumstellar disks are the most likely candidates for the observed NIR excess. Our simple conversion of a SFR to a total NIR luminosity using locally calibrated disk timescales and intrinsic luminosities agree with the total integrated NIR luminosity excess measured in the GDDS sample of high-z galaxies. All other candidates require unrealistic abundances or extremely high duty cycle star formation. It seems natural to suppose that the presence of circumstellar disks around massive stars at high redshifts would imply also the presence of disks around less massive stars. These would be systems in which we would expect planets to form. This presents us with an opportunity to probe the formation of planets as seen in their total integrated light at high redshifts, at cosmic epochs even before our own Solar System formed.
References
- Abraham et al. (2004) Abraham, R. G., et al. 2004, AJ, 127, 2455
- Abraham et al. (2007) Abraham, R. G., et al. 2007, ApJ, 669, 184
- Arendt et al. (1994) Arendt, R. G., et al. 1994, ApJ, 425, L85
- Bernard et al. (1994) Bernard, J. P., Boulanger, F., Desert, F. X., Giard, M., Helou, G., & Puget, J. L. 1994, A&A, 291, L5
- da Cunha et al. (2008) da Cunha, E., Charlot, S., & Elbaz, D. 2008, MNRAS, 388, 1595
- Daddi et al. (2007) Daddi, E., et al. 2007, ApJ, 670, 173
- Dale et al. (2005) Dale, D. A., et al. 2005, ApJ, 633, 857
- de Ruyter et al. (2006) de Ruyter, S., van Winckel, H., Maas, T., Lloyd Evans, T., Waters, L. B. F. M., & Dejonghe, H. 2006, A&A, 448, 641
- Desert et al. (1990) Desert, F.-X., Boulanger, F., & Puget, J. L. 1990, A&A, 237, 215
- Donley et al. (2008) Donley, J. L., Rieke, G. H., Pérez-González, P. G., & Barro, G. 2008, ApJ, 687, 111
- Draine & Li (2007) Draine, B. T., & Li, A. 2007, ApJ, 657, 810
- Dullemond et al. (2001) Dullemond, C. P., Dominik, C., & Natta, A. 2001, ApJ, 560, 957
- Engelbracht et al. (2005) Engelbracht, C. W., Gordon, K. D., Rieke, G. H., Werner, M. W., Dale, D. A., & Latter, W. B. 2005, ApJ, 628, L29
- Evans et al. (2009) Evans, N. et al. 2009, arXiv:0901.1691
- Fazio et al. (2004) Fazio, G. G., et al. 2004, ApJS, 154, 10
- Fazio et al. (2006) Fazio, G., et al. 2006, Spitzer Proposal ID #30328
- Fioc & Rocca-Volmerange (1997) Fioc, M., & Rocca-Volmerange, B. 1997, A&A, 326, 950
- Flagey et al. (2006) Flagey, N., Boulanger, F., Verstraete, L., Miville Deschênes, M. A., Noriega Crespo, A., & Reach, W. T. 2006, A&A, 453, 969
- Glazebrook et al. (1998) Glazebrook, K., Offer, A. R., & Deeley, K. 1998, ApJ, 492, 98
- Glazebrook et al. (2004) Glazebrook, K., et al. 2004, Nature, 430, 181
- Goulding & Alexander (2009) Goulding, A. D., & Alexander, D. M. 2009, MNRAS, 298, 1045
- Haisch et al. (2000) Haisch, K. E., Jr., Lada, E. A., & Lada, C. J. 2000, AJ, 120, 1396
- Helou et al. (2004) Helou, G., et al. 2004, ApJS, 154, 253
- Hora et al. (2004) Hora, J. L., Latter, W. B., Allen, L. E., Marengo, M., Deutsch, L. K., & Pipher, J. L. 2004, ApJS, 154, 296
- Imanishi et al. (2006) Imanishi, M., Dudley, C. C., & Maloney, P. R. 2006, ApJ, 637, 114
- Indebetouw et al. (2005) Indebetouw, R., et al. 2005, ApJ, 619, 931
- Ivison et al. (2004) Ivison, R. J., et al. 2004, ApJS, 154, 124
- Juneau et al. (2005) Juneau, S., et al. 2005, ApJ, 619, L135
- Kennicutt et al. (2003) Kennicutt, R. C., Jr., et al. 2003, PASP, 115, 928
- Kessler et al. (1996) Kessler, M. F., et al. 1996, A&A, 315, L27
- Kroupa (2001) Kroupa, P. 2001, MNRAS, 322, 231
- Lada & Adams (1992) Lada, C. J., & Adams, F. C. 1992, ApJ, 393, 278
- Leggett et al. (2003) Leggett, S. K., et al. 2003, MNRAS, 345, 144
- Leggett et al. (2006) Leggett, S. K., et al. 2006, MNRAS, 373, 781
- Longmore et al. (2007) Longmore, S. N., Maercker, M., Ramstedt, S., & Burton, M. G. 2007, MNRAS, 380, 1497
- Lu et al. (2003) Lu, N., et al. 2003, ApJ, 588, 199
- Madden et al. (2006) Madden, S. C., Galliano, F., Jones, A. P., & Sauvage, M. 2006, A&A, 446, 877
- Maercker & Burton (2005) Maercker, M., & Burton, M. G. 2005, A&A, 438, 663
- Maercker et al. (2006) Maercker, M., Burton, M. G., & Wright, C. M. 2006, A&A, 450, 253
- Magakian (2003) Magakian, T. Y. 2003, A&A, 399, 141
- Magnelli et al. (2008) Magnelli, B., Chary, R. R., Pope, A., Elbaz, D., Morrison, G., & Dickinson, M. 2008, ApJ, 681, 258
- Maraston (2005) Maraston, C. 2005, MNRAS, 362, 799
- McCarthy et al. (2004) McCarthy, P., Abraham, R., Chen, H.-W., Crampton, D., Glazebrook, K., Savaglio, S., & Yan, L. 2004, Spitzer Proposal ID #3554, 3554
- McCarthy et al. (2001) McCarthy, P. J., et al. 2001, ApJ, 560, L131
- Meyer (1996) Meyer, M. R. 1996, Ph.D. Thesis,
- Mouri et al. (1990) Mouri, H., Kawara, K., Taniguchi, Y., & Nishida, M. 1990, ApJ, 356, L39
- Phillips & Ramos-Larios (2005) Phillips, J. P., & Ramos-Larios, G. 2005, MNRAS, 364, 849
- Papovich et al. (2006) Papovich, C., et al. 2006, ApJ, 640, 92
- Pei (1992) Pei, Y. C. 1992, ApJ, 395, 130
- Pérez-González et al. (2008) Pérez-González, P. G., et al. 2008, ApJ, 675, 234
- Pope et al. (2008a) Pope, A., et al. 2008, ApJ, 675, 1171
- Pope et al. (2008b) Pope, A., et al. 2008, ApJ, 689, 127
- Rieke et al. (2004) Rieke, G. H., et al. 2004, ApJS, 154, 25
- Riffel et al. (2009) Riffel, R., Pastoriza, M. G., Rodríguez-Ardila, A., & Bonatto, C. 2009, MNRAS, 1309
- Sajina et al. (2007) Sajina, A., Yan, L., Armus, L., Choi, P., Fadda, D., Helou, G., & Spoon, H. 2007, ApJ, 664, 713
- Sellgren et al. (1983) Sellgren, K., Werner, M. W., & Dinerstein, H. L. 1983, ApJ, 271, L13
- Sellgren (1984) Sellgren, K. 1984, ApJ, 277, 623
- Sellgren et al. (1996) Sellgren, K., Werner, M. W., & Allamandola, L. J. 1996, ApJS, 102, 369
- Stern et al. (2005) Stern, D., et al. 2005, ApJ, 631, 163
- Stetson (1987) Stetson, P. B. 1987, PASP, 99, 191
- Sturm et al. (2000) Sturm, E., Lutz, D., Tran, D., Feuchtgruber, H., Genzel, R., Kunze, D., Moorwood, A. F. M., & Thornley, M. D. 2000, A&A, 358, 481
- Trump et al. (2007) Trump, J. R., et al. 2007, ApJS, 172, 383
- Werner et al. (2004) Werner, M. W., et al. 2004, ApJS, 154, 1
- Wood et al. (2008) Wood, K., Whitney, B. A., Robitaille, T., & Draine, B. T. 2008, ApJ, 688, 1118
- Yee (1991) Yee, H. K. C. 1991, PASP, 103, 396