The role of E+A and post-starburst galaxies
II. Spectral energy distributions and comparison with observations
Abstract
In a previous paper (Falkenberg, Kotulla & Fritze 2009, astro-ph/0901.1665) we have shown that the classical definition of E+A galaxies excludes a significant number of post-starburst galaxies. We suggested that analysing broad-band spectral energy distributions (SEDs) is a more comprehensive method to select and distinguish post-starburst galaxies than the classical definition of measuring equivalent widths of (H) and [O ii] lines.
In this paper we will carefully investigate this new method and evaluate it by comparing our model grid of post-starburst galaxies to observed E+A galaxies from the MORPHS catalog.
In a first part we investigate the UV/U-optical-NIR SEDs of a large variety in terms of progenitor galaxies, burst strengths and timescales of post-starburst models and compare them to undisturbed spiral, S0 and E galaxies as well as to galaxies in their starburst phase. In a second part we compare our post-starburst models with the observed E+A galaxies in terms of Lick indices, luminosities and colours. We then use the new method of comparing the model SEDs with SEDs of the observed E+A galaxies.
We find that the post-starburst models can be distinguished from undisturbed spiral, S0 and E galaxies and galaxies in their starburst phase on the basis of their SEDs. It is even possible to distinguish most of the different post-starburst by their SEDs. From the comparison with observations we find that all observed E+A galaxies from the MORPHS catalog can be matched by our models. However only models with short decline timescales for the star formation rate are possible scenarios for the observed E+A galaxies in agreement with our results from the first paper (see Falkenberg, Kotulla & Fritze 2009a).
keywords:
Galaxies: evolution – Galaxies: formation – Galaxies: interactions – Galaxies: starburst – Galaxies: clusters: general1 Introduction
The morphology-density relation (Oemler, 1974; Dressler, 1980) and the Butcher-Oemler effect (Butcher & Oemler, 1978, 1984; Yang et al., 2004) indicate a transformation from late- to early-type galaxies during the lifetime of a galaxy in high density environments. Over the past a wide range of transformation processes have been proposed, acting in different environmental densities and on different timescales: Important mechanisms are mergers, harassment, gas stripping and strangulation.
Merging of two or more galaxies is an interaction most efficient at low relative velocities. If at least one gas-rich galaxy is involved in the merger this triggers a starburst and a subsequent morphological transformation, in general into an early-type galaxy (e.g. Barnes & Hernquist, 1996). Galaxy harassment (Moore et al., 1996, 1998) are multiple high-speed encounters in the densest regions of the cluster, but can have effects out to large cluster radii (Moran et al., 2007). This harassment process can also be connected to a starburst (Lake et al., 1998). Finally there are gas stripping and strangulation, two related processes in which the infall into the galaxy cluster and contact to the hot X-ray gas within the cluster leads to a truncation or termination of star formation (SF). One example is ram pressure stripping (RPS) of the infalling galaxy’s gas. The difference between truncation and termination is the timescale on which the gas is removed: In the case of truncation the RPS is strong enough to strip the gas out of the disk, truncating SF on timescales of 100 Myr. Termination on the other side primarily strips off the halo gas, leading to a halting of SF on longer timescales of 1 Gyr (Kawata & Mulchaey, 2008; Moran et al., 2006; Barr et al., 2007; Kodama & Bower, 2001).
To evaluate the possible mechanisms that take place during this transformation in cluster environments like harassment, gas stripping, strangulation and mergers (see, e.g., Poggianti, 2004a), the investigation of post-starburst galaxies as intermediate state between late- and early-type galaxies is necessary. Several earlier studies (e.g., Barger et al., 1996; Leonardi & Rose, 1996) found that a significant fraction of cluster members show spectral features characteristic for a recent starburst in the last 2 Gyr, and that those starbursts affected large fractions of the total galaxy mass. If those starbursts are triggered by merging this can explain the transformation of disk-dominated into bulge-dominated (S0) galaxies. This would naturally explain the resulting decrease in the fraction of blue galaxies in intermediate redshift clusters as compared to local samples (Dressler, 1980; Dressler et al., 1997; Poggianti et al., 2008). An alternative explanation for the same effect is the truncation of SF in spirals and the subsequent passive evolution, leading to a fading and migration onto the red sequence (Treu et al., 2003; De Lucia et al., 2004).
Dressler et al. (1999, Table 6) introduced a classification scheme based on the equivalent widths of [O ii] and H lines. The relevant classes for the present paper are k, k+a, a+k and e(a). e(a) galaxies have spectra that have strong Balmer absorption but [O ii] in emission. The remaining classes a+k, k+a, and k all have no detecable [O ii] emission, but differ in the strength of their balmer absorption, with a+k having strong (), k+a moderate () and k-type spectra weak () H features. Another common term for post-starburst galaxies is the class of E+A galaxies. E+A galaxies are described by a superposition of an elliptical galaxy spectrum (hence the E) with the spectra of A-type stars with strong Balmer absorption lines (the A in E+A), making if a more general class including a+k and k+a galaxies. In the remainder of this paper we will therefore use the term E+A interchangeably with the combination of k+a/a+k galaxies. Note that we assign positive signs to if H is in absorption, while positive signs mean emission of the lines.
In a first paper (Falkenberg & Fritze, 2009, Paper I hereafter) we focused on modelling E+A galaxies (Goto, 2004; Poggianti et al., 1999) with our galaxy evolution code GALEV. For this purpose we imposed different combinations of a starburst and halting of star formation (SF) with different timescales and beginning times on spiral galaxy models.
We found that the classical definition of E+A galaxies by measuring the equivalent width of Balmer absorption and [O ii] emission lines (Goto, 2004; Poggianti, 2004b; Yang et al., 2004) excludes a significant number of post-starburst galaxies, in particular those in stages with still some SF going on after a burst. By investigating model spectra we predict that Spectral Energy Distributions (SEDs) extending from UV/U through optical and eventually near-infrared (NIR) passbands 1.) allow a better distinction of E+A progenitors and scenarios and 2.) give a comprehensive census of all post-starburst galaxies of which, as we have shown, the E+As are only a subclass.
In the first part of this paper we investigate the full SEDs of our models. The second part shows a comparison of models with observations from the MORPHS group.
2 GALEV models
To model the galaxy transformation processes we use our GALEV evolutionary synthesis models (Bicker et al., 2004; Anders & Fritze, 2003; Kotulla et al., 2009). The full description of the used models and the modifications to compute the [O ii] emission line strength and equivalent widths can be found in Paper I, hence we only give a short overview here. GALEV models allow to trace the spectral and photometric evolution of galaxies with arbitrary star formation histories (SFHs). We use stellar evolution data from the Padova group (Bertelli et al., 1994) including the important TP-AGB phase. To accurately model gaseous emission lines we supplement these data with data for the Zero Age Main Sequence (ZAMS, see Anders & Fritze, 2003, for details). We further use the stellar template library of Lejeune et al. (1997, 1998). Convolving the isochrones with a Salpeter (1955)-IMF with mass-limits of and M⊙ and stellar template spectra yields isochrone spectra that can then be weighted with the SFH of each galaxy type and integrated to yield the galaxy spectrum. Magnitudes in the various bands are then computed by convolving the galaxy spectra with the filter response curves and applying the appropriate zero points.
2.1 Undisturbed galaxies
SFHs of undisturbed spectral types are calibrated using a wealth of observational data such as integrated spectra and colours, star formation rates (SFRs), gas-fractions, gaseous and stellar metallicities, and mass-to-light ratios (see Bicker et al. (2004) and Kotulla et al. (2009) for a detailed description of this calibration). Note that our galaxy types E/S0 and Sa to Sd are meant to represent spectral types resulting from the chosen SFH. In the local universe those spectral types correlate very well with morphological types, but this might not hold to arbitrarily high redshifts. To fully reproduce the observed properties of local, observed galaxies it is furthermore necessary to match the observed absolute magnitudes for the average representative of each galaxy type. Since colours and spectra only depend on the SFH (which is assumed to be independent of galaxy mass) we chose a total galaxy mass (including both stars and gas) that matches after a Hubble time the average absolute magnitudes of galaxies from the Virgo galaxy cluster.
2.2 Modelling galaxy transformation scenarios
To model galaxy transformation scenarios we add a starburst followed be a truncation of SFR or a pure truncation of SF depending on the transformation process (see Sect. 2.4 of Paper I for details). Starbursts are described by three parameters: 1) the time or redshift of the burst; 2) the burst strength , i.e. the fraction of gas available at the onset of the burst that is converted into stars during the burst; 3) the decline timescale of the exponential declining SFR after the burst. The full parameter set used in the rest of this paper are summarized in Table 1. Note that this model grid does not cover the full parameter grid. The reason for that is that we do not list any models that do not fulfill the E+A criterion (e.g. models with Sa progenitors and/or weak bursts). In this work we identify galaxies as k+a type galaxies if they have H equivalent widths and only weak [O ii] emission lines with .
| Progenitor | [Gyr] | b [%] | [Gyr] |
| Sa | 6 | 50 | 0.1 |
| 11 | 30 | 1.0 | |
| Sd | 6 | 50 / 70 | 0.1 |
| Progenitor | b [%] | [Gyr] | |
| Sc | 0.44 | 70 | 0.1, 0.3 |
| 0.57 | 70 | 0.1, 0.3 | |
| Sd | 0.44 | 0 | 0.1 |
| 0.57 | 0 | 0.1 | |
| 70 | 0.1, 0.3 | ||
| 0.90 | 70 | 0.1 |
2.3 Impact of dust extinction
Besides the SFHs the amount of dust extinction is the dominating factor influencing the colours of galaxies. However, in the present study we are not dealing with galaxies with ongoing starbursts, but rather galaxies in their later, post-starburst phases with no or only little remaining SF. In Paper I we found that only galaxies with strong bursts reach the H strong phase. By the time it reaches this stage the galaxy should be essentially gas-free, since most of the gas was consumed in the past burst and the remaining gas ejected due to feedback processes (see Sect. 5). This is also confirmed by non-detection of the majority of k+a galaxies in HI observations (Goto, 2004; Miller & Owen, 2001). Since the amount of dust is linked to the gas reservoir we do not expect significant amounts of dust in those late post-starburst phases. This is also supported by Balogh et al. (2005) who used dust sensitive optical-NIR colours and found that their spectra are not significantly affected by dust. Note that this does not contradict the findings of (very) dusty ongoing starbursts during earlier phases of galaxy transformation, e.g. the e(a) phases (Shioya et al., 2001; Balogh et al., 2005; Dressler et al., 2008; Poggianti et al., 2008).
3 Spectral Energy Distributions of Post-Starburst Galaxies
With SEDs it is possible to investigate the changes in magnitude for each filter as well as in colours of a galaxy at the same time. This enables an easy comparison of SEDs of undisturbed galaxies with SEDs of galaxies undergoing a starburst or SF truncation event.
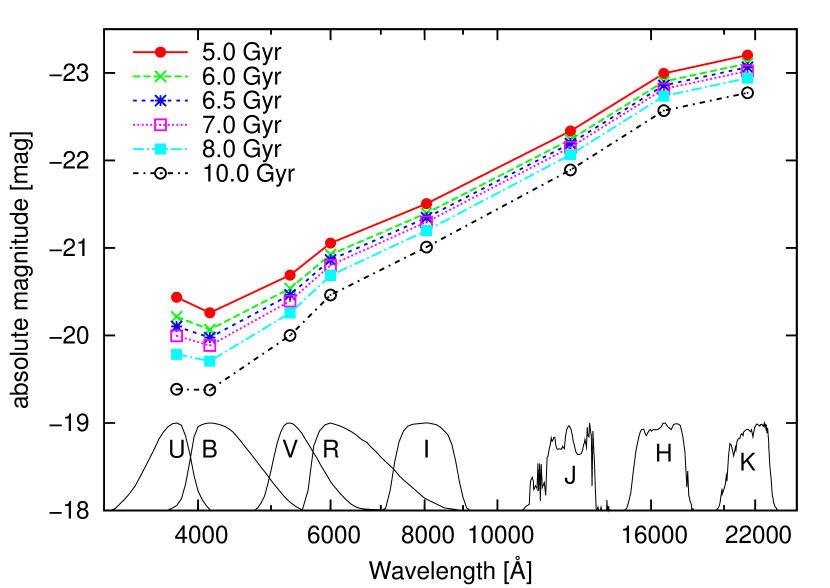
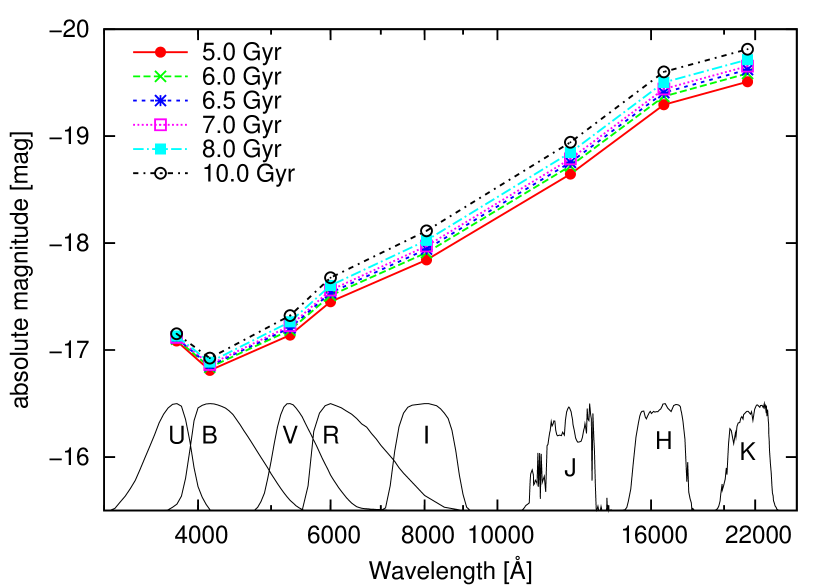
In Fig. 1 we show the SEDs of undisturbed Sa and Sd models. The symbols show magnitudes in the Vega system for the Johnson U to I and Bessell-Brett (Bessell & Brett, 1988) J to K filters, put at their respective central wavelengths. The lines connecting the symbols are only meant to guide the eye. We recall that the luminosities of our undisturbed model galaxies at an age of 13 Gyr are gauged to agree with average observed B-band luminosities of the respective galaxy types Sa, Sb, Sc and Sd as observed in the Virgo cluster. However, real galaxies show a spread in absolute magnitudes. The observed 1 ranges for galaxies of each type, derived from luminosity functions of galaxies in the Virgo cluster (Sandage et al., 1985b, a), are given in Table 2.
| Morph. Type | 1 range [mag] |
|---|---|
| apparent magnitudes | |
| E / S0 | 1.5 |
| Sa | 0.9 |
| Sb | 1.1 |
| Sc | 0.9 |
| Sd | 0.8 |
3.1 Luminosity evolution
Galaxies become fainter and bluer towards later types. Magnitudes of the typical Sa-type galaxy (see top panel of Fig. 1) hence range from in the U-band to in the K-band. The typical Sd-galaxy in comparison (bottom panel of Fig. 1) is fainter by in the U-band and in K.
The time evolution of typical brightnesses differs between galaxy types. Early-type spirals, such as Sa-type galaxies, with their declining star formation rates (SFRs) are bright early in their life and become fainter with time. This effect is most dramatic in the U-band because short wavelengths are most affected by the lower SFR at later times, while long wavelengths show smaller changes. For Sd galaxies and their constant SFR scenario the blue part of the spectrum, which is dominated by massive, hot stars with short lifetimes, very quickly reaches an equilibrium state and remains constant with time. However, cooler, low-mass and hence long-living stars slowly accumulate with time, leading to an increase of luminosity with time in the long-wavelength bands.
Undisturbed Sb and Sc models evolve similar to the Sa model, while the luminosity difference between the different ages is smaller, i.e. the SEDs for different ages lie closer together. Luminosities of the Sb and Sc models vary between those of the Sa and Sd models.
Note the change with time in the shape of the SED at the short wavelength end in case of the Sa model with its strongly decreasing star formation rate as opposed to the case of the constant SFR Sd model.
Fig. 2 shows the SEDs of an Sd model undergoing a burst leading to the maximum peak value for EW(H) and the longest E+A phase of our model grid (see Paper I, ). The burst starts at a galaxy age of Gyr and is described by a sudden increase of the SFR to a peak value and a subsequent exponential decline of SFR with time on a characteristic timescale , here . The burst strength, in this case 70%, is defined as the fraction of gas available at the onset of the burst and converted into stars during the burst.
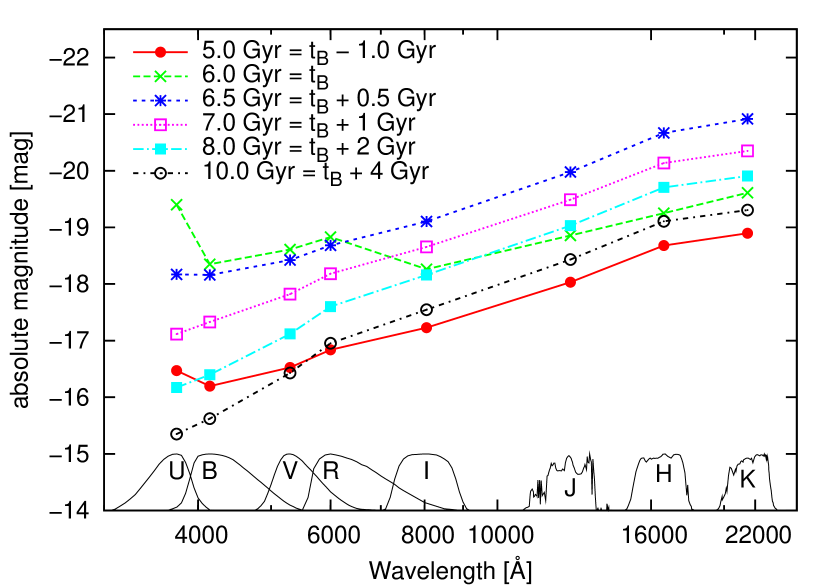
At 5 Gyr the model is still undisturbed, the SED identical with the SED at 5 Gyr in the bottom panel of Fig. 1. At 6 Gyr all luminosities of the burst SED have increased and the galaxy is now much brighter than the undisturbed model at any time. The overall shape of the SED has changed, i.e. the starburst galaxy model is even bluer than the undisturbed Sd-model. U-B colours, which appear as kink between U and B in SEDs like the one in Fig. 2, can reach for the strongest bursts. This kink is, although less prominent, also present in SEDs of undisturbed spiral galaxies, but absent in SEDs of nearby S0 and E galaxies.
At an age of Gyr, Gyrs after the burst, the galaxy already is in its H-strong phase, but has still measurable [O ii] lines. We recall that we consider a threshold of EW([O ii]); only galaxies with a lower equivalent width are regarded as E+A galaxy with absent [O ii] lines. This threshold of 5 Å is the upper threshold for EW([O ii]) from Dressler et al. (1999) (see also Paper I, ). Since the beginning of the burst luminosities in I to K have increased, while the U to R luminosities already started to decrease, but are still brighter than the undisturbed model before the burst. The H-strong model is now redder than the starburst and undisturbed Sd models. the SED of the undisturbed Sd model,
The SED 1 Gyr after the burst shows the typical SED of an E+A galaxy, for which the EW([O ii]) is now lower than 5 Å. For the SEDs at 7, 8, and 10 Gyr, all luminosities decrease with increasing age. The shape of the SED evolves with time into the SED of an early-type galaxy, which is even redder than a galaxy in the H-strong and E+A phase.
3.2 Impact of burst parameters on the luminosity evolution
In general the increase in luminosities and change in colours during the burst and the entire post-starburst phase, i.e. the phase in which the SEDs can be distinguished from those of the undisturbed spiral galaxy on the one hand, and from the S0/E galaxy SEDs on the other, is influenced by the impact of the burst. This impact in turn depends on burst strength b, decline time , onset of the burst, and galaxy type.
Progenitor galaxies of later type show more pronounced differences between the undisturbed, blue model and the post-starburst phase of the burst model. Spectral transformation into S0-type remnants is also slower for those galaxies since they overall have a relatively young stellar population which has to age first.
Bursts with earlier onset times produce more luminous starburst and post-starbursts phases. The same holds true for increasing burst strength. The reason for both effects is our definition of the burst strength. The amount of stars formed during the burst is given by the available gas-mass at the onset of the burst multiplied with the burst strength. From there it follows naturally that earlier onset times correspond to a larger available gas-mass to be turned into stars as does a larger burst strength.
Halting of star formation on the opposite leaves brighter galaxy remnants if it happened at a late stage, because until then star formation in the undisturbed galaxies leads to a continuous built-up of stellar mass.
Bursts with longer decline time evolve slower in both colour and luminosity towards their postburst-phases and finally into S0-type galaxies. Also the luminosity increase at the peak of the burst decreases with longer decline times of the burst.
In the case of a slow decline of SFR with Gyr the evolution takes Gyr more time than in the case of a short decline with Gyr. As mentioned above also the increase in luminosity is less prominent for the first case and colours do not reach as blue colours as in the latter case.
3.3 Impact of bursts on the colour evolution
During the burst and post-burst phases the U-B colour experiences the largest changes. Colours in the red part of the optical, e.g. V-I or R-J, also change slightly, while H-K colours hardly change at all. This can be explained by the stellar populations dominating each of those regions of the spectrum. The U and to a lesser degree the B to R-bands are dominated by young, hot stars which evolve rapidly with the declining star formation. NIR luminosities on the opposite are dominated by cooler and longer-lived stars and hence the increase in luminosity in these bands is roughly proportional to the increase in stellar mass, leaving the resulting colours essentially unchanged.
The shape of the long wavelengths of the SED from I to K-band hence looks similar in all post-starburst galaxies, while galaxies can have very different luminosities from -23.5 to -19 mag in the K-band. In general, all SEDs become fainter and redder after the burst with increasing age. For weak bursts galaxies can even become fainter than their undisturbed progenitor, since we assume that star formation declines exponentially to zero after the burst.
In the case of SF truncation or termination the SED immediately becomes fainter than that of the undisturbed spiral galaxy, so there is no initial increase in luminosity characteristic for the galaxies with starburst. While the U to R part of the SED very quickly adopts the shape of an S0 galaxy SED, the I to K part of the SED remains very similar to that of the undisturbed spiral galaxy.
3.4 Progenitors and remnants
In the upper part of Fig. 3, we show an Sa-type model with a burst of 50% at 6 Gyr and a decline time of 0.1 Gyr with an age of 10 Gyr. We also show for comparison the SED of an S0 and elliptical model, both normalized to match the typical B-band luminosities for their particular type as taken from Sandage et al. (1985b, Fig. 10) and Sandage et al. (1985a, Fig. 4).
The SED of the 10 Gyr old Sa post-burst model is essentially indistinguishable from that of the S0 galaxy. The luminosity difference between the SED for the E galaxy and the model SED is slightly larger than the 1 luminosity ranges of S0 and elliptical galaxies of 1.5 mag as given by Sandage et al. (1985b, see also Table 2). The Sb and Sc model luminosities match the luminosities of observed S0 galaxies within the 1 range, but cannot reach the luminosities of the typical ellipticals. The Sd model neither matches the SED of the E galaxy nor the SED of an S0 galaxy in terms of luminosities. However, considering galaxy mergers and the involved increase in mass by a factor of for equal type mergers, all spiral model SEDs are able to match the overall SED luminosities of the S0 galaxies approximately 4 Gyr after their starbursts. This is in good agreement with results obtained by Bicker et al. (2003).
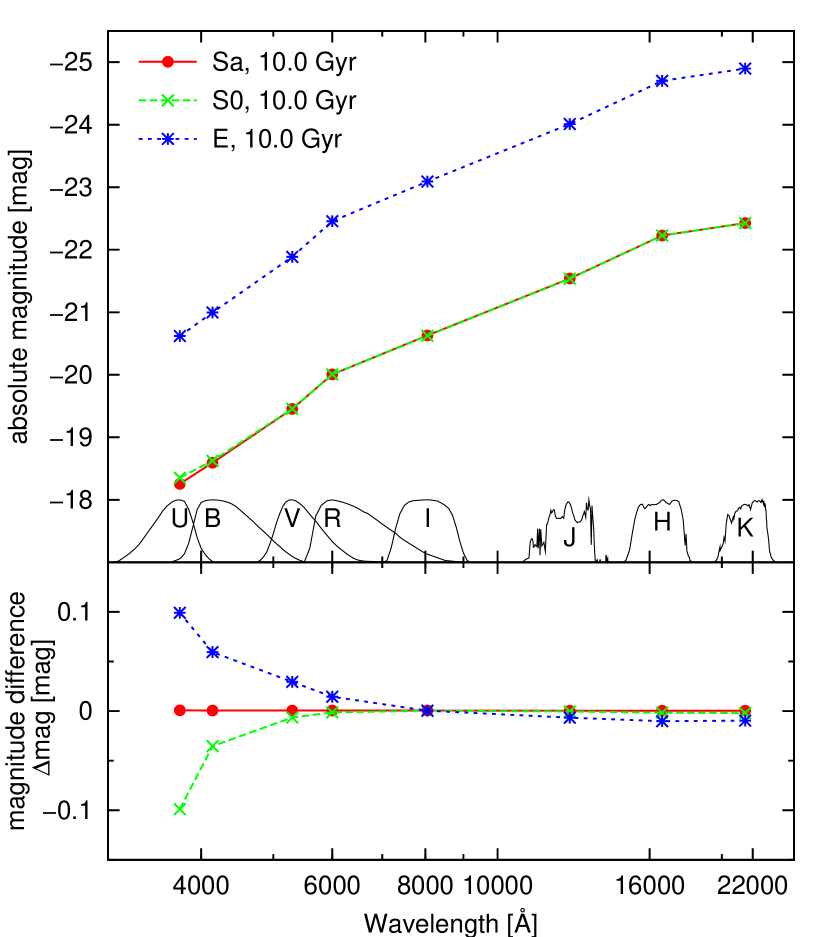
The lower part of Fig. 3 shows the magnitude difference between the Sa burst model and the S0- and E-type model. We removed the offsets due to different stellar masses presented above by matching the I-band magnitudes of all models. This emphasizes the extremly similar shapes between the post-burst Sa model and both E and S0. Colours longwards of R are essentially indistinguishable, only in the U-band are small differences. The E-type galaxy has even redder U-B colours than the Sa burst model in its postburst phase, while the S0-type model is slightly bluer in U-B.
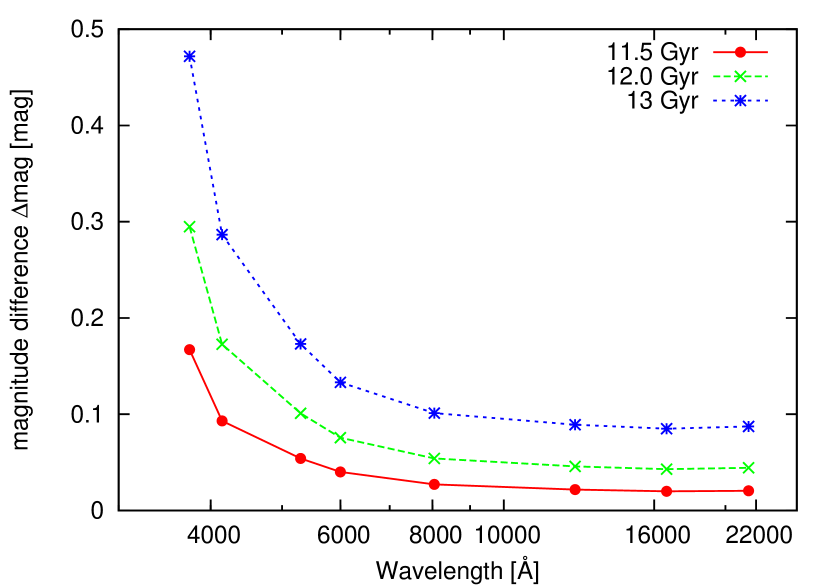
In Fig. 4 we subtracted the SED of the undisturbed Sa model from the SED of an Sa burst model with a 30% burst after 11 Gyr and a decline time of 1.0 Gyr at three different ages. This model shows one of the weakest bursts of the grid and does not even have strong Balmer absorption lines. We only show the SEDs during and close to the E+A phase, i.e. at 11.5, 12 and 13 Gyr. Colours in the I through K-bands hardly change, only the luminosity changes towards brighter magnitudes as a result of the additional built-up of stellar mass during the burst. Towards shorter wavelengths the differences increase with both increasing age and decreasing wavelength, reaching up to mag in the U-band 2 Gyr after the burst. Since this model is one of the models with the weakest burst of our grid, the differences given for this Sa model are a lower limit. The differences for other models are larger and, for example, amount to up to 1 mag for the Sd model with the maximum peak value for H. We therefore conclude that post-starburst galaxies, even after very small bursts, can be distinguished from undisturbed galaxies on the basis of their SEDs.
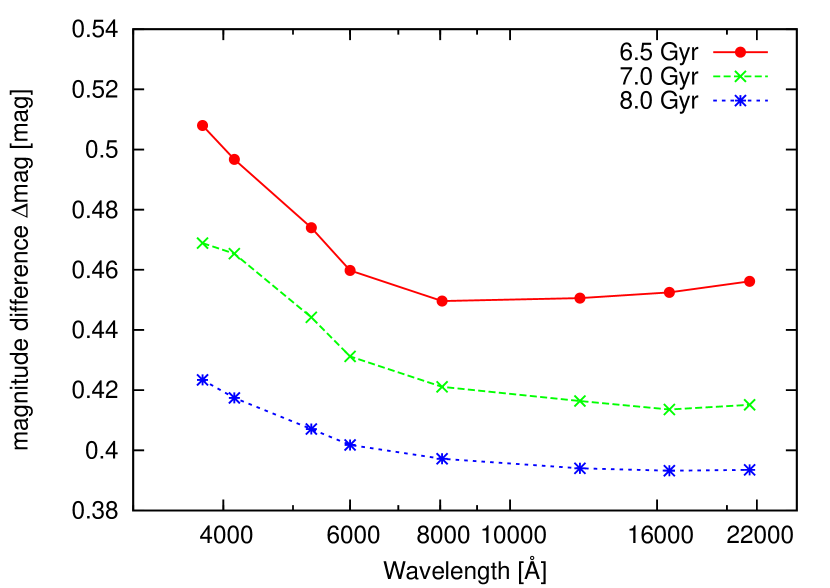
In Fig. 5 we compare SEDs of two different burst models, both starting as Sd-type model and both encountering bursts with decline time Gyr after 6 Gyr, but with different burststrengths of 30% and 50%.
We subtracted the SED of the weaker burst from the SED of the stronger burst, so that all values in Fig. 5 translate directly into magnitude differences between the two bursts in the sense that positive value mean that the stronger burst is brighter. The SEDs for ages of 6.5, 7, and 8 Gyr are shown. Although the stronger burst is brighter on average, there are only very small differences between their colours; identical colours in this representation would result in horizontal lines.
At 6.5 Gyr the maximum difference in colours is 0.05 mag and at 8 Gyr even less. Obviously some very similar models can not be clearly distinguished from each other by colours alone. However, the difference in luminosities is 0.4 to almost 0.5 mag, which makes it possible to distinguish between models by luminosity.
We therefore conclude that it is possible to distinguish E+A galaxies, post-starburst galaxies in a phase with still measurable [O ii] lines, and even post-starburst galaxies with weak H-lines from undisturbed galaxies and, to a certain limit, from each other by carefully comparing their UV/U-opt-NIR SEDs.
The advantage of this SED-based method is that only photometric observations have to be obtained while no spectroscopic line measurements are necessary. Post-starburst galaxies with emission lines, which would be excluded by the classical E+A definition, can be detected and interpreted with this method, as well as post-starburst galaxies for which the burst was not strong enough to produce strong H-lines with EW(H) 5 Å. It is also possible to distinguish between most of the models, i.e. we can identify the most likely progenitor galaxy type and estimate the burst strength. We can thus investigate the full range of post-starburst galaxies without the selection effect we have identified in Paper I, which excludes a significant number of post-starburst galaxies from the E+A class.
The U, B and V bands are the most important ones and hence should all be observed, while it is sufficient to have only one band in the near-infrared (NIR). The spectra in Paper I indicate that SEDs with additional filters in the UV, e.g. the FUV and/or NUV band from GALEX, would reveal even more significant differences between the SEDs of post-starburst galaxies.
4 Comparison to MORPHS data
We will now use our models to study observed E+A galaxies. We present the observational data and investigate them in terms of the Lick index H, luminosities, and colours. We also show how the best models can be found by comparing the SEDs of models and observations.
We adopt a cosmological model with , , , and (Spergel et al., 2007). The last parameter, the formation redshift is the assumed redshift of galaxy formation . We need this parameter to convert redshifts into galaxy ages at this redshift
| (1) |
where is the Hubble time, i.e. the age of the universe, at redshift z. Tab. 3 shows the galaxy age as a function of redshift for the cosmology we chose. Galaxy ages and redshifts used in our models below are shown in bold font.
| [Gyr] | Redshift |
|---|---|
| 3 | 1.87 |
| 6 | 0.84 |
| 7.5 | 0.57 |
| 8.4 | 0.44 |
| 9 | 0.36 |
| 11 | 0.15 |
4.1 The MORPHS E+A catalog
For the subsequent analysis we use data from the MORPHS collaboration111The data and catalogs can be found online at http://astro.dur.ac.uk/~irs/morphs (Poggianti et al., 1999; Dressler et al., 1999; Oemler, 1999). They used the Wide Field Planetary Camera 2 (WFPC2) onboard the Hubble Space Telescope (HST) to study the morphology of galaxies in ten distant clusters in a redshift range of z=0.37-0.56 (Smail et al., 1997).
The catalog lists redshift z, quality of the spectra, EW(H), luminosities, and colours for 88 possible E+A galaxies. The necessary spectroscopic data were obtained with the 200 inch (5.1 m) Palomar Hale Telescope (P200), the 4.2m William Herschel Telescope (WHT), and the 3.5m New Technology Telescope (NTT). Photometric data were taken with the 4-Shooter cameras on the 200 inch Palomar Hale Telescope and with HST using WFPC2. Although the data have been taken with various telescopes, they were processed with the same data reduction methods to ensure homogeneity.
For most galaxies r, gr and i in the Thuan & Gunn system (Thuan & Gunn, 1976, similar to the SDSS filters, magnitudes are in AB system) of the P200 are given. Data from HST in I (F814W), R (F702W), BI (F450WF814W) and VI (F555WF814W) of the HST filter system are given for only a few galaxies. To avoid uncertainties related to transformations between filter systems we therefore calculated apparent magnitudes in all those filters by computing spectra first which are then convolved with the appropriate filter response curves.
4.2 Sample selection
Galaxies with EW(H) 3 Å and no significant emission lines are classified as E+A galaxies. There is a subdivision into H-stronger E+A galaxies with H 8 Å, called a+k galaxies, and H-weaker galaxies, named k+a, with . We excluded all galaxies with doubtful classification as well as spectra of quality 4 in the MORPHS grading scheme (Dressler et al., 1999, where 1 is best and 5 is worst) to ensure reliable measurements of EW(H). We also exclude galaxies with EW(H) 5 Å, because H-values below this limit can easily be reached by non-poststarburst galaxies as we shown in Paper I. Applying these selection criteria leaves us with a final sample of 44 E+A galaxies.
4.3 Lick Index H, Luminosities and Colours of Observed E+A Galaxies
In Fig. 6, the EW(H) of all galaxies from the catalog are shown versus redshift. Filled circles indicate H-strong a+k galaxies, open circles show H-weaker k+a galaxies. It can be seen that there is a group of galaxies at redshift z0.4 and another group at corresponding to the redshifts of clusters studied by the MORPHS collaboration. The values for EW(H) range from 5 Å (our selection criterion) to 14.2 Å. The measurements of EW(H) are reproducible to 10% for H 5 Å according to Dressler et al. (1999).

In Fig. 7, the EW(H) is plotted versus r- and i-band luminosities of the Thuan & Gunn system. Filled and open circles again indicate a+k and k+a galaxies, respectively. The systematic errors for magnitudes and colours are estimated by Dressler & Gunn (1992) to be of the order of mag. These observed values of EW(H) are to be compared with the evolution of our different model EW(H) during their post-burst phases as shown in Paper I, Figs. 4-6. We recall that the maximum EW(H) reached by our models was around 8.5 Å. Please note that the two galaxies with the highest values for EW(H), located in the upper right part of the Fig. 7, are marked as questionable. We notice that there is an outlier in luminosity at r- and i-band luminosities of 18.25 mag and 18.28 mag, respectively. However, there is no note in the catalog that this galaxy has questionable values. If the luminosities and the E+A classification for this galaxy are correct, the brightness of this galaxy can only be explained by a strong previous burst in a merger of two previously very bright galaxies.


Fig. 8 shows the H equivalent width EW(H) as function of the g-r colour in the Thuan & Gunn system. From the g-r colour plot we find that k+a galaxies are redder than a+k galaxies showing higher EW(H). This is in agreement with our models which show that galaxies with high EW(H) can only have blue colours while galaxies with low EW(H) can be either blue or red (see Paper I, ).

The provided sample with HST I and R luminosities as well as B-I and V-I colours is too small to make any statistical statements. The individual galaxies can still be analyzed, however, this is not the subject of this paper.
4.4 Methods of the Comparison between Observations and Models
To compare our models with the observational data from the MORPHS catalog, we first have to ensure that EW(H), colours and magnitudes are all given on the same system. For this purpose we implemented the Thuan & Gunn filter system of the Palomar Hale Telescope into the GALEV code and convolved the spectra of our model grid with the Thuan & Gunn filter system and with the HST filter system.
Our GALEV models currently include the H definition of Trager et al. (1998, see Paper I for details) which is slightly different from the definition of Balogh et al. (1999) used by the MORPHS group. To ensure that this does not affect any of our results we measured EW(H) of an A-star spectrum degraded to the resolution of the MORPHS spectra using both definitions. The result is that the maximum deviation amounts to 0.2 Å, while the measurement uncertainties for the EW(H) is given by Dressler et al. (1999) to be of the order of 10%, which corresponds to an uncertainty of 0.5 Å for an EW(H) of 5 Å (the lowest value for EW(H) of E+A galaxies). We therefore conclude that the EW(H) as calculated by GALEV and the measured EW(H) of the MORPHS group are equivalent within the measurement uncertainties.
Dressler et al. (1999) and Dressler et al. (2004) furthermore compared the measurement of using the bandpass definition and direct line profile fits, the latter of which is used by the MORPHS group. They found that for weak but measurable cases, i.e. , the line-fitting and the bandpass methods are equivalent. For strong absorption lines, however, the bandpass definition tends to underestimate the EW, because in these cases the large population of early A-type stars with relatively broad H that is necessary to reach these line strengths leads to a depression in the continuum bands, which in turns lowers the measured line strengths. This issue of measuring the line strength of H in an optimal way is discussed in length in Dressler et al. (2004). This explains why the observations in Figs. 6-8 reach EW(H) as high as Å, while the maximum value found in our model grid is only around Å. This does, however, in no way affect any of our results or conclusions.
4.5 Results from the Comparison between Observations and Models
As we found in Paper I, we can not reproduce the MORPHS observations by any of our models with SFR decline time 0.3 Gyr: Models with longer decline times either show remaining SF during the H strong phases or are no longer H strong as soon as the SF has decreased sufficiently. However, we will not exclude the models with a longer decline time to see how good the comparison of luminosities and colours between models and observations is when trying to find matching models.
To compare MORPHS data at different redshifts with our models, the model spectra have to include cosmological and evolutionary effects as described in Sect. 2. Evolutionary (e-) corrections describe the fact that galaxies at redshift are Gyr younger than local galaxies at . Cosmological (k-) corrections on the other hand describe the bandpass shift due to cosmic expansion: The observed r-band magnitude (central wavelength: Å) resembles approximately the rest-frame g-band (). To prevent further uncertainties from entering analysis we decided to not change the observed data, but rather include both e- and k-corrections into our models.
At first we investigated which galaxy models are in their E+A phase in the redshift range between . Most models can already be excluded before any comparison with the data, because they are not in their H-strong phase in the redshift range of interest. Of course, all galaxies with an onset of burst or truncation/termination at can be excluded, because they are still undisturbed at .
The galaxy models with an onset at can also be excluded because they have already passed through the H-strong phase. ALL post-starburst galaxies with an onset at reaching EW(H) 5 Å are possible. However, the galaxies with an onset at only cover the low redshift part of the redshift range during their H-strong phase. We can therefore already predict that galaxy models with an onset between and would fit the data much better. As examples a few galaxy models with an onset at were calculated in addition to the grid explored so far.
We furthermore chose to not only use colours but also absolute magnitudes in the subsequent analysis, hence not allowing galaxy masses as completely free parameter. The physical reason for this is that the properties during and after the starburst heavily depend not only on the amount of newly born stars, but also on the star formation history before the burst (see Sect. 3). This spectral type dependence then translates into a mass-dependence, since galaxies of each type only cover a narrow mass-range as derived from absolute magnitudes in the local universe (e.g. Sandage et al., 1985b, a). This limitation hence rules out a number of otherwise possible scenarios, e.g. the formation of bright E+As by pure truncation of SF.
In Fig. 9-14, we present luminosities and colours in various filters as function of redshift. We recall that our undisturbed model SFHs were chosen as to match after 13 Gyr of undisturbed evolution the observed galaxies’ average colours. Model masses were chosen as to yield the average B-band luminosities observed for Sa, Sb, Sc and Sd galaxies (see Paper I, Sect. 2.1). Observed undisturbed local galaxies show 1 ranges around those mean luminosities that need to be considered in the comparison between observations and models. Very important to note is that on all the plots of EW(H), luminosities, and colours as a function of redshift the models evolve from the right-hand high redshift side towards the left-hand low redshift side in contrast to all the time evolution plots shown in Paper I.
Boxes indicate the mean values with 1 ranges of the observational data in our sample. Shown are those models that have the maximum and minimum values of the grid and have their H-strong phase in the given redshift range. We also show the undisturbed Sa and Sd models for comparison.
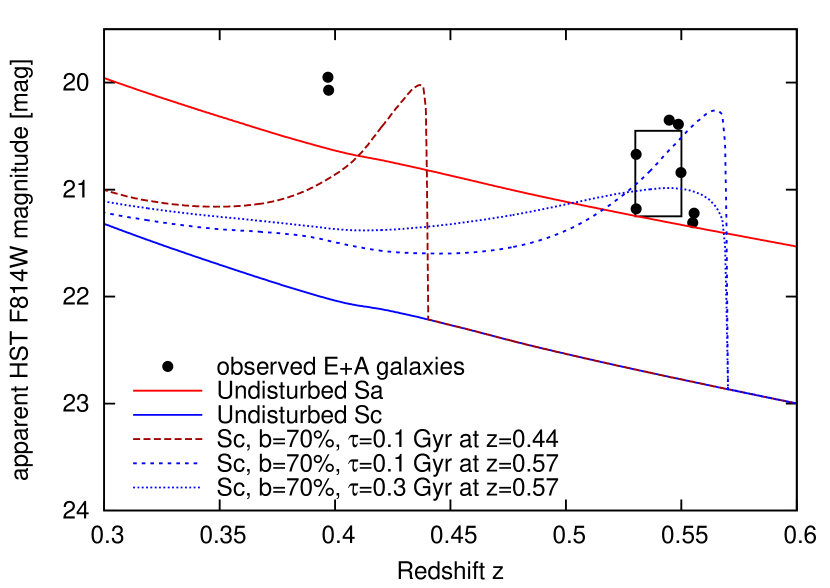
At the top of Fig. 9, WFPC2 I-band luminosity is plotted versus redshift. The Sc galaxy with a burst of 70% and a decline time of 0.1 Gyr at has a luminosity, that matches quite well the two observed E+A galaxies at a redshift of (all models with onset do so). Remember that the luminosities given in all plots are representing the average luminosity for each particular galaxy type, while true galaxies span a range in luminosities (see Tab. 2). Furthermore in the case of galaxies with bursts, those are induced by merging two galaxies, increasing the effective mass and hence luminosity by a factor of 2, corresponding to a magnitude difference of mag. Magnitudes of E+A galaxies at can be reproduced by earlier bursts. We show two examples of galaxies starting as Sc galaxies and encountering strong bursts of 70% with decline times of 0.1 and 0.3 Gyr. Both very well match the average i-band magnitudes observed at .
We also show for comparison the magnitude evolution of the undisturbed Sa and Sd models. The Sd is too faint by several magnitudes. The Sa-type model, however, is found to have approximately the right luminosity to match the observations. However, as we have shown in Paper I, Sa-type galaxies do not become H strong enough to be considered E+A galaxies, since they are lacking the gas reservoir to form a sufficient amount of new stars. Minor mergers of one early-type spiral and one late-type spiral could be a way to increase the gas-reservoir and turn early-type spirals into E+As. The detailed modelling of the range of possible unequal-type mergers, however, is beyond the scope of the present paper.
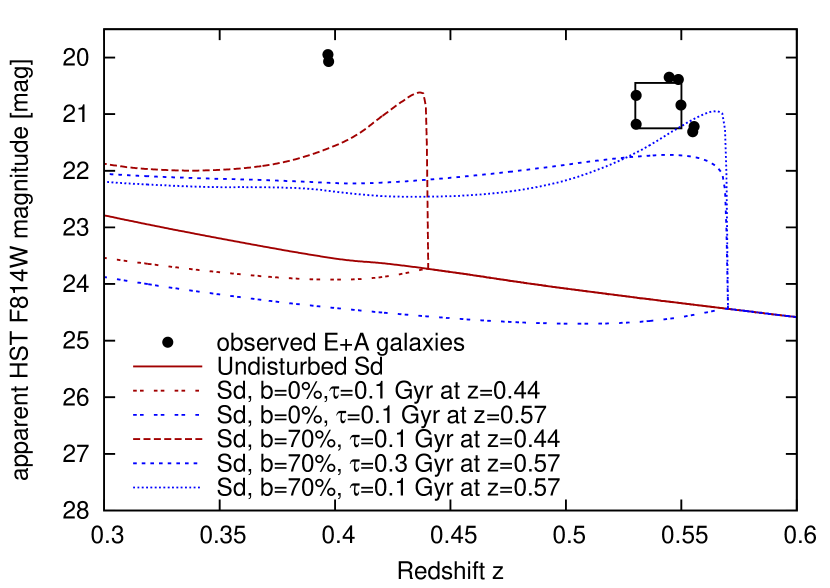
In the bottom panel of Fig. 9 we compare bursts occuring in previously undisturbed Sd-type galaxies. Bursts start either at or and convert 70% of the then available gas mass into stars; decline times shown are 0.1 and 0.3 Gyr. We manage to reproduce the luminosities of all E+A galaxies if we also account for the doubling of mass during the merger. Truncation scenarios, here shown for Gyr and two different onset redshifts, however, are significantly too faint to match the observations.
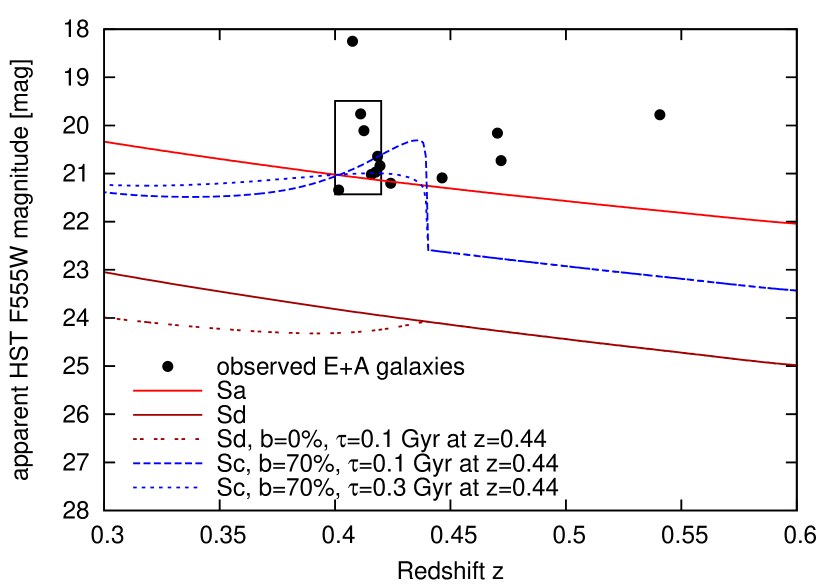
In Fig. 10 we show the HST F555W ( V) band magnitudes of all galaxies observed in this filter. Again we find that bursts of Sc galaxies with short decline times match the observations. Galaxies at higher redshifts can be explained by slightly earlier bursts with onset redshifts of . The only exception is one extremely bright galaxy with mag or mag using a distance modulus of (Galaxy #18 of cluster CL0939+4713 in the catalog of Dressler et al. (1999) and # 224 in catalog of Smail et al. (1997)). This can only be explained by a massive merger of two above-average massive galaxies, or a complex merger of more than two galaxies, possibly a small, infalling group. Further evidence for this scenario is the complex shape (see Fig. 11) showing significant substructure with multiple (tidal) tails as well as several nearby companion galaxies. However, on the basis of currently available data we are not able to make more definite statements on the nature of this galaxy.
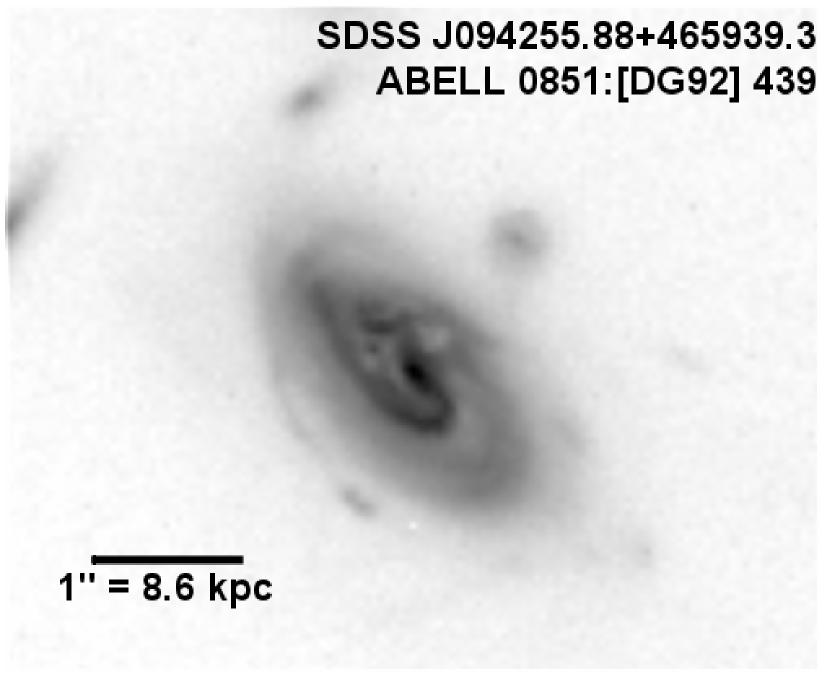
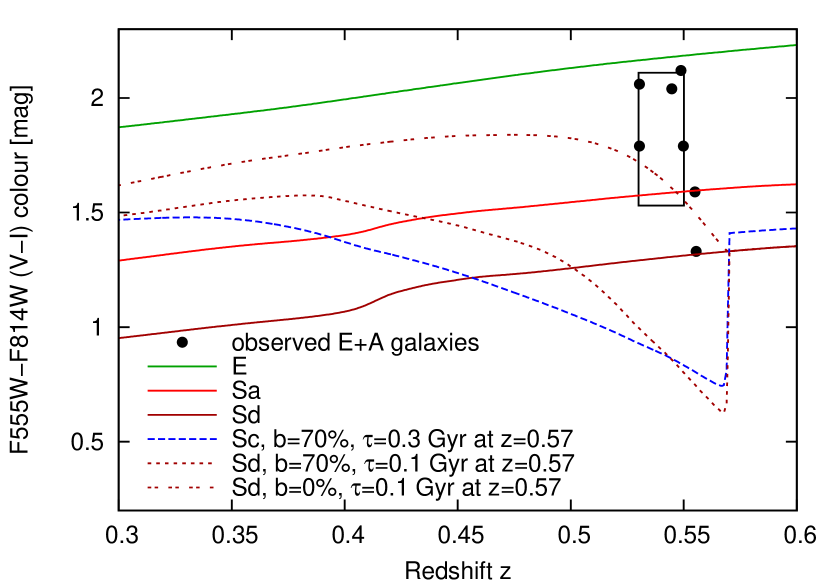
Fig. 12 shows the HST F555WF814W ( VI) colour. We only show some examples for scenarios with burst beginning at redshift , because all observed galaxies lie at . The majority of the data points can be explained with these models. However, for some observed galaxies with red VI colours, an even earlier onset at has to be considered.
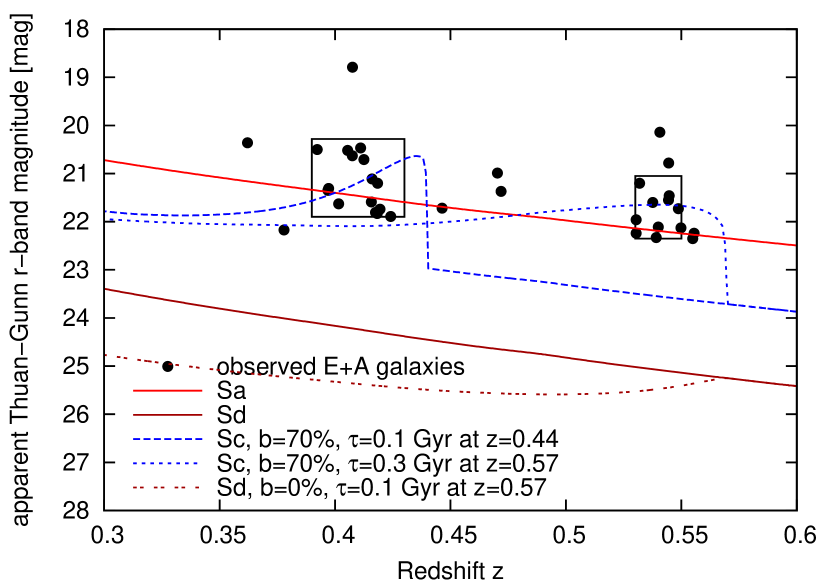
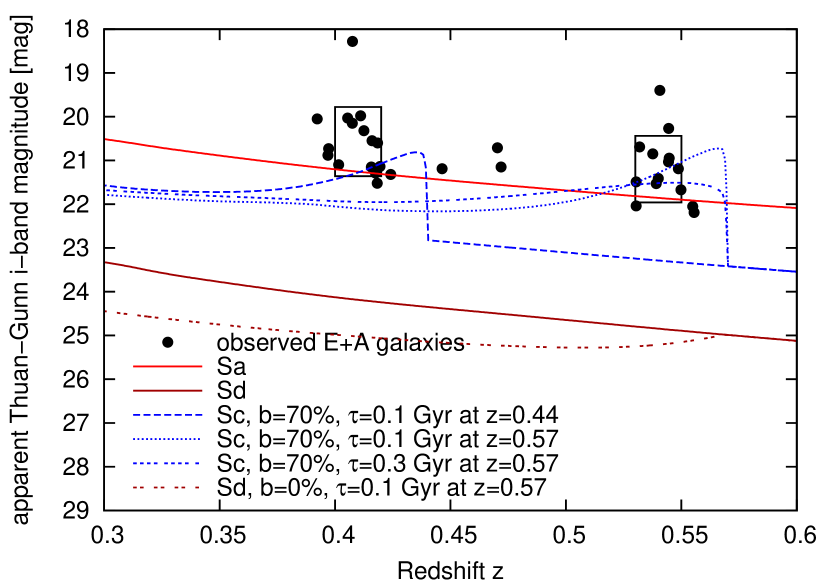
In the top panel of Fig. 13 the r-band luminosity in the Thuan & Gunn system is plotted versus redshift. All galaxies at z and z can be described by our models with strong bursts and decline times of 0.1 Gyr and 0.3 Gyr. The truncated Sd model is found to be too faint, in agreement with our findings for the HST filters above.
The bottom panel of Fig. 13 shows the Thuan-Gunn i-band magnitude of all E+A galaxies. As found already for the g-band magnitudes we can reproduce the full spectrum of observed magnitudes. An important finding is that galaxies which encounter a burst at redshift z are still bright enough to fit the data for those E+As at z when we account for the 0.75 mag increase due to the doubling of mass in the merger.
In both panels of Fig. 13 we also show the evolution of undisturbed Sa and Sd-type galaxies. Although the Sa-type model reproduces the required luminosities, both are not in an E+A phase at their particular age. Likewise in both plots we have one significant outlier at too bright magnitudes. This is the galaxy we have already discussed above.
Summarising our discussion of model magnitudes as compared to observations we can conclude that many models can already be excluded on basis of magnitudes in individual filters alone. Burst models in general reach the observed bright magnitudes, while models with SF truncation without previous starburst are too faint to match the observations.
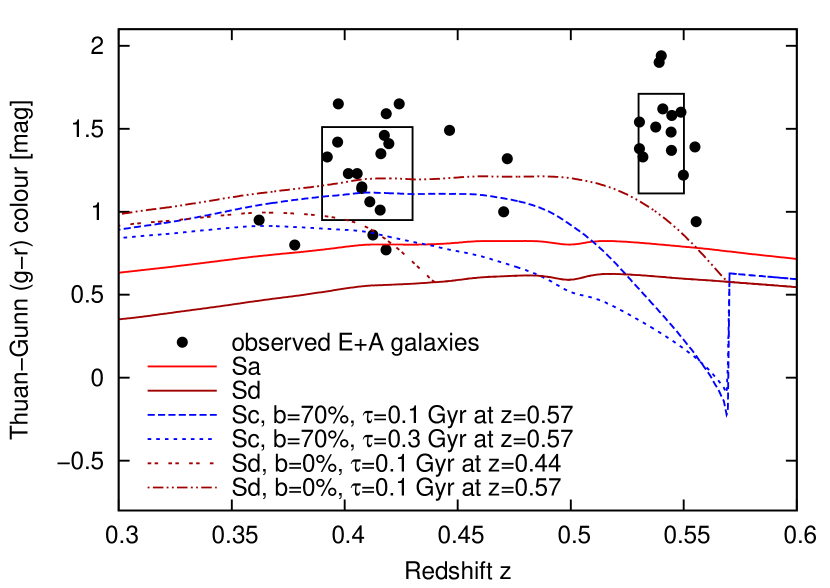
Fig. 14 shows the gr colour versus redshift. During and shortly after the burst our models are too blue to match the observations. However, models with strong bursts occuring at redshift z reach the red colours observed in E+A galaxies at redshift z . This is a very important result, since the time between those redshifts accounts to Gyr ( Gyr and Gyr). After this time the SFR has declined sufficiently to not show up in the [O II] lines anymore while EW(H) reaches a maximum. We can hence fully reproduce all four factors determining E+A galaxies at those redshifts: 1) strong absorption in H; 2) no emission in [O II]; 3) red colours 4) high luminosities.
Galaxies observed in their E+A phase at redshift z can be described by earlier bursts occuring at .
Furthermore, only models with short decline times of Gyr match the luminosities and colours, confirming our results based on the EW([O ii]) described earlier. It seems that the constraints from luminosities and colours provide very valuable complementary information to the studies of absorption lines and allow to discriminate between possible and impossible scenarios. This proves that the comparison of observed and model SEDs introduced in Sect. 3 is a good method to find adequate models for the observations.
4.6 Comparison of Observed SEDs with Model SEDs
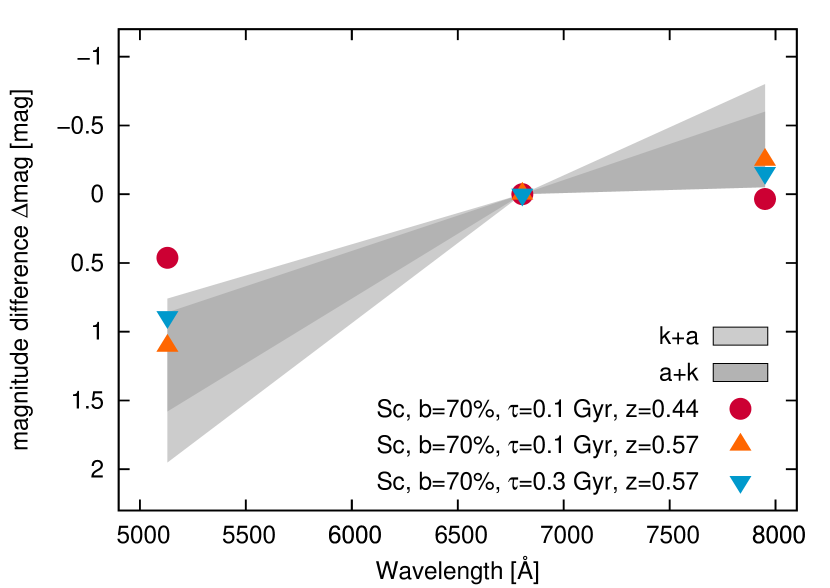
In the following we will compare the full model SEDs to the observed SEDs. Since we have found earlier that our model magnitudes match the average observed magnitudes for the E+A galaxies, we normalize all SEDs to a r-band magnitude of 0, so that our SEDs essentially consist of the g-r and i-r colours. We do not show the HST magnitudes, since the majority of galaxies in the MORPHS catalog were only measured in the Thuan-Gunn system. Fig. 15 shows the observed colour range of all a+k and k+a galaxies as grey-shaded areas. In the top panel of this Fig. we also show three different model-SEDs based on Sc-type progenitor galaxies for redshift . In accordance with our analysis of the individual colours we find that the model with burst at is still too blue to explain the observations. Models with earlier bursts at lie within the observed colour range, with the shorter burst-duration of Gyr providing a better match than the model with the slightly longer duration of Gyr.
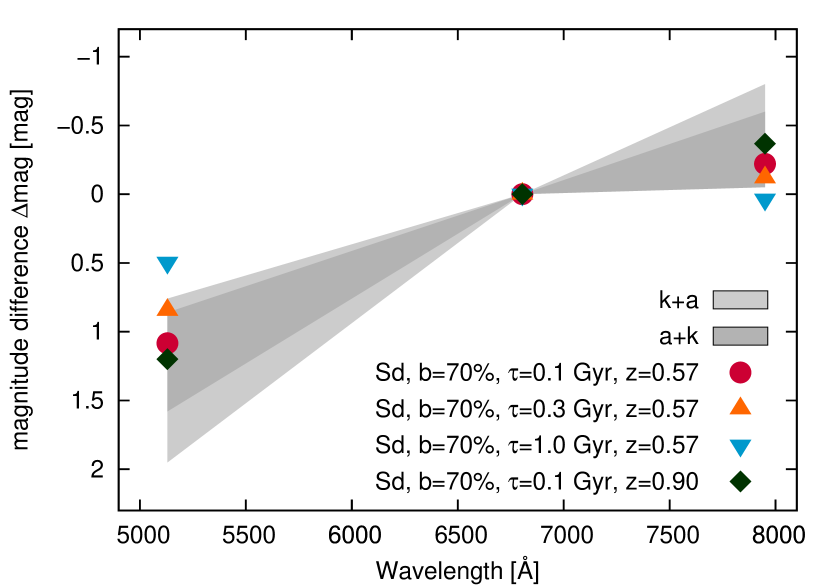
The lower panel of Fig. 15 compares the observed data with Sd-progenitor models. Both models with burst redshift of and burst durations Gyr lie within the observed range. The model with the longer burst duration of 1 Gyr is still too blue at redshift for which the SEDs are shown. For comparison we also show an SED of an earlier burst at . Although this matches the observed SED quite well, the galaxy model is no longer in an E+A phase at the observed redshift , so that this model can be excluded as well.
5 Where does the remaining gas go?
One question remains yet untouched: The fate of the remaining gas that was not converted into stars during the burst. In the following we will show that the energy input by supernovae is sufficient to remove this gas. Integration of an Salpeter IMF with mass-limits of 0.1 and 100 yields that of the gas-mass is converted into stars with , that end their life as core-collapse supernovae. We will base our example on a burst-model starting as Sc-type model with total mass of and encountering a strong (70 %) burst at an age of Gyr. This burst forms a total stellar mass of . We further assume a typical mass of for stars with and that each resulting supernova produces a total energy of erg (Burrows et al., 1995; Hamuy, 2003). All supernovae formed during the burst hence produce a energy output of erg. To derive the potential energy needed to remove the remaining gas we use the total mass of the galaxy and assume a typical radius of . This result in a binding energy of erg, or 14% of the energy produced by the supernovae. This fraction is in good agreement with earlier results of (Thornton et al., 1998) and (Cole et al., 1994).
6 Summary and Outlook
Following the first part of our study presented in Paper I we present Spectral Energy Distributions for yet undisturbed, pre-starburst galaxies, galaxies with ongoind starbursts and post-starburst galaxies. We showed that comparing the SEDs of post-starburst galaxies to those of undisturbed spiral, S0 and E galaxies as well as among each other is a sufficient method to select and investigate post-starburst galaxies. The interplay between the burst strength, the decline time, the onset of the burst/halting of SF and the progenitor galaxy type shapes the SED in the following way:
-
1.
The later the progenitor galaxy type, the more obvious is the difference between the SED in the post-starburst phase to the SED of the corresponding undisturbed galaxy model. Late-type spirals furthermore evolve more slowly towards S0 spectral types than early-type spirals.
-
2.
The earlier the onset of the burst the more luminous is the model SED in its starburst and post-starburst phases.
-
3.
The higher the burst strength, the more luminous is the model SED throughout its starburst and post-starburst phase.
-
4.
The longer the decline time, the longer takes the time evolution of luminosities and colours of the SED to evolve first into the SED of a post-starburst galaxy and later into the SED of an S0 galaxy.
We have shown that we are able to distinguish E+A galaxies, post-starburst galaxies in an early phase after a burst with still measurable [O ii] lines, and even post-starburst galaxies with weak H-lines from undisturbed galaxies and, to a certain limit, from each other by carefully comparing their SEDs.
The advantage of this method is that only photometric observations have to be made and no line measurements are necessary. Post-starburst galaxies with emission lines, which are excluded by the classical E+A definition can be detected and interpreted, as well as post-starburst galaxies for which the burst was not strong enough to produce strong H-lines with EW(H) 5 Å. It is possible to distinguish between most of the models i.e., we can identify the progenitor galaxy type and estimate the burst strength. This means we can investigate the full range of post-starburst galaxies without the selection effect which excludes a number of post-starburst galaxies from the E+A class (see Paper I, ).
The most important bands crucial for this SED analysis are U, B and V, while it is sufficient to have only one band in the NIR. Our model spectra in Paper I indicate that SEDs with additional filters in the UV, e.g. from GALEX, would reveal even more subtle differences among the SEDs of different types of post-starburst galaxies.
In the second part of this paper we compared our model results to the MORPHS catalog containing 88 E+A galaxies in the redshift range z=0.360.56. We constructed a grid of models spanning a wide range of progenitor galaxies, burst redshifts, burst decline times and burst strengths. All our models fully include both cosmological and evolutionary corrections as function of redshift and galaxy type.
We find that k+a galaxies are redder than a+k galaxies with higher EW(H). This is in good agreement with our models which show that galaxies with high EW(H) can only have blue colours while galaxies with low EW(H) can either be still blue or already red.
From our comparison of model and observational data, we find that only galaxies with strong bursts and relatively short decline times Myr can explain the observed colours and magnitudes. This is in good agreement with earlier studies (Poggianti & Barbaro, 1996; Balogh et al., 1997, 2005; Yan et al., 2008) which also found indications for recent bursts forming a significant fraction of the observed stellar masses. Weaker bursts do not reach the required H strengths, while models with SF truncation instead of a starburst are significantly too faint, confirming earlier findings from Christlein & Zabludoff (2004) who found that simple fading without an increase of the bulge luminosity does not reproduce observations of S0 galaxies.
We hence conclude that a large fraction of the parameter space can easily be excluded based on SEDs alone. This is remarkable since our SEDs only consist of three filters and only cover a short wavelength range of the spectrum.
We could also show that supernovae being formed as a consequence of the burst can produce enough energy to remove the remaining gas that was not turned into stars from the galaxy, explaining why most observed E+A galaxies do not contain significant amounts of cool gas.
The predictions from our models can be used to collect more and better data for the SEDs of post-starburst galaxies. With better sampled SEDs, in particular with UV filters and one NIR band included, and a suitable SED fitting tool (e.g. AnalySED (Anders et al., 2004) or GAZELLE (Kotulla & Fritze, in preparation)) it will become possible to improve the method outline here and to better constrain not only progenitor galaxies and transformation scenarios, but also limit the range of possible burst ages and burst fractions.
Investigating SEDs of all post-starburst galaxies promises to lead to a better understanding of the transformation processes of galaxies in high density environments.
Acknowledgments
We thank our referee, Guy Worthey, for his patience and very insightful, helpful and encouraging comments that greatly helped us to improve this paper.
References
- Anders et al. (2004) Anders, P., Bissantz, N., Fritze, U., & de Grijs, R. 2004, MNRAS, 347, 196
- Anders & Fritze (2003) Anders, P. & Fritze, U. 2003, A&A, 401, 1063
- Balogh et al. (2005) Balogh, M. L., Miller, C., Nichol, R., Zabludoff, A., & Goto, T. 2005, MNRAS, 360, 587
- Balogh et al. (1997) Balogh, M. L., Morris, S. L., Yee, H. K. C., Carlberg, R. G., & Ellingson, E. 1997, ApJ, 488, L75+
- Balogh et al. (1999) Balogh, M. L., Morris, S. L., Yee, H. K. C., Carlberg, R. G., & Ellingson, E. 1999, ApJ, 527, 54
- Barger et al. (1996) Barger, A. J., Aragon-Salamanca, A., Ellis, R. S., et al. 1996, MNRAS, 279, 1
- Barnes & Hernquist (1996) Barnes, J. E. & Hernquist, L. 1996, ApJ, 471, 115
- Barr et al. (2007) Barr, J. M., Bedregal, A. G., Aragón-Salamanca, A., Merrifield, M. R., & Bamford, S. P. 2007, A&A, 470, 173
- Bertelli et al. (1994) Bertelli, G., Bressan, A., Chiosi, C., Fagotto, F., & Nasi, E. 1994, A&AS, 106, 275
- Bessell & Brett (1988) Bessell, M. S. & Brett, J. M. 1988, PASP, 100, 1134
- Bicker et al. (2003) Bicker, J., Fritze, U., & Fricke, K. J. 2003, Ap&SS, 284, 463
- Bicker et al. (2004) Bicker, J., Fritze, U., Möller, C. S., & Fricke, K. J. 2004, A&A, 413, 37
- Burrows et al. (1995) Burrows, A., Hayes, J., & Fryxell, B. A. 1995, ApJ, 450, 830
- Butcher & Oemler (1978) Butcher, H. & Oemler, Jr., A. 1978, ApJ, 226, 559
- Butcher & Oemler (1984) Butcher, H. & Oemler, Jr., A. 1984, ApJ, 285, 426
- Christlein & Zabludoff (2004) Christlein, D. & Zabludoff, A. I. 2004, ApJ, 616, 192
- Cole et al. (1994) Cole, S., Aragon-Salamanca, A., Frenk, C. S., Navarro, J. F., & Zepf, S. E. 1994, MNRAS, 271, 781
- De Lucia et al. (2004) De Lucia, G., Poggianti, B. M., Aragón-Salamanca, A., et al. 2004, ApJ, 610, L77
- Dressler (1980) Dressler, A. 1980, ApJ, 236, 351
- Dressler & Gunn (1992) Dressler, A. & Gunn, J. E. 1992, ApJS, 78, 1
- Dressler et al. (1997) Dressler, A., Oemler, A. J., Couch, W. J., et al. 1997, ApJ, 490, 577
- Dressler et al. (2004) Dressler, A., Oemler, A. J., Poggianti, B. M., et al. 2004, ApJ, 617, 867
- Dressler et al. (2008) Dressler, A., Rigby, J., Oemler, Jr., A., et al. 2008, ArXiv:0806.2343
- Dressler et al. (1999) Dressler, A., Smail, I., Poggianti, B. M., et al. 1999, ApJS, 122, 51
- Falkenberg & Fritze (2009) Falkenberg, M. & Fritze, U. 2009, ArXiv:0901.1665
- Goto (2004) Goto, T. 2004, A&A, 427, 125
- Hamuy (2003) Hamuy, M. 2003, ApJ, 582, 905
- Kawata & Mulchaey (2008) Kawata, D. & Mulchaey, J. S. 2008, ApJ, 672, L103
- Kodama & Bower (2001) Kodama, T. & Bower, R. G. 2001, MNRAS, 321, 18
- Kotulla et al. (2009) Kotulla, R., Fritze, U., Weilbacher, P., & Anders, P. 2009, MNRAS, in press (ArXiv:0903.0378)
- Lake et al. (1998) Lake, G., Katz, N., & Moore, B. 1998, ApJ, 495, 152
- Lejeune et al. (1997) Lejeune, T., Cuisinier, F., & Buser, R. 1997, A&AS, 125, 229
- Lejeune et al. (1998) Lejeune, T., Cuisinier, F., & Buser, R. 1998, A&AS, 130, 65
- Leonardi & Rose (1996) Leonardi, A. J. & Rose, J. A. 1996, AJ, 111, 182
- Miller & Owen (2001) Miller, N. A. & Owen, F. N. 2001, ApJ, 554, L25
- Moore et al. (1996) Moore, B., Katz, N., Lake, G., Dressler, A., & Oemler, A. 1996, Nature, 379, 613
- Moore et al. (1998) Moore, B., Lake, G., & Katz, N. 1998, ApJ, 495, 139
- Moran et al. (2006) Moran, S. M., Ellis, R. S., Treu, T., et al. 2006, ApJ, 641, L97
- Moran et al. (2007) Moran, S. M., Miller, N., Treu, T., Ellis, R. S., & Smith, G. P. 2007, ApJ, 659, 1138
- Oemler (1999) Oemler, Jr., A. 1999, in Astronomical Society of the Pacific Conference Series, Vol. 193, The Hy-Redshift Universe: Galaxy Formation and Evolution at High Redshift, ed. A. J. Bunker & W. J. M. van Breugel, 281–+
- Oemler (1974) Oemler, A. J. 1974, ApJ, 194, 1
- Poggianti (2004a) Poggianti, B. 2004a, in Baryons in Dark Matter Halos, ed. R. Dettmar, U. Klein, & P. Salucci
- Poggianti (2004b) Poggianti, B. M. 2004b, in Clusters of Galaxies: Probes of Cosmological Structure and Galaxy Evolution, ed. J. S. Mulchaey, A. Dressler, & A. Oemler, 245–+
- Poggianti et al. (2008) Poggianti, B. M., Aragon-Salamanca, A., Zaritsky, D., et al. 2008, ArXiv:
- Poggianti & Barbaro (1996) Poggianti, B. M. & Barbaro, G. 1996, A&A, 314, 379
- Poggianti et al. (1999) Poggianti, B. M., Smail, I., Dressler, A., et al. 1999, ApJ, 518, 576
- Salpeter (1955) Salpeter, E. E. 1955, ApJ, 121, 161
- Sandage et al. (1985a) Sandage, A., Binggeli, B., & Tammann, G. A. 1985a, AJ, 90, 1759
- Sandage et al. (1985b) Sandage, A., Binggeli, B., & Tammann, G. A. 1985b, AJ, 90, 395
- Shioya et al. (2001) Shioya, Y., Bekki, K., & Couch, W. J. 2001, ApJ, 558, 42
- Smail et al. (1997) Smail, I., Dressler, A., Couch, W. J., et al. 1997, ApJS, 110, 213
- Spergel et al. (2007) Spergel, D. N., Bean, R., Doré, O., et al. 2007, ApJS, 170, 377
- Thornton et al. (1998) Thornton, K., Gaudlitz, M., Janka, H.-T., & Steinmetz, M. 1998, ApJ, 500, 95
- Thuan & Gunn (1976) Thuan, T. X. & Gunn, J. E. 1976, PASP, 88, 543
- Trager et al. (1998) Trager, S. C., Worthey, G., Faber, S. M., Burstein, D., & Gonzalez, J. J. 1998, ApJS, 116, 1
- Treu et al. (2003) Treu, T., Ellis, R. S., Kneib, J.-P., et al. 2003, ApJ, 591, 53
- Yan et al. (2008) Yan, R., Newman, J. A., Faber, S. M., et al. 2008, ArXiv:0805.0004
- Yang et al. (2004) Yang, Y., Zabludoff, A. I., Zaritsky, D., Lauer, T. R., & Mihos, J. C. 2004, ApJ, 607, 258