Origin of the structural phase transition at 130 K in BaNi2As2: a combined study of optical spectroscopy and band structure calculations
Abstract
BaNi2As2 exhibits a first order structural transition at 130 K. Understanding this structural transition is a crucial step towards understanding the electronic properties of the material. We present a combined optical spectroscopy and band structure calculation study on the compound across the transition. The study reveals that BaNi2As2 is a good metal with a rather high plasma frequency. The phase transition leads to a small reduction of conducting carriers. We identify that this reduction is caused by the removal of several small Fermi surface sheets contributed dominantly from the As-As bonding and Ni-As antibonding.
pacs:
74.25.Gz, 74.25.Jb, 74.70.-bThe discoveries of superconductivity in Fe- or Ni-based layered pnictide compoundsKamihara06 ; Watanabe ; Kamihara08 have generated tremendous interest in condensed matter community. For the iron arsenic-based compounds, not only could they have high superconducting transition temperaturesChenXH ; Chen1 ; Ren1 but also show intriguing interplay between structure, magnetism and superconductivity. The undoped compounds commonly display the structural and magnetic phase transitions, which, depending on materials, could occur either at the same temperature or separatelyCruz ; Rotter2 ; Chu ; Chen2 . Upon electron or hole doping or application of pressure, both the magnetic order and the structural transition are suppressed, and superconductivity emergesJZhao ; Rotter2 ; Torikachvili . Intensive studies have been done to elucidate the origin of the structural/magnetic transitions and their relation to superconductivity. The magnetic transitions were identified as itinerant spin-density-wave (SDW) instabilities caused largely by the strong nesting tendency between the hole and electron Fermi surfacesDong ; Singh , though conflicting views from a local superexchange picture also exist. The structural phase transition was widely believed to be driven by the magnetic transitionYildirim ; FangXu .
Compared with the FeAs-based compounds, the NiAs-based systems were much less studied. Superconductivity in Ni-pnictides has been found in quaternary ZrCuSiAs structure type LaNiPO (Tc=4 K)Watanabe , LaNiAsO (Tc=2.7 K)Li and ThCr2Si2 structure type ANi2As2 (A=Ba, Sr) (Tc=0.60.7 K)Ronning ; Bauer ; Sefat . Although the Ni-pnictide superconductors share the same Ni2As2 PbO-type structure as Fe-pnictides, the superconducting transition temperatures are much lower, never exceeds 5 K even upon dopingLi . Nevertheless, a first order phase transition at Ts=130 K, much similar to the AFe2As2 (A=Ca, Sr, Ba), is found for BaNi2As2 compoundRonning ; Sefat . Initially, by analogy with FeAs-based 122 compounds, the transition was considered as a magnetic SDW transition concomitant with the a structural transitionRonning . However, to date no evidence for magnetic transition was reported. Much remain unknown about this transition. It is highly interesting to study the origin of the first order phase transition and compare with their FeAs analogies.
In this work we report the first optical spectroscopy study on BaNi2As2 single crystals. The study reveals remarkable differences between BaNi2As2 and BaFe2As2. In accord with the presence of two more electrons in 3d orbitals, the BaNi2As2 shows a much higher plasma frequency (or carrier density). By lowering the temperature across the transition, part of the spectral weight from conducting electrons was removed and shifted to high energies. However, unlike the case of BaFe2As2, where an SDW gap opens at low frequenciesHu , the spectral weight redistribution for BaNi2As2 occurs over a much broader energy scale. The study reveals that the first order phase transition in BaNi2As2 is essentially different from the SDW type phase transition as observed in BaFe2As2, thus against the presence of competing phase such as magnetic SDW order in Ni-pnictides. To understand the spectral change across the transition, we performed first-principle calculations of the band structure. We illustrate that the transition is mainly caused by the removal of several small Fermi surface sheets with dominant As-As bonding and Ni-As anitbonding character. The other orbitals/bands are less affected and remains conductive.
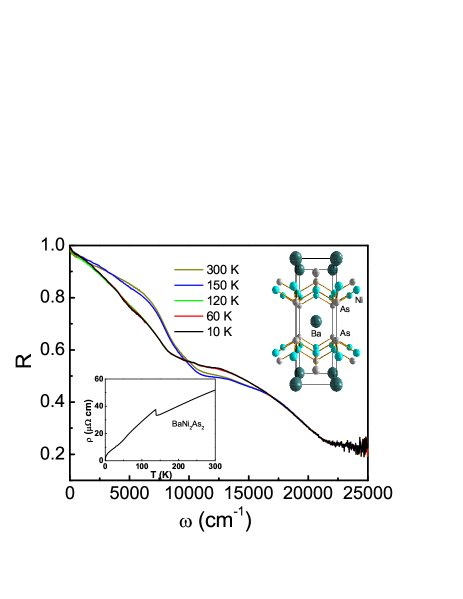
Single crystals of BaNi2As2 were grown using Pb-flux method similar to the procedure described by Ronning et al.Ronning , except that we use a much slowly cooling rate of 3.5 oC from 1100 oC to 650 oC. The Pb flux were removed by using a centrifuge at 650 oC. Resistivity measurement, as shown in the inset of Fig. 1, indicates metallic behavior with a small resistivity value of about 50 at 300 K. The resistivity shows a jump at 130 K on cooling, then becomes more metallic at low temperature, similar to the case of CaFe2As2. Finally, BaNi2As2 enters into superconducting state at 0.65 K. All those are in good agreement with previous reports in literatureRonning ; Sefat .
The optical reflectance measurements were performed on a combination of Bruker IFS 66v/s and 113v on newly cleaved surfaces (ab-plane) of those crystals up to 25000 cm-1. An in situ gold and aluminium overcoating technique was used to get the reflectivity R(). The real part of conductivity is obtained by the Kramers-Kronig transformation of R().
Figure 1 shows the experimental reflectance spectra up to 25000 cm-1 . A rather good metallic response is observed. R() approaches to unity at zero frequency, and shows a plasma edge-like shape near 10000 cm-1 . Note that this edge frequency is substantially higher than that in BaFe2As2, which is seen around only 3000 cm-1 where it merges into the relatively high values of mid-infrared reflectance contributed mainly by the interband transitionsHu . This gives direct evidence that the conducting carrier density in BaNi2As2 is much higher than that in BaFe2As2. A quantitative estimation of the plasma frequency will be given below. There is only a minor change in R() as temperature decreases from 300 K to 150 K. However, by cooling across the phase transition at 130 K, R() shows a dramatic change. Except for the reflectance at very low frequency, R() is suppressed significantly below the reflectance edge, but enhanced in the frequency range of 9000 to 16000 cm-1 . With further decreasing temperature, the spectral change becomes very small. The very low frequency R() increases slightly, reflecting enhanced metallic dc conductivity. In the mean time, a weak suppression in the mid-infrared region near 5000 cm-1 could be resolved.
The above mentioned spectral change in R() across the transition is very different from BaFe2As2 which shows an SDW order concomitant with the a structural transition occurs at 140 K. For BaFe2As2, the most prominent spectral change is a substantial suppression in R() at low frequency, roughly below 1000 cm-1 , which is ascribed to the opening of an SDW gap in the magnetic ordered stateHu . In BaNi2As2, the spectral change occurs over a much broader frequency range. Besides the week suppression near 5000 cm-1 , there is no additional spectral suppression at lower energies.
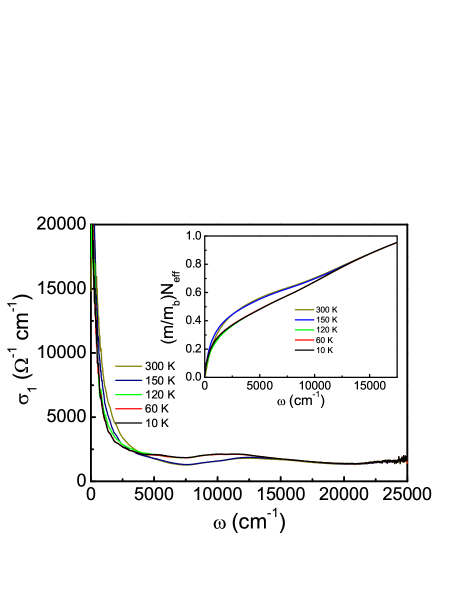
Figure 2 shows the conductivity spectra ) up to 25000 cm-1 . The Drude-like conductivity can be observed for all spectra at low frequencies. When temperature drops below 130 K, part of the spectral weight transferred from below 7000 cm-1 to higher energies. The effective carrier density per Ni site below a certain energy can be obtained by the partial sum rule
| (1) |
where m is the free-electron mass, mb the averaged high-frequency optical or band mass, a unit cell volume, N the number of Ni ions per unit volume. The inset of Fig. 2 shows as a function of frequency for different temperatures. We find that the spectral weight recovered roughly near 12000 cm-1 . is related to an overall plasma frequency, after choosing a proper high-frequency limit , via the relationship . Choosing 7500 cm-1 , a frequency where reaches its minimum but below the interband transition, we get the overall plasma frequency 3.49 cm-1 for T=300 K and 150 K. If we choose the same cutoff frequency at 7500 cm-1 , we get 3.33 cm-1 for T=10, 60 and 120 K. However,it should be noted that the conductivity spectra already show a week peak feature near 5000 cm-1 , this results in an overestimate of the plasma frequency at low temperatures. Note that the plasma frequency for BaFe2As2 is only around 1.3 cm-1 in the nonmetallic phaseHu , so BaNi2As2 has much higher plasma frequency. This is in accord with the presence of two more electrons in 3d orbitals.
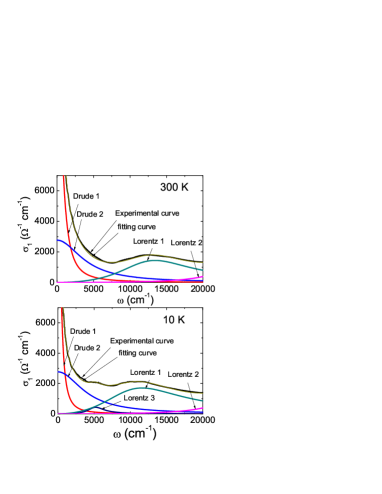
An alternative way of making quantitative analysis is to fit the conductivity spectra by a Drude-Lorentz model to isolate the different components of the electronic excitationsHu . The Drude component represents the contribution from conduction electrons, while the Lorentz components describe the interband transitions. Usually a single Drude term is used to extract the conduction electron contribution, but here we found that two Drude components could reproduce the low-frequency conductivity much better. This could be naturally accounted for by the multiple-band characteristic of the material. The general formula for the Drude-Lorentz model is
| (2) |
where and are the plasma frequency and the relaxation rate of each conduction band, while , , and are the resonance frequency, the damping, and the mode strength of each Lorentz oscillator, respectively. It is found that the conductivity curve above the phase transition could be well reproduced by a two Drude components and two Lorentz oscillators. Below the transition temperature, an additional Lorentz oscillator is required to fit the curve. Figure 3 shows the spectra and fitting curves at two representative temperatures 300 K and 10 K. The parameters for the two Drude components are summarized in Table 1 for different temperatures. The overall plasma frequency is obtained as =. We find that the values are roughly in agreement with those obtained by the sum-rule analysis.
We can now summarize our main findings from the optical data. BaNi2As2 has a much higher plasma frequency than BaFe2As2. By lowering the temperature across the transition, part of the spectral weight from conducting electrons was removed and shifted to high energies. There is a small peak near 5000 cm-1 , but its spectral weight could not compensate for the loss of the low-frequency Drude component, the spectral weight loss is recovered at a much higher energy scale. The spectral change across the transition is very different from the situation of BaFe2As2, where an SDW gap opens at low frequencies, roughly below 1000 cm-1 .Hu
The key issue here is the origin of the first order phase transition in BaNi2As2. As mentioned, a magnetic SDW transition concomitant with a structural transition was initially suggested only by analogy with FeAs-based 122 compounds. However, to date no evidence for magnetic transition was reported. Furthermore, the band structure calculations reveal that the Fermi surfaces of BaNi2As2 are markedly different from that of FeAs-based 122 compounds, the disconnected FS becomes much large in BaNi2As2Subedi ; Shein , and no nesting of the Fermi surfaces could be identified. One would not expect the phase transitions in these two systems have the same origin. Very recently, the crystal structure after the transition was determined. It is found that BaNi2As2 experiences a structural phase transition from a high-T tetragonal phase to a low-T triclinic phase. Examining carefully the bondings between atoms, we find that the As-As distance along the c-axis increases from 3.5531 to 3.5838 , while within ab-plane, the Ni ions change from a square lattice to zigzag chains where short Ni-Ni bonds () are separated by longer Ni-Ni distances()Sefat .
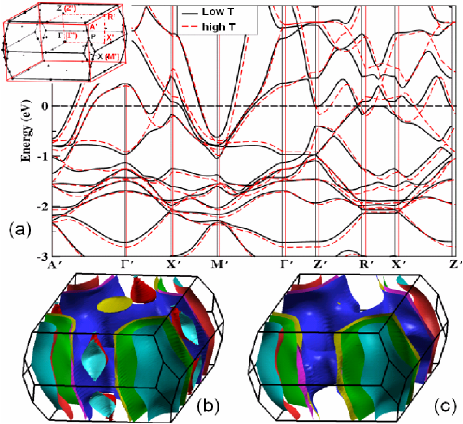
For the ThCr2Si2-type transition metal-based compounds AM2X2, three different types of bondings, M-X, M-M, and X-X, and their contributions to different bands in the electronic structure were well studied.Hoffmann ; Johrendt It is found that two dispersive bands which cross the EF lightly and have mainly the X-X bonding (X-X ) and M-X anitbonding (M-X ) character are rather sensitive to the positions of X ions, and show strong electron-phonon coupling effect.Johrendt To see the effect of the lattice distortion on the band structure, we performed LDA band structure calculations for BaNi2As2 using the experimentally determined crystal structures below and above the phase transition as an initial input and then relax the atom positions. We find that the change of the optimized structure from the experimentally determined one is rather small, less than 2 in both atom positions and lattice parameters. A lowering of energy of 6 meV/unit cell is obtained for the distorted structure. The calculated results are presented in Fig. 4. Here, a standard notation of the Brillouin zone for a simple tetragonal lattice is used for illustrating the band dispersions. For comparison reason, we also map the Brillouin zone for the low-T triclinic lattice to the original tetragonal phase. A minor shift in the high symmetry line is due to the lattice parameter difference. We find that most of the dispersive bands keep unchanged except for some small shifts in energy, but the band dispersions close to Fermi level near Z′ point and along R′-X′ direction are dramatically altered. Those bands were dominantly contributed from the As-As bonding and Ni-As anitbonding. In the high-T symmetry phase, those bands cross the EF and lead to a very flat electron type Fermi surface (FS) surrounding Z′ point and eight 3D hole type FS along R-X line (see Fig. 4 (b)). However, in the low-T phase, the FS near Z′ point tends to vanish almost completely, leading to a gap roughly about 0.5 eV. Additionally, the hole type 3D FS along R′-X′ line is completely gone due to the band splitting(Fig. 4 (c)). This splitting has smaller energy scale 0.20.3 eV. This could give the onset of the small mid-infrared peak shown in lower panel of Fig. 3. Compared with the rather big FS sheets by other bands, the areas enclosed by those FSs are rather small, so the reduction of the carrier density below the transition is small, which is also in agreement with the optical measurement results.
We can see that the driving mechanism for the structural phase transition is still electronic. The energy gain through gapping the small FS sheets is not due to the nesting effect of FS, but mainly caused by the removal/instability of several specific bands near EF whose energy levels are particularly sensitive to the direct As-As and Ni-As bondings. Therefore, our combined optical spectroscopy and first principle calculation studies firmly establish that the first-order phase transition in BaNi2As2 is different from that of BaFe2As2.
Acknowledgements.
This work is supported by the National Science Foundation of China, the Chinese Academy of Sciences, and the 973 project of the Ministry of Science and Technology of China.References
- (1) Y. Kamihara, H. Hiramatsu, M. Hirano, R. Kawamura, H. Yanagi, T. Kamiya, and H. Hosono, J. Am. Chem. Soc. 128, 10012 (2006).
- (2) T. Watanabe, H. Yanagi, T. Kamiya, Y. Kamihara, H. Hiramatsu, M. Hirano, and H. Hosono, Inorg. Chem. 46, 7719 (2007)
- (3) Y. Kamihara, T. Watanabe, M. Hirano, and H. Hosono, J. Am. Chem. Soc. 130, 3296 (2008).
- (4) X.H. Chen, T. Wu, G. Wu, R.H. Liu, H. Chen, and D.F. Fang, Nature 453, 761 (2008).
- (5) G.F. Chen, Z. Li, D. Wu, G. Li, W. Z. Hu, J. Dong, P. Zheng, J.L. Luo, and N.L. Wang, Phys. Rev. Lett. 100, 247002 (2008).
- (6) Z.A. Ren, J. Yang, W. Lu, W. Yi, X.L. Shen, Z.C. Li, G.C. Che, X.L. Dong, L.L. Sun, F. Zhou, and Z.X. Zhao, Europhys. Lett. 82, 57002 (2008).
- (7) C. de la Cruz, Q. Huang, J. W. Lynn, J. Li, W. R. Ii, J. L. Zarestky, H. A. Mook, G. F. Chen, J. L. Luo, N. L. Wang, and P. Dai, Nature 453, 899 (2008).
- (8) M. Rotter, M. Tegel, D. Johrendt, Phys. Rev. Lett. 101, 107006 (2008).
- (9) J.H. Chu, J.G. Analytis, C. Kucharczyk, and I.R. Fisher, Phys. Rev. B 79 014506 (2009).
- (10) G. F. Chen, W. Z. Hu, J. L. Luo, and N. L. Wang, arXiv:0902.1100.
- (11) Jun Zhao, Q. Huang, Clarina de la Cruz, Shiliang Li, J. W. Lynn, Y. Chen, M. A. Green, G. F. Chen, G. Li, Z. Li, J. L. Luo, N. L. Wang, Pengcheng Dai, Nature Materials 7, 953 (2008).
- (12) M. S. Torikachvili, S. L. Bud’ko, N. Ni, P. C. Canfield, Phys. Rev. Lett. 101, 057006 (2008).
- (13) J. Dong, H. J. Zhang, G. Xu, Z. Li, G. Li, W. Z. Hu, D. Wu, G. F. Chen, X. Dai, J. L. Luo, Z. Fang, N. L. Wang, Europhys. Lett. 83, 27006 (2008).
- (14) D. J. Singh, arXiv:0901.2149 and references therein.
- (15) T. Yildirim, Phys. Rev. Lett. 101, 057010 (2008).
- (16) C. Fang, H. Yao, W.-F. Tsai, J. P. Hu, S. A. Kivelson, Phys. Rev. B 77, 224509 (2008); C. Xu, M. Mueller, S. Sachdev, Phys. Rev. B 78, 020501(R) (2008).
- (17) Z. Li, G. F. Chen, J. Dong, G. Li, W. Z. Hu, D. Wu, S. K. Su, P. Zheng, T. Xiang, N. L. Wang, J. L. Luo, Phys. Rev. B 78, 060504(R), (2008).
- (18) F. Ronning, N. Kurita, E. D. Bauer, B. L. Scott, T. Park, T. Klimczuk, R. Movshovich, J. D. Thompson, J. Phys. Condens. Matter 20, 342203 (2008).
- (19) E. D. Bauer, F. Ronning, B. L. Scott, J. D. Thompson, Phys. Rev. B 78, 172504 (2008).
- (20) A. S. Sefat, R. Jin, M. A. McGuire, B. C. Sales, D. Mandrus, F. Ronning, E. D. Bauer, Y. Mozharivskyj, Phys. Rev. B 79, 094508 (2009).
- (21) W. Z. Hu, J. Dong, G. Li, Z. Li, P. Zheng, G. F. Chen, J. L. Luo, N. L. Wang, Phys. Rev. Lett. 101, 257005(2008).
- (22) A. Subedi and D. J. Singh, Phys. Rev. B. 78, 132511 (2008).
- (23) I. R. Shei and A. L. Ivanovskii, Phys. Rev. B 79, 054510 (2009).
- (24) R. Hoffmann and C. Zheng, J. Phys. Chem. 89, 4175 (1985).
- (25) D. Johrendt, C. Felser, O. Jepsen, O. K. Andersen, A. Mewis, and J. Rouxel, J. Solid State Chem. 130, 254 (1997).