The Origin of Color Gradients in Early-Type Systems and Their Compactness at High-z
Abstract
In this , we present mean optical+NIR color gradient estimates for early-type galaxies (ETGs) in the wavebands of the Sloan Digital Sky Survey (SDSS) plus UKIRT Infrared Deep Sky Survey (UKIDSS). The color gradient is estimated as the logarithmic slope of the radial color profile in ETGs. With such a large sample size, we study the variation of the mean color gradient as a function of waveband with unprecedented accuracy. We find that (i) color gradients are mainly due, on average, to a metallicity variation of about dex per decade in galaxy radius; and (ii) a small, but significant, positive age gradient is present, on average, in ETGs, with the inner stellar population being slightly younger, by dex per radial decade, than the outer one. Also, we show that the presence of a positive mean age gradient in ETGs, as found in the present study, implies their effective radius to be smaller at high , consistent with observations.
Subject headings:
galaxies: clusters: general—galaxies: evolution—galaxi es: fundamental parameters1. Introduction
Since the early 1970’s, observations have shown that the color of ETGs reddens from the outskirts to the galaxy center (Faber 1972). Understanding the origin of such color gradient can strongly constrain the scenario of galaxy formation and evolution (see La Barbera et al. 2004). Most studies to date have been plagued by the large uncertainties due to small sample sizes and short wavelength baselines where color gradients are derived. Despite these limitations they suggest that color gradients in ETGs originate from metallicity variations (Peletier et al. 1990; Tamura et al. 2000; Tamura & Ohta 2003). Small, positive age gradients are also consistent with observations (e.g. Saglia et al. 2000), though their presence has never been revealed in the family of ETGs as a whole. Positive age gradients are a robust prediction of the hierarchical paradigm of galaxy formation, as a consequence of the centrally peaked star formation of dissipative merging events.
Recent studies have shown a significant, intrinsic evolution of ETG sizes, with high redshift galaxies being more compact (by at ) than those of analogous stellar mass at . The origin of this variation in size is still a matter of debate and may be the result of different mechanisms (see e.g. Trujillo 2009), specifically (i) the effect of minor dry mergers; or (ii) a puffing-up mechanism due to AGN feedback (Fan et al., 2008); or (iii) the increased amount of dissipation involved in gas-rich mergers forming ETGs at high-redshift (Khochfar and Silk, 2006).
In this Letter, we use data from the SDSS and UKIDSS surveys to address the origin of the mean color gradient in ETGs in the nearby Universe (z0.1), connecting it to the observed compactness of their high-redshift counterparts 111We assume a cosmology with = 0.3, = 0.7, and = 75 km .. The combination of sample size, homogeneity of data, and large wavelength baseline, from optical to near-infrared (g through K bands), results in an unprecedented accuracy in detecting both metallicity and age variations inside galaxies. In fact, while optical (SDSS) data are very sensitive to the effects of both metallicity (through line blanketing) and age, the NIR (UKIDSS) wavebands are dominated by the old, quiescent stellar populations, allowing the effects of age and metallicity to be effectively separated (see e.g. Peletier et al. 1990).
2. The sample
The sample of ETGs was defined from SDSS-DR6 with photometry and spectroscopy available. We selected all galaxies in the redshift range of 0.05 to 0.095, with r-band Petrosian magnitude 222 k-corrected with (Blanton et al., 2003) through rest-frame filters blue-shifted by a factor , adopting (see e.g. Hogg et al. 2004). M. The choice of the lower redshift minimizes the aperture bias (Gómez et al., 2003), while the upper redshift limit makes the sample approximately volume-complete, since the value of M roughly corresponds to the apparent magnitude limit of the SDSS spectroscopy () at . Following Bernardi et al. (2003), ETGs are those galaxies with SDSS parameters and . Also, we selected only those galaxies with spectroscopic warning flags set to zero, and with available velocity dispersion, in the range of to km/s. These requirements yield a sample of ETGs. We matched this sample to the fourth data release of the UKIDSS–Large Area Survey (Lawrence et al., 2007), which provides NIR photometry in the bands over a sky region significantly overlapping the SDSS. The matching was done considering only frames with the better quality flag () in all bands. For each ETG we selected the nearest UKIDSS detected galaxy within a matching radius 333The matching was done with the CrossID form of the WFCAM Science Archive (see http://surveys.roe.ac.uk/wsa/index.html for details). Changing the matching radius to ” leads to decrease the sample size by only five galaxies, confirming the accuracy of the matching procedure. of ”. ETGs have photometry available in all eight SDSS+UKIDSS filters.
3. Color gradient estimates
The images of each galaxy were retrieved from the SDSS and UKIDSS archives, and processed with 2DPHOT (see La Barbera et al. 2008; hereafter LdC08). Galaxy images were fitted with PSF convolved Sersic models, allowing us to estimate structural parameters, i.e. the effective radius, , the mean surface brightness within that radius, , and the Sersic index, , homogeneously in all the bands. The PSF was accurately modeled 444For the PSF fitting in all wavebands, the mean value of the reduced distribution amounts to , while the corresponding 90th percentile is . in all wavebands by fitting the five closest stars to each galaxy with a sum of three Moffat functions, as detailed in LdC08. Having eight wavebands, seven different color gradients can be estimated. We used the parameters , , and , to estimate color indices, with , as a function of the distance, , from the galaxy center. For each waveband, we estimate the mean surface brightness of the de-convolved Sersic model 555Using the de-convolved models makes the procedure insensitive to seeing effects. We also verified that color gradients do not correlate with PSF fitting values as well as with the error on the seeing FWHM, as estimated by 2DPHOT from the width of the sure star locus (see LdC08). on a set of concentric ellipses 666Ellipses are equally spaced in equivalent radius by , where is the the r-band ., whose ellipticity and position angle are fixed to the value of the -band Sersic fitting. The color index at a given radius is obtained by subtracting the mean surface brightness values at the corresponding ellipse. Each color profile is fitted in the radial range of to (see e.g. Peletier et al. 1990), by using an orthogonal least squares fitting procedure. We estimate the color gradients, , as the logarithmic slopes of the profiles, .
| g-r | -0.071 0.003 | 0.121 0.004 |
| g-i | -0.084 0.004 | 0137 0.003 |
| g-z | -0.089 0.006 | 0.173 0.003 |
| g-Y | -0.231 0.006 | 0.171 0.004 |
| g-J | -0.279 0.008 | 0.204 0.005 |
| g-H | -0.284 0.008 | 0.194 0.004 |
| g-K | -0.297 0.008 | 0.219 0.005 |
4. Constraining age and metallicity variations
Considering the effect of age and metallicity, we write the equations:
| (1) |
where and are the logarithmic radial
gradients of age, , and metallicity, , across the galaxy. The
quantities and
are the partial logarithmic
derivatives of with respect to age and
metallicity. The above linear equations hold if the color indices are
continuous functions of and , and the absolute values of
and are small.
From the operational
viewpoint, we consider two stellar populations and describe the
properties of the galaxy at the inner and outer radii,
and , respectively. Since our aim is that of characterizing stellar population gradients in the ETG population as a whole, we estimate the quantities
and from Eq. 1; using the mean values of the color
gradient estimates 777We verified that applying the same procedure to the single color gradient estimates, and then computing the mean values of and changes these quantities by less than dex. (see Sec. 5). We accomplish this in two
steps: (i) We parametrize the colors available in terms of age and
metallicity by using different spectrophotometric codes. We take
simple stellar populations (SSPs) from Bruzual & Charlot (2003) (BC03),
Maraston (2005) (M05), and Charlot and Bruzual (2008, in preparation;
CB08). These SSPs are based on different synthesis techniques and have
different IMFs. The M05 model uses the fuel consumption approach
instead of the isochronal synthesis of BC03 and CB08. The CB08 code
implements a new AGB phase treatment (Marigo and Girardi, 2007). The IMFs are: Scalo
(BC03), Chabrier (M05), and Salpeter (CB08). Moreover, we also use a
composite stellar population model from BC03 having exponential star
formation rate (SFR) with e-folding time of Gyr 888Though
the determination of absolute values of age and metallicity at a given galaxy radius is
beyond the scope of this paper, we have introduced the model with since it is
able to match also the absolute values of central colors in ETGs (La Barbera et al., 2003).. The models
are folded with the throughput curves, and flux values
computed for different values of and . Here, we use ages
spanning from to Gyrs 999corresponding to a
formation redshift of and to the age of the Universe in
the adopted cosmology, and metallicities from to for BC03 and CB08 models, and from to
for M05. To calculate the color derivatives with respect to and
, for each waveband we fitted the corresponding flux values with a
two-dimensional eight order polynomial in and . The
rms of the fits is smaller than mag for all the bands and
models.
(ii) We solve Eq. 1 in a sense,
by minimizing the expression
| (2) |
with respect to and . We evaluate the derivatives and at a given and values, representing the average age and metallicity of the two stellar populations.
5. Results
Table 1 lists the statistics of color gradients. We compute the peak value, , and the width, , using the bi-weight location estimator (Beers et al., 1990) taking bootstrap iterations to estimate uncertainties. As we can see, the peak value shifts to more negative values as we move to longer wavelengths, with a minimum in , and the width becomes progressively larger from the to the band. Because we have many galaxies, the random errors on and are very small.
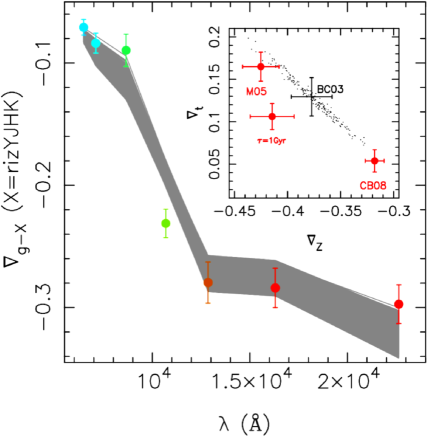
Fig. 1 shows the mean color gradient, , as a function of the effective wavelength of the filter , where the trend reflects how stellar population properties vary, on average, as a function of radius in ETGs. We adopt the procedure described in Sec. 4 to infer the mean age () and metallicity () radial gradients. To this end, we minimize Eq. 2 for each of the stellar population models described in Sec. 4. We estimate the quantities and in Eq. 2 for Gyr 101010In the adopted cosmology; this age value corresponds to and . Then, inserting the best-fit values of and into Eq. 1, we derived the color gradient values that best-fit the observations. We performed iterations, shifting, each time, the observed mean color gradients according to the corresponding uncertainties. Each set of best-fitted color gradients defines a polygonal line in Fig. 1, obtained by connecting the best-fitting values of . The grey region in the figure shows the area occupied by the bootstrap solutions. The inset shows the values of and obtained from the different iterations. Computing the average and the standard deviation of these values, we obtain and , respectively. Using a different radial range for computing color gradients, with to , does not change at all the values of the metallicity and age gradients. We also estimated and by computing and for different values of and , varying between and Gyrs, and between and . The inferred absolute value of ranges from to dex, while the value of is always positive, varying between and dex 111111We obtain the minimum value of only for the CB08 model, and only for the lowest metallicity case. For the BC03 and M05 models, we find dex regardless of the and values. .
6. Discussion
We studied mean color gradients in ETGs using an
unprecedentedly large and homogeneous sample with data from optical to
NIR wavebands. We find that, on
average, the main driver of color gradients is a radial variation of
metallicity, and that a
small, positive, age gradient seems to be present, on average, in ETGs, implying a
mildly younger stellar population to the galaxy center. The mean metallicity gradient varies between
and ,
depending on the stellar-population model adopted to fit the color
gradients. Previous studies based on much smaller samples,
found mostly between and ,
with a typical uncertainty of (e.g. Peletier et al. 1990; Saglia et al. 2000; Idiart et al. 2002; La Barbera et al. 2003; Tamura and Ohta 2003; de Propris et al. 2004; Wu et al. 2005), consistent with what we find here.
Past literature has shown that age gradients do not explain color
gradients, although a small positive age gradient of is still consistent with observations (see e.g. Saglia et al. 2000; La Barbera et al. 2003). For instance, Tamura and Ohta (2004) find a value of , while Wu et al. (2005), analyzing optical–NIR color
gradients for 36 nearby ETGs, report . Here,
we are able to detect a small but significantly positive age gradient
in ETGs. The presence of younger stars in the center of ETGs is
expected in most hierarchical formation scenarios. During the merger of
gas-rich systems, gas dissipates its kinetic energy, falling into the
galaxy center and forming stars.
The detection of a positive age
gradient also adds new insight to the fact that ETGs
have smaller effective radii at higher redshift when compared to (e.g. Daddi et al. 2005; Trujillo et al. 2006; Longhetti et al. 2007; Cimatti et al. 2008; Rettura et al. 2009; van der Wel et al. 2008; van Dokkum et al. 2008; Buitrago et al. 2008; Saracco et al. 2009). Since the luminosity evolution of a stellar population
is approximately independent of its metallicity, the internal
metallicity gradient of ETGs is assumed not to modify the effective
radius with redshift. However, a difference in the formation epoch of
two stellar populations corresponds to larger and larger differences
in luminosity as we approach the formation epochs.
Our result implies that a younger stellar population in the galaxy
center would brighten more rapidly with redshift than the outer
stellar population, making the profile more concentrated
at high , and possibly inverting the observed colour
gradients. To quantify these effects, we take an law in the
same radial range of to where we derived the
internal color gradients (Sec. 3). At the inner radius
, we assume a stellar population with metallicity
and formation redshift . Then, for a given radius, the
profile is evolved with redshift according to the luminosity evolution
of a SSP whose age and metallicity are computed from ,
, and . At a given redshift, , the profile is fitted with an
law, yielding an effective radius
. We used three models with different values of ,
, and . We fixed , since
varying it in the range of to makes
change only a few percent. All the evolved
profiles were well fit by the law, with an rms smaller
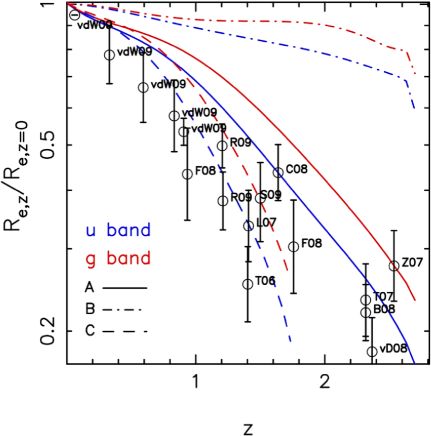
than . Fig. 2 compares the
evolution in size, , from different sources in the literature
with that expected from the three previously mentioned models. Since the data sample different restframes, from UV to optical wavebands, we constructed the models in both
the and bands. Model A takes and
, an age gradient consistent with our
findings and such that the stellar population at
has an age limited by that of the Universe. Model B uses the same
as model A, but with and . Model C has the same
metallicity and age gradients as
Model A for BC03 SSPs, but a younger inner stellar population
with . As expected, a pure metallicity model (Model B) does
not predict any significant size evolution with redshift. The evolution
is mildly stronger in the restframe UV, with smaller in the
u than in g band. At , the value of is about
(Wu et al., 2005). Following the method of Sparks and Jörgensen (1993), this gradient implies that effective radii of ETGs increase by from to band at . The waveband
dependence of would tend to reduce and possibly invert this trend,
producing at high redshift. The inversion
takes place at a redshift, , where the ratio of between the g and u bands equals the value of . For both models A and C,
is very close to , being and , respectively.
Interestingly, positive color gradients in high-redshift ETGs have been detected
by Ferreras et al. (2005), who found that about one-third of field ETGs at have
blue cores, in contrast to only at lower redshift (see
also Menanteau et al. 2001, 2004; Ferreras et al. 2009).
Fig. 2 shows that a single formation epoch for the inner stellar population of ETGs does not reproduce the observations. Model A
predicts a size evolution of at , in good agreement with the data at . However, the
evolution is too shallow for lower redshifts, where a smaller is required to fit the data
(model C). This result could be explained in a picture whereby ETGs form
at different redshifts by gas-rich mergers, and the redshift-size trend
is due to the increase in the amount of dissipation in
mergers with redshift (Khochfar and Silk, 2006). Fig. 2 suggests that the central bursts of star formation take place at different redshifts, above . However, the present
analysis does not exclude a picture where the younger stars in the center form at very high
redshift in most galaxies, with the color gradients accounting for only some part of the
redshift-size relation.
References
- Beers et al. (1990) Beers, T.C., Flynn, K., & Gebhardt, K. 1990,AJ, 100, 32
- Bernardi et al. (2003) Bernardi, M., et al. 2003a, AJ, 125, 1849
- Blanton et al. (2003) Blanton, M.R., et al., 2003, AJ, 125, 2276
- Bruzual & Charlot (2003) Bruzual, G., & Charlot, S. 2003, MNRAS 344, 1000 (BC03)
- Buitrago et al. (2008) Buitrago, F., et al. 2008, ApJ 687, 61 (B08)
- Cassata et al. (2005) Cassata, P. et al. 2005, MNRAS 357, 903
- Cimatti et al. (2008) Cimatti, A., et al. 2008, A&A, 482, 21 (C08)
- Daddi et al. (2005) Daddi, E. et al. 2005, ApJ 626, 680
- Faber (1972) Faber, S.M. 1972, BAAS 4, 224
- Fan et al. (2008) Fan, L., 2008, ApJ 689, 101
- Ferreras et al. (2005) Ferreras, I., et al. 2005, ApJ 635, 243
- Ferreras et al. (2009) Ferreras, I., et al. 2009, ApJ 635, 243
- Franx et al. (2008) Franx, M., et al. 2008, ApJ 688, 770 (F08)
- Gómez et al. (2003) Gómez, P.L., et al. 2003, ApJ, 584, 210
- Hogg et al. (2004) Hogg, D.W., et al. 2004, ApJ, 601, 29
- Idiart et al. (2002) Idiart, T.P., Michard, R., & de Freitas Pacheco, J.A. 2002, A&A, 383, 30
- Khochfar and Silk (2006) Khochfar, S., & Silk, J. 2006, ApJ 648, 21
- La Barbera et al. (2003) La Barbera, F., et al. 2003, A&A, 409, 21
- La Barbera et al. (2004) La Barbera, F. et al. 2004, A&A, 425 797
- La Barbera et al. (2008) La Barbera, F., et al. 2008, PASP, 120, 681
- Lawrence et al. (2007) Lawrence, A., et al. 2007, MNRAS, 379, 1599
- Longhetti et al. (2007) Longhetti, M., et al. 2007, MNRAS 374, 614 (L07)
- Maraston (2005) Maraston, C. 2005, MNRAS, 362 799 (M05)
- Marigo and Girardi (2007) Marigo, P., & Girardi, L. 2007, A&A 469, 239
- Menanteau et al. (2001) Menanteau, F., et al. 2001, MNRAS, 322, 1
- Menanteau et al. (2004) Menanteau, F., et al. 2004, ApJ 612, 202
- Peletier et al. (1990) Peletier, R.F. et al. 1990, A&A, 233, 62
- de Propris et al. (2004) de Propris, R., et al. 2004, MNRAS 357, 590
- Rettura et al. (2009) Rettura, A., et al. 2009, ApJ in press (arXiv0806.4604) (R09)
- Saglia et al. (2000) Saglia, R.P., et al. 2000, A&A, 360, 911
- Saracco et al. (2009) Saracco, P., et al. 2009, MNRAS, 392, 718 (S09)
- Sorrentino et al. (2006) Sorrentino, G., Antonuccio-Delogu, & V., Rifatto, A. 2006, A&A, 460, 673
- Sparks and Jörgensen (1993) Sparks, W.B., & Jörgensen, I. 1993, AJ 105, 5
- Spolaor et al. (2009) Spolaor, M., et al. 2009, ApJ 691, 138
- Tamura et al. (2000) Tamura, N., et al. 2000, AJ 119, 2134
- Tamura and Ohta (2003) Tamura, N., Ohta, K., 2003, AJ, 126, 596
- Tamura and Ohta (2004) Tamura, N., Ohta, K., 2004, MNRAS 355, 617
- Tinsley (1973) Tinsley, B.M. 1973, ApJ 186, 35
- Toft et al. (2008) Toft, S., et al. 2007, ApJ 671, 285 (T07)
- Trujillo et al. (2006) Trujillo, I., et al. 2006, MNRAS 373, 36
- Trujillo (2009) Trujillo, I., et al. 2009, ApJL in press, arXiv:0901.1032
- van der Wel et al. (2008) van der Wel, A., et al. 2008, ApJ 688, 48 (vW08)
- van Dokkum et al. (2008) van Dokkum, P., et al. 2008, ApJ 677, L5 (vD08)
- Wu et al. (2005) Wu, H., et al. 2005, ApJ 622, 244
- Zirm et al. (2007) Zirm, A.W. et al. 2007, ApJ 656, 66 (Z07)