Far-infrared absorption and the metal-to-insulator transition in hole-doped cuprates
Abstract
By studying the optical conductivity of Bi2Sr2-xLaxCuO6 and Y0.97Ca0.03Ba2Cu3O6, we show that the metal-to-insulator transition (MIT) in these hole-doped cuprates is driven by the opening of a small gap at low in the far infrared. Its width is consistent with the observations of Angle-Resolved Photoemission Spectroscopy in other cuprates, along the nodal line of the -space. The gap forms as the Drude term turns into a far-infrared absorption, whose peak frequency can be approximately predicted on the basis of a Mott-like transition. Another band in the mid infrared softens with doping but is less sensitive to the MIT.
pacs:
74.25.Gz, 78.30.-jThe parent compounds of high- cuprates are half-filled antiferromagnetic (AF) insulators where the Coulomb repulsion opens a wide charge-transfer (CT) gap ( 1.5 eV) in the excitation spectrum. By adding a few percent holes () or electrons () per Cu ion, the CT gap is filled by a broad infrared absorption, while Angle-Resolved Photoemission Spectroscopy (ARPES) reveals fully gapped single particle excitations at low temperature ShenARPES . At 0.05, like in La2-xSrxCuO4 (LSCO), or 0.12 like in Nd2-xCexCuO4 (NCCO), the insulator eventually turns at low into a superconductor, above into a ”strange metal” characterized by a pseudogap in the density of states Timusk99 . Much effort has been devoted in the last two decades to understand these three phases and their excitation spectrum. However, less attention has been paid to the mechanism of the transition from the AF insulator to the strange metal and vice versa, which is far from being clear. For example, the onset of a metallic state is observed at or values much higher than those which destroy the AF long range order Iye92 . Therefore, magnetism should not play a dominant role in the metal-to-insulator transition (MIT). The mechanisms responsible for the localization of the carriers then may be disorder due to dopant ions Atkinson , local electron-spin interactions Defilippis , or the electron-phonon coupling Cimento .
In the present paper we investigate the MIT by studying the behavior of the optical conductivity across the transition, in the single Cu-O layer cuprate Bi2Sr2-xLaxCuO6 (BSLCO). Therein, hole doping can be accurately controlled like in LSCO by replacing Sr by La. In BSLCO, decreases Ono00 for increasing according to a relation which is not linear, due to compensation effects, but well known Ando00 ; Ono03 . Finally, is low enough ( 30 K at optimum doping) to allow for a study of the normal state of the Cu-O planes at low . Here we have measured four single crystals Ono03 with = 1.0, 0.9, 0.8, and 0.7, corresponding to 0.03, 0.07, 0.10, and 0.12, respectively. As at one reaches the lowest allowed by the miscibility of La in the Bi2Sr2CuO6 matrix. Therefore, we have also measured a single crystal of Y1-xCaxBa2Cu3O6 (YCBCO) with = 0.03 and 0.015. As in YCBCO the CuO chains are empty and only the Cu-O plane contributes to the optical response Erb , we could thus probe five Cu-O planes with decreasing hole doping, from an underdoped metallic state ( 0.12) to an AF insulating phase ( 0.015).
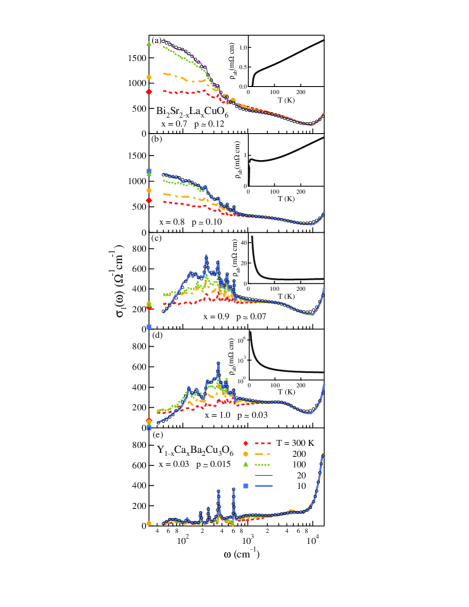
The -plane resistivity of the four BSLCO crystals is reported in the insets of Fig. 1 and dc conductivity values are shown, for selected temperatures, on the vertical axis of the same Figure. In , for 0.12, shows a metallic behavior above the superconducting transition at 13 K. The crystal with 0.10 in Fig. 1- displays a metallic behavior above 50 K, and a broad minimum above the transition to a superconducting state Ono03 at 1.4 K. At , in is nearly constant down to 50 K. Below, it diverges for 0 according to a variable range hopping regime Ono03 . A clearly semiconducting behavior at any () is instead shown by the compound with 0.03 in Fig. 1-. Therefore the MIT can be placed between and . This finding is consistent with the Mott-Ioffe-Regel limit, which fixes the metal-to-insulator crossover and, for the Cu-O planes, can be written as Ando08 . Here, is the Fermi wavevector, the carrier mean free path, and is the -axis lattice spacing. Indeed, following Ref. Ono00, , from the (10 K) in Fig. 1 one obtains = 3.4 at = 0.10, = 0.05 at = 0.07. Magnetic fields on the order of 60 T displace the MIT Ono00 to 1/8.
The -plane reflectivity of the five samples was measured at near-normal incidence from 40 or 50 to 22000 cm-1 at different , shortly after cleaving the sample. The real part of the optical conductivity , as obtained from via Kramers-Kronig (KK) transformations, is shown in Fig. 1. The extrapolations to high frequency were based on the data of Ref. Terasaki, , those to zero frequency on Drude-Lorentz fits, which provided deviations from the measured of a few percent. Afterwards, the extrapolations were adjusted to (including that at 20 K in , not shown). In insulating YCBCO, a check value of was measured at 200 K private and reported in Fig. 1-. Figures 1- ( 0.12) and - ( 0.10) exhibit a Drude term which partially shields the phonon peaks. These are instead well evident in panels ( 0.07), ( 0.03), and ( 0.015). Their frequencies are in good agreement with those previously measured TajimaPhon on Bi2SrLaCuOy and YBa2Cu3Oy. Around 10000 cm-1, increases steeply due to the CT transition between Cu and O orbitals, as in the other cuprates.
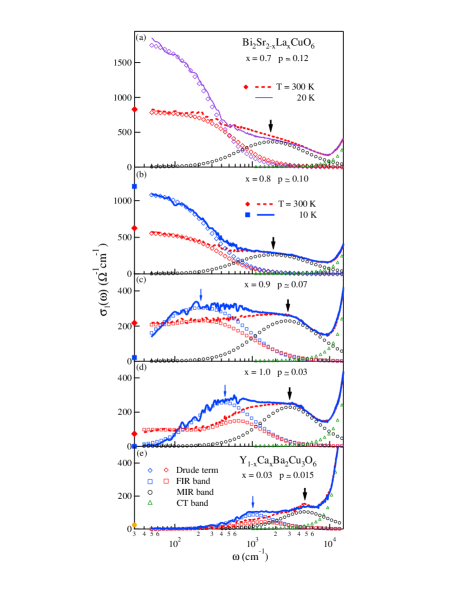
Let us now focus on the broad far- and mid-infrared contributions in Fig. 1. To better understand their behavior with doping and temperature, in Fig. 2 is reported at 300 K (dashed lines) and at the lowest (solid lines), after the phonon lines have been subtracted by accurate Lorentzian fits (those at the lowest T are shown in Fig. 1). Further fits - not reported in Fig. 2 as they could be hardly distinguished from the data - were then made on the subtracted spectra, by using a Drude term and two broad bands at and (open symbols). In the metallic phase (Fig. 2- and -) at all temperatures, data are fit by a simple Drude term plus a -independent mid-infrared (MIR) band peaked at 2000 cm-1. As decreases below the critical hole content (Fig. 2-), the Drude term turns at low into a far-infrared (FIR) band peaked at 200 cm-1. Correspondingly, becomes vanishingly small. At 0.03 (Fig. 2-), a gap 100 cm-1 opens in at = 10 K. Meanwhile, shifts to 400 cm-1. Finally, at 0.015 in Fig. 2-, the insulating gap extends along the whole far-infrared region, and the FIR peak is displaced to 1000 cm-1. At 300 K, both in and the FIR band includes a background - suggestive of incoherent charge transport - which extends to = 0 and accounts for the residual dc conductivity of these samples at room temperature.
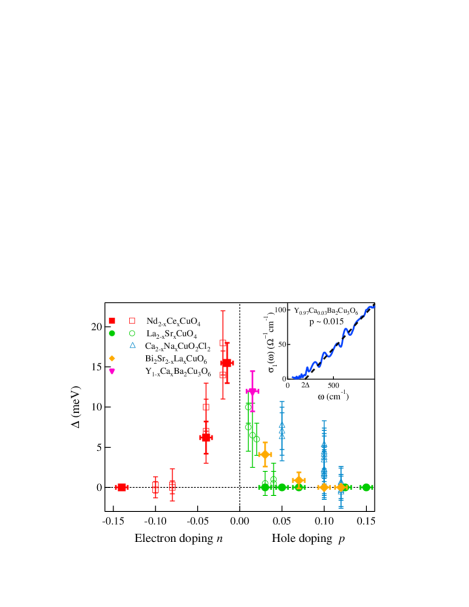
The results of Fig. 2 can be compared with those of ARPES experiments. Figure 3 reproduces that in Ref. ShenARPES, , which shows the gap at low doping and low in the density of states of different cuprates, measured at the leading edge midpoint along the nodal line of the Brillouin zone. In BSLCO with 0.05 and 0.07, a low- suppression of the spectral-weight was also observed along that direction in the -space, but the gap width could not be measured for lack of resolving power HashimotoARPES . We have also plotted in Fig. 3 both the present determinations of the gap in BSLCO, YCBCO, and those extracted from previous measurements in LSCO Lucarelli03 and in NCCO Lupi99 . In all cases, the infrared gap 2 is obtained after phonon subtraction, by a linear extrapolation to zero Katsufuji of the optical conductivity along the gap edge (see an example in the inset), and then divided by two (by assuming full hole-electron symmetry). If also the IR gap were taken at mid-height, the full symbols would displace toward high frequencies by about a factor of 2. In Fig. 3, independently of the procedure employed, both the infrared and ARPES observations consistently indicate that a small gap - just a few meV wide - opens in the density of states at the MIT. In LSCO, however, for reasons which deserve further investigations, the ARPES gap is not observed the infrared Lucarelli03 ; Padilla . In turn, the band at can be associated with the incoherent background observed at eV below the quasi-particle peak in the antinodal ARPES spectra of cuprates ShenARPES ; HashimotoARPES ; MengCondMat .
The mechanism of the MIT in the Cu-O plane appears clearly in Fig. 2: as decreases below , the carriers increasingly localize at low into states having an optical ionization energy measured by . increases for decreasing and reaches about 0.12 eV in the limit of high dilution (Fig. 1-). This value is in excellent agreement with previous observations in electron-doped NCCO at the lowest doping Calvani94 .
A simple calculation can predict . Indeed, as usually done in semiconductors Mott , one may model the charge injected in the Cu-O plane as a hole orbiting with radius either around a defect or an impurity (in case of disorder) or within an attractive potential well due to lattice distortion (in a polaronic model). is related to through the hydrogen-like equation
| (1) |
where = 0.0529 nm is the Bohr radius and = 109737 cm-1 is the Rydberg constant. The Mott transition occurs at a 2-D critical density of holes per Cu ions such that nota the orbits of adjacent charges overlap in the Cu-O planes. This condition implies that the hole density and the Cu density satisfy the relation
| (2) |
Here, we use = 0.386 nm, averaged between the Cu-O lattice parameters of TajimaPhon Bi2SrLaCuOy and YBa2Cu3Oy (0.383 nm and 0.389 nm, respectively). Assuming from Fig. 2 , and an average = 6.7 nm-2, one obtains, from Eq. 2, nm and, from Eq. 1, cm-1. This value is in very good agreement with the cm-1 observed here at high hole dilution (in the YCBCO with of Fig. 2-).
Therefore, one should find the origin of the FIR band in order to understand the MIT mechanism. A first candidate is disorder. In cuprates added with Zn impurities, or irradiated by high-energy particles, the metallic phase can be destroyed and the Drude spectral weight strongly reduced, due to a poor screening of the impurities and to the resulting fluctuating potentials in the Cu-O planes Basov98 ; Basov94 . Recent calculations Atkinson show that such disorder effects are amplified in a -wave electronic symmetry and that, for increasing impurity content, the Drude term turns into a FIR peak at a finite frequency. This framework is consistent with the behavior of BSLCO, where the insulating phase is reached by adding La impurities, not with that of LSCO which is opposite. It seems then that the parameter which governs the metal-to-insulator transition is , rather than .
A different scenario can then be invoked to explain the MIT. Indeed, in BSLCO the FIR peak behaves with like a FIR band of NCCO vs. Lupi99 . This absorption was attributed to large polarons Cimento and its softening was explained in terms of polaron-polaron interactions which increase with Devreese ; Lorenzana . At room temperature, where , incoherent polaron hopping takes place: this may explain the flat background observed in Fig. 2- and - and the resulting, non-vanishing at . The above scenario is also consistent with recent calculations of the optical conductivity in hole-doped cuprates. They are based on a --Holstein approach, where the FIR band has a dominant electron-phonon character, while the MIR band is attributed mainly to electron-spin interactions Mishchenko08 . The observation of the MIR band at therefore indicates that local antiferromagnetic fluctuations survive in the underdoped metallic state, as also reported previously for YBCO Basov . As decreases, in Fig. 2 shifts steadily to higher energies, to reach 4500 cm-1 at 0.015. This value is consistent with the determinations of the MIR peak in the other cuprates ( 0.5 eV) TimuskBasov . Despite that shift, in Fig. 2 the MIR absorption does not seem to play a major role in the MIT.
In conclusion, we have measured both the dc and infrared conductivity of BSLCO with different doping, and of a lightly doped sample of YCBCO. We have thus monitored the mechanism of the metal-to-insulator transition in the hole-doped Cu-O plane. For any from 0.12 down to 0.015 we have detected a MIR band which hardens for decreasing but is poorly sensitive to the MIT. In the far infrared, on the contrary, the Drude term of the metallic phase collapses at the MIT into a FIR band at finite frequency. As is further decreased, this band shifts to higher energies, leaving behind a gap at low , a flat absorption tail at high . The FIR gap here observed is in quantitative agreement with that reported by ARPES in other cuprates with similar doping at low , and the FIR peak frequency is correctly predicted by a simple Mott-transition model. Both bands here identified are consistent with a recent model, where the carrier localization is interpreted in terms of charge and spin polarons. According to this interpretation, the FIR band is mainly due to electron-phonon interaction, the MIR band to electron-spin interaction.
We are gratefully indebted to Andreas Erb for providing the YCBCO crystal. This work has been partially funded by PRIN 2005022492. S.O. was supported by KAKENHI No. 20740213.
References
- (1) K. M. Shen et al., Phys. Rev. B 69, 054503 (2004).
- (2) For a review, see T. Timusk and B. Statt, Rep. Progr. Phys. 62, 61 (1999).
- (3) Y. Iye, in Properties of High Temperature Superconductors, edited by D. M. Ginsberg (World Scientific, Singapore, 1992), Vol. 3, pp. 285-361.
- (4) W.A. Atkinson and P.J. Hirschfeld, Phys. Rev. Lett. 88, 187003 (2002).
- (5) G. De Filippis, V. Cataudella, A. S. Mishchenko, and N. Nagaosa, Phys. Rev. Lett. 99, 146405 (2007).
- (6) For a review, see P. Calvani, Riv. Nuovo Cimento 24, 1 (2001).
- (7) S. Ono et al., Phys. Rev. Lett. 85, 638 (2000).
- (8) Yoichi Ando et al., Phys. Rev. B 61, R14956 (2000); Phys. Rev. B 63, 069902 (2001).
- (9) S. Ono and Yoichi Ando, Phys. Rev. B 67, 104512 (2003).
- (10) A. Jánossy, T. Fehér, and A. Erb, Phys. Rev. Lett. 91, 177001 (2003).
- (11) Yoichi Ando, J. Phys. Chem. Solids 69, 3195 (2008).
- (12) I. Terasaki et al., Phys. Rev. B 41, 865 (1990).
- (13) A. Jánossy, private communication.
- (14) S. Tajima et al., Phys. Rev. B 43, 10496 (1991).
- (15) M. Hashimoto et al., Phys. Rev. B 77, 094516 (2008).
- (16) A. Lucarelli et al., Phys. Rev. Lett. 90, 037002 (2003).
- (17) S. Lupi et al., Phys. Rev. Lett. 83, 4852 (1999).
- (18) T. Katsufuji et al., Phys. Rev. Lett. 75, 3497 (1995).
- (19) W. J. Padilla et al., Phys. Rev. B 72, 060511(R) (2005).
- (20) J. Meng et al., arXiv:0808.0806v2 [cond-mat.supr-con] (2008).
- (21) P. Calvani et al., Solid State Commun. 91, 113 (1994).
- (22) N. Mott, in Metal-Insulator Transitions (Taylor & Francis, London, 1990).
- (23) The three dimensional Mott criterion can be extended to a charge moving in the Cu-O plane with small corrections, as shown by Kastner et al., [Rev. Mod. Phys. 70, 897 (1998)]. In the present general approach, we adopted the simple geometrical factor instead of the usual, phenomenological valuer 0.25 which leads, for example, to a large mismatch with the of Si:P [C. Kittel, Introduction to Solid State Physics, 7th ed., John Wiley and Sons, New York 1996, p. 285].
- (24) D. N. Basov, B. Dabrowski, and T. Timusk, Phys. Rev. Lett. 81, 2132 (1998).
- (25) D. N. Basov, et al., Phys. Rev. B 49, 12165 (1994).
- (26) J. Tempere and J. T. Devreese, Phys. Rev. B 64, 104504 (2001); Eur. Phys. J. B 20, 27 (2001).
- (27) J. Lorenzana, Europhys. Lett. 53, 532 (2001).
- (28) A. S. Mishchenko et al., Phys. Rev. Lett. 100, 166401 (2008).
- (29) Y. S. Lee et al., Phys. Rev. B 72, 054529 (2005).
- (30) D. N. Basov and T. Timusk, Rev. Mod. Phys. 77, 721 (2005).