Spitzer Observations of the Young Core-collapse Supernova Remnant 1E0102-72.3: Infrared Ejecta Emission and Dust Formation
Abstract
We present Spitzer IRS and IRAC observations of the young supernova remnant E0102 (SNR 1E0102-7219) in the Small Magellanic Cloud. The infrared spectra show strong lines of Ne and O, with the [Ne II] line at 12.8 m having a large velocity dispersion of 2,000-4,500 km s-1 indicative of fast-moving ejecta. Unlike the young Galactic SNR Cas A, E0102 lacks emission from Ar and Fe. Diagnostics of the observed [Ne III] line pairs imply that [Ne III] emitting ejecta have a low temperature of 650 K, while [Ne V] line pairs imply that the infrared [Ne V] emitting ejecta have a high density of 104 cm-3. We have calculated radiative shock models for various velocity ranges including the effects of photoionization. The shock model indicates that the [Ne V] lines come mainly from the cooling zone, which is hot and dense, whereas [Ne II] and [Ne III] come mainly from the photoinization zone, which has a low temperature of 400 - 1000 K. We estimate an infrared emitting Ne ejecta mass of 0.04 from the infrared observations, and discuss implications for the progenitor mass. The spectra also have a dust continuum feature peaking at 18 m that coincides spatially with the ejecta, providing evidence that dust formed in the expanding ejecta. The 18 m-peak dust feature is fitted by a mixture of MgSiO3 and Si dust grains, while the rest of the continuum requires either carbon or Al2O3 grains. We measure the total dust mass formed within the ejecta of E0102 to be 0.014 M⊙. The dust mass in E0102 is thus a factor of a few smaller than that in Cas A. The composition of the dust is also different, showing relatively less silicate and likely no Fe-bearing dust, as is suggested by the absence of Fe-emitting ejecta.
1 Introduction
Young supernova remnants (YSNRs) are the most viable astrophysical laboratories for the study of dust formation, nucleosynthesis of heavy elements, cosmic-ray acceleration, and shock physics. Of these, dust formation is the least well-studied despite its invocation in efforts to explain some of the most important problems in astrophysics, including the isotopic anomalies of heavy elements in meteorites (Clayton 1982), dust formation in the early Universe (Nozawa et al., 2003), the measured abundances of Galactic cosmic rays (Ellison, Drury & Meyer 1997), and the interstellar dust budget crisis (Jones et al., 1994).
Meteoritic and astronomical studies show that presolar, cosmic grains condense in the dense, warm stellar winds of evolved stars and in the ejecta of supernovae. Mantles of the pre-existing dust in molecular clouds are vaporized as the forming stars and planetary systems heat them. A small fraction of the dust survives solar system formation without alteration, protected inside asteroids. The most abundant presolar grains are SiC, nanodiamonds, amorphous silicates, fosterite and enstatite, and corundum (Al2O3) (Messenger et al., 2006). Some isotopic anomalies of heavy elements in meteorites have been attributed to the dust that had condensed deep within expanding supernovae and some have the r-process composition commonly associated with Type II SNe (Clayton et al., 1997, 2004, references therein).
Recent deep sub-mm observations have also shown there to be galaxies and QSOs with very large dust masses () at (Wang et al. 2008; Beelen et al. 2006; Bertoldi et al. 2003). The timescales for low mass (AGB) stars to release their dust are too long to explain these high redshift systems (Morgan & Edmunds 2003). In contrast, supernovae evolved from massive stars produce copious amounts of heavy elements and release them on short timescales. Theoretical modeling of the conditions in the supernova ejecta indicates that Type-II SNe are sources of dust formation and should produce substantial quantities of dust, on the order of a solar mass per explosion (Deneault, Clayton, & Heger, 2003; Deneault, Clayton, & Meyer, 2006; Todini & Ferrara, 2001; Nozawa et al., 2003). Yet until very recently, there existed little observational evidence that this actually occurs.
There is now sufficient evidence for dust formation in core-collapse supernovae. For SN 1987A, this includes dust emission, dust absorption and a drop in line intensities for the refractory elements that signals that dust is being formed (Lucy et al, 1989, 1991). Formation of dust in the expanding ejecta of SN 1987A was explored theoretically (Kozasa et al, 1989, 1991). The Type II-P SN1999em also showed clear signs of dust formation (Elmhamdi et al. 2003). Detections of CO fundamentals with Spitzer observations of SN 2005af and Cas A further provide an indirect evidence of dust formation in SNe (Kotak et al., 2006; Rho et al., 2009).
For the young Galactic SNR, Cas A, ISO observations gave evidence for the association of the dust with the ejecta by requiring a mixture of dust grains that are not typical of the ISM, while showing strong spatial correlations between the high-velocity infrared emission lines, the dust continuum emission, and the optically emitting ejecta (Lagage et al. 1996 and Arendt et al. 1999). Submillimeter observations of Cas A and Kepler with SCUBA (Dunne et al., 2003; Morgan et al., 2003) suggest the presence of large amounts of cold dust ( at 15–20 K), but with some controversy related to the presence of foreground material. Krause et al. (2004) showed that much of the 160 m emission observed with Multiband Imaging Photometer for Spitzer (MIPS) is foreground material, suggesting there is no cold dust in Cas A. Wilson & Batrla (2005), however, used CO emission towards the remnant to show that up to about a solar mass of dust could still be associated with the ejecta rather than with foreground material. New submm polarimetry data confirms that a significant fraction (30%) of the submm flux originates from within the remnant (Dunne et al. 2009). The case for dust formation in supernova ejecta was strengthened by Spitzer observations of Cas A, for which line-free dust maps were found to remarkably resemble the infrared ejecta-line maps of [Ar II], [O VI], and [Ne II]; the estimated dust mass is between 0.02 and 0.054 M⊙ (Rho et al., 2008). A similar dust mass is reproduced by theoretical models of dust formation that include dust destruction and stochastic heating (Kozasa, 2009) and dust destruction (Bianchi & Schneider, 2007; Bianchi, 2009) for Cas A.
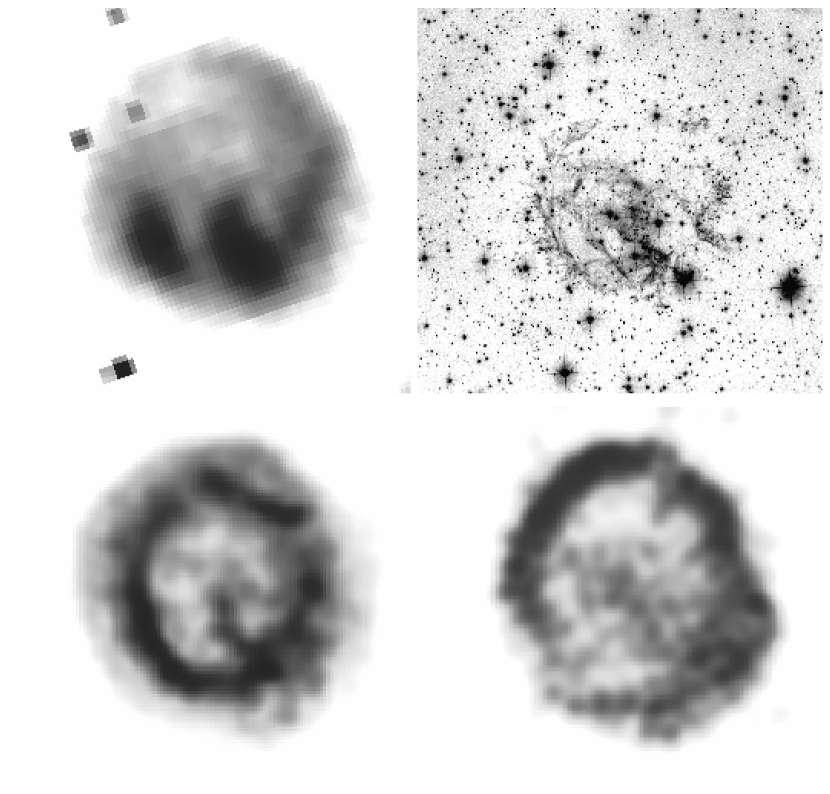
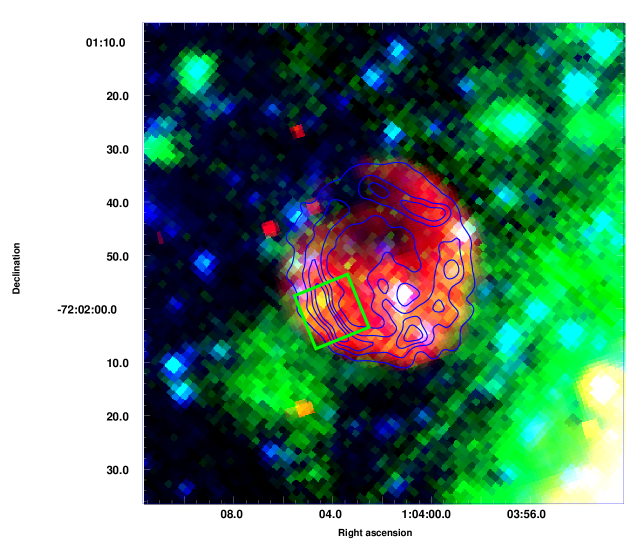
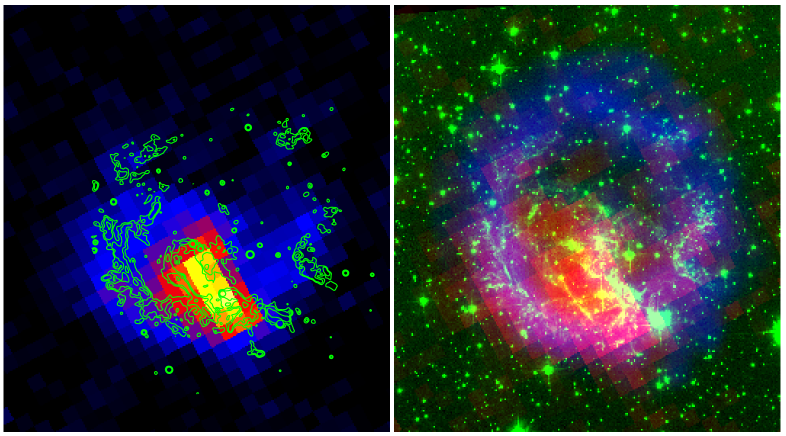
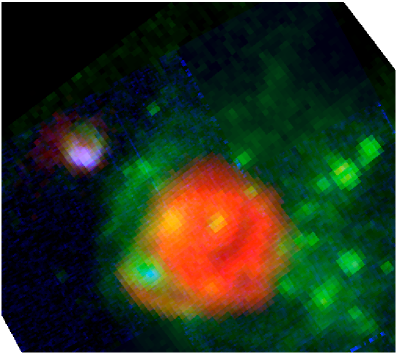
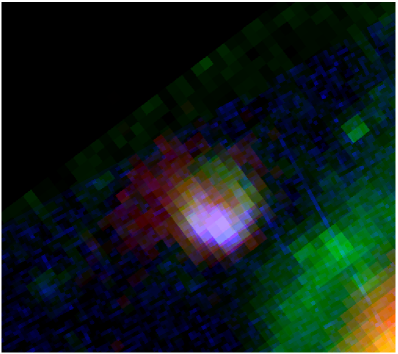
Another excellent source to study dust formation in SNe is the young supernova remnant (SNR) 1E 0102-7219 (SNR B0102-72.3; E0102 hereafter) in the Small Magellanic Cloud. As summarized in Table 1, it is located at R.A. and Dec. 01 (J2000), and has a diameter of 44”, which corresponds to 13.04 pc for a distance of 61.1 kpc to the SMC (Hilditch, Howarth & Harries, 2005; Keller & Wood, 2006). Various wavelength images of E0102 are shown in Figure 1. Highly enriched abundances of oxygen and neon relative to carbon and magnesium (Blair et al. 2000), as is characteristic of massive progenitors, place E0102 in the class of oxygen-rich” SNRs, along with Cas A. The optical ejecta in E0102 have substantial velocities that exceed 1000 km s-1 and imply a dynamic age of about 1000 yr (Tuohy, 1983). The X-ray proper motion of the blast wave measured by Hughes et al. (2000) is also consistent with this age. More recent HST measurements of the ejecta filament proper motions imply a kinematic age of 2050600 yr that is a factor of two higher (Finkelstein et al. 2006), but the proper motion measurements are consistent within their quoted errors. The composition of the optically emitting ejecta suggests a massive progenitor that underwent either a Type Ib (Blair et al., 2000) or Type Ic (Flanagan et al., 2004) supernova explosion. The optical expansion rates place E0102 currently in transition from free expansion to the Sedov phase. The low extinction toward E0102 compared with that of Galactic SNRs makes it possible to observe the infrared (IR) emission without contamination by emission from clouds along the line of sight (as seen, for example, in Cas A, Krause et al. (2004)). The low metallicity environment of the SMC also makes E0102 a useful Type II prototype to compare with SNRs at higher redshifts.
In the infrared, the 24 m Spitzer MIPS image of E0102 presented by Stanimirovic et al. (2006) shows a filled morphology with two prominent elongated filaments that resemble structures seen in the X-ray image; the remnant was not detected at 8 or 70 m. The infrared emission appears to be mainly associated with reverse shocks of the hot X-ray gas. An IR emission peak around 24 m would suggest the presence of hot dust in E0102 with T120 K, with most of the dust being centrally located, based on the 24 m image. Assuming the dust originates in the ISM and using typical ISM dust absorption coefficients (Draine & Lee, 1984), the estimated dust mass is . Even if all the dust were actually formed in the explosion, this dust mass is lower than might be expected based on some theoretical models. Most importantly, since the 24 m emission contains both line and continuum, not photometry but spectroscopy is required to estimate the mass and composition of dust as was demonstrated by Rho et al. (2008).
In this paper, we present Spitzer spectral and imaging observations of E0102 with IRS and IRAC. We find that the infrared ejecta emission is dominated by Ne and O and detect a dust feature peaking at 18 m which is spatially coincident with the ejecta emission. A high portion of the dust clearly comes from ejecta, rather than being all associated with circumstellar/interstellar material. We show that some of dust is at lower temperature and a total dust mass is higher than inferred from earlier observations. We discuss physical conditions of infrared emitting Ne and its inferred ejecta mass using emission line diagnostics and shock models.
2 Observations
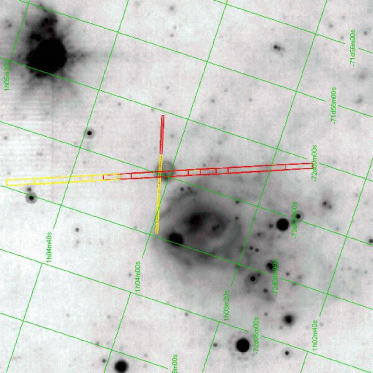
We performed an IRS staring observation toward the southeastern shell of E0102 (R.A. and Dec. 02, J2000, see Figure 2) as a part of our Young SNR Spitzer GO program (PI: Rho). The Long Low (LL: 15-40 m) IRS data were taken on 2005 August 14 with 6 cycles of 30 sec exposure time; this yields a total exposure time of 360 sec for the first and second staring positions. The Short Low (SL: 5-15 m) IRS observations were made with 3 cycles of 60 sec exposure time and one cycle covers 2 dither positions; this yields a total exposure time of 360 sec per sky position.
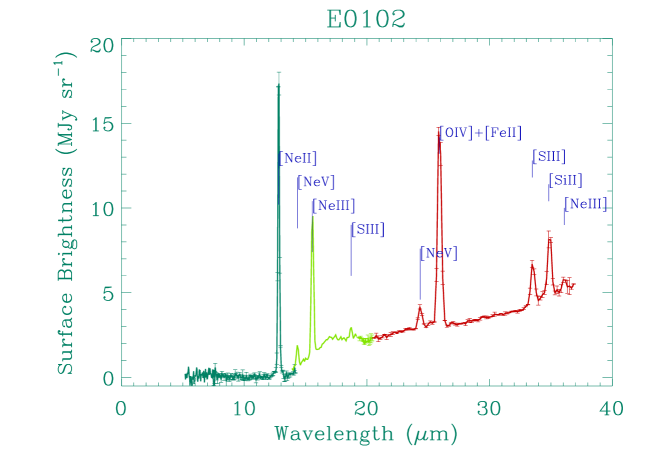
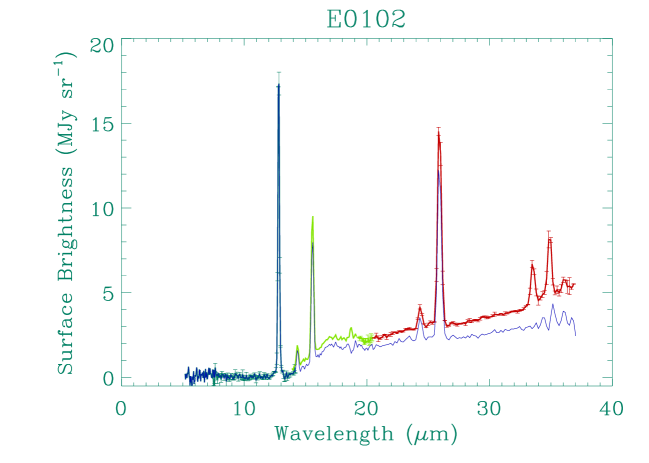
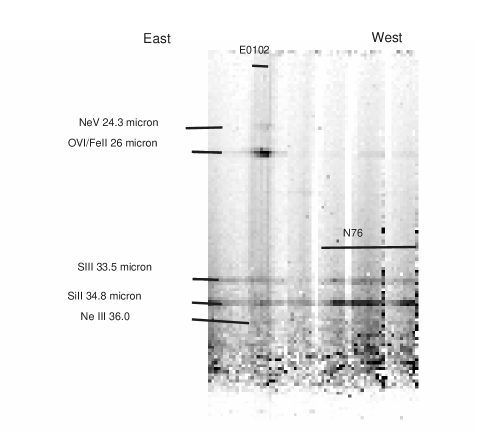
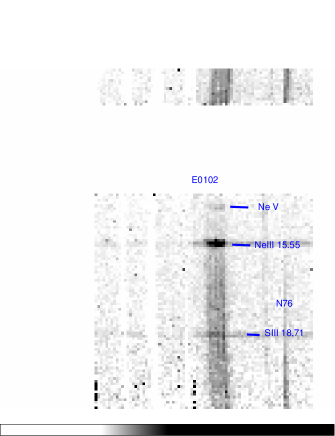
The IRS spectra were processed using the S15.3 pipeline products as follows. First, we removed rogue pixels (bad pixels mainly due to cosmic rays) by subtracting nearby empty sky fields with the same exposure time. We took the empty sky data from our observation in the alternate orders or from archival data (AORs 14706944, 14707712, 14708480, and 14708824). Any remaining rogue pixels were removed by using the SSC tool IRSCLEAN111http://ssc.spitzer.caltech.edu/archanaly/contributed/. Second, we extracted the spectrum using SPICE, and removed fringes. Third, we applied aperture and slit-loss corrections for diffuse emission (also see Tappe, Rho, & Reach 2006). The reduced spectrum is shown in Figure 3. Additionally we subtracted a local background spectrum using the relatively emission-free regions right outside the SNR in our slit data (specifically, the region outside the eastern side of E0102 at RA. 16.060, Dec. -72.039). The background-subtracted spectrum is shown in Figure 4. Comparison of the two spectra is described in §3.1. The staring mode yields 4 coadded spectral images (positions 1 and 2, LL1 and LL2) which we merged to make a position–wavelength map as shown in Figure 5. The location of E0102 on this map is marked by the appearance of both continuum emission and strong [Ne III] (15.55 m) and weak [Ne V] (23.3 m) emission lines.
We also used archival IRS mapping data from the IRS Legacy SMC program (PI: Bolatto). These maps were made for large regions of the SMC and included E0102. The observations used 1 cycle of 30 sec exposure time with 5 arcsec overlap, yielding a total of 60 sec per sky position. These mapping data were 6 times shallower than our GO IRS staring mode data.
We made a deep IRAC observation as a part of our GO program. The IRAC observations were made for a full array with 30 sec frame time and a 9 position random dither pattern, yielding 36 sec exposure per sky position. The data were taken on 2005 June 12. IRAC bands cover the wavelength ranges 3.2–4.0, 4.0–5.0, 5.0–6.4, and 6.4–9.4 m, respectively, with a FWHM of 1.7″.
3 Results
3.1 IRS Spectra: Continuum and Ejecta Lines
The IRS spectra of E0102 from the southeastern shell in Figure 3 show both line and continuum emission. The detected lines include [Ne II] (12.8 m), [Ne V] (14.3 m), [Ne III] (15.5 m), [Ne V] (24.3 m), [O IV] and/or [Fe II] (26 m), and [Ne III] (36.07 m). The local-background subtraction effectively removed the [S III] (33.5 m), [Si II] (34.8 m), and [S III] (18.7 m) lines, but this background is likely to be contaminated by the nearby H II region of N76. When we generated a [Si II] map from the IRS cube, E0102 appeared as a [Si II] emitter. The lack of clean local background data thus makes it unclear whether there are actually any S and Si lines associated with E0102. The position-wavelength LL maps in Figure 5 show that the SNR E0102 emits continuum emission, [Ne V], [Ne III], and [O IV](or [Fe II]). The 26 m blend is likely to be dominated by [O IV], and unlikely to contain any [Fe II], because other [Fe II] lines such as those at 17.9, 6.7, and 5.3 m are not detected. The infrared spectrum of E0102 is thus dominated by Ne and O lines.
The detected lines and their brightnesses are summarized in Table 2. We measured the line brightnesses using two methods: a Gaussian fitting, and integration of line fluxes over wavelength ranges. The latter is required in order to account for red- and blue-shifted velocity dispersions. To obtain unreddened line brightness, we used an extinction value (Av) of 0.08 mag (Blair et al., 1989), which is equivalent to 2 (8) 1020 cm-2. This value is consistent with those of X-ray measurements (Sasaki et al., 2006). The extinction corrected values of Aλ are also shown in Table 1. Because the extinction is very small, the unreddened line brightnesses differ by less than 0.3%.
The E0102 spectrum shows a dust feature between 16 and 20 m peaking at 18.5 m (we call it the 18 m-peak dust feature, hereafter). This feature occurs in the wavelength range of a prominent silicate feature, but it is very broad and extends to shorter wavelengths. We present a multi-composition fit in §4.1.
3.2 IRAC images
Faint emission, particularly from the southeastern shell, is seen in our IRAC 8 m image of E0102; the 8 m emission corresponds well with the MIPS 24 m emission, as shown in Figure 6. The flux range in the image is 0.15-0.2 MJy sr-1. However, there is also some 8 m polycyclic aromatic hydrocarbons (PAH) emission from the nearby H II region of N76 to the southwestern side of the SNR and a large patch of diffuse emission outside the southwestern shell of the SNR. We did not detect 8 m emission with IRS, but IRS has poorer sensitivity than IRAC, with a limit of 0.24 MJy sr-1 for our IRS staring observation compared to 0.15 MJy sr-1 for IRAC. Because the IRAC flux is measured relative to the nearby background, we believe that the IRAC 8 m emission detected towards E0102 comes from the SNR. Moreover, dust emission is expected in the ejecta and any emission from E0102 at 8 m is likely to be continuum emission. A deep IRAC image, or a more sensitive observation with future missions may be helpful in unambiguously determining if E0102 does emit at 8 m. No emission of E0102 at 3.6, 4.5 and 5.8 m is detected.
3.3 Line and Dust Maps
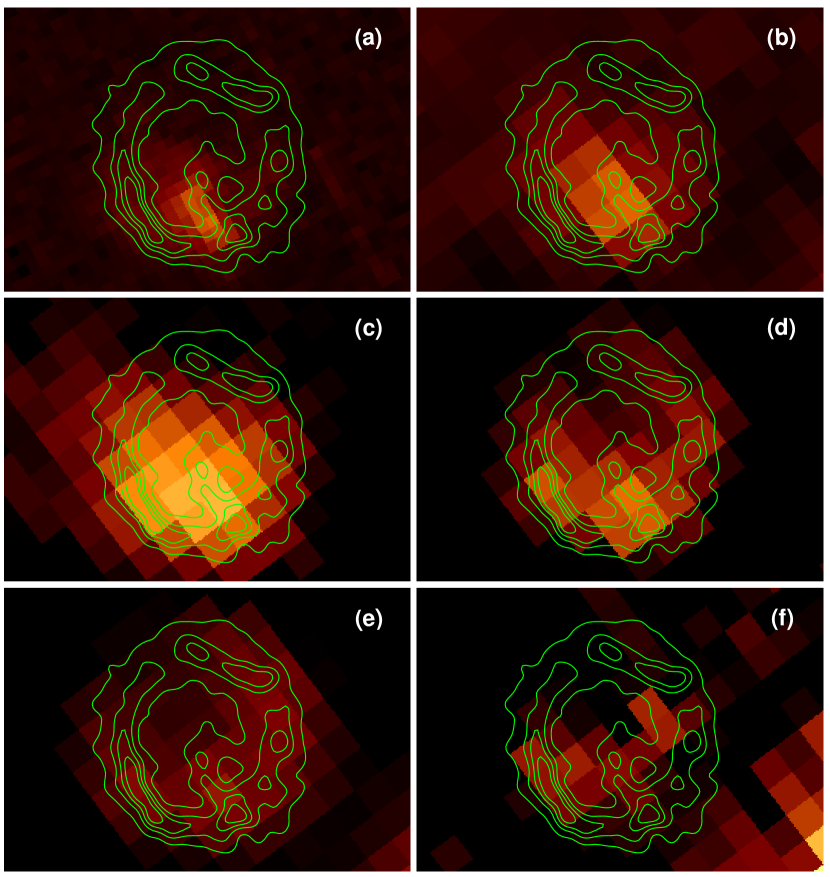
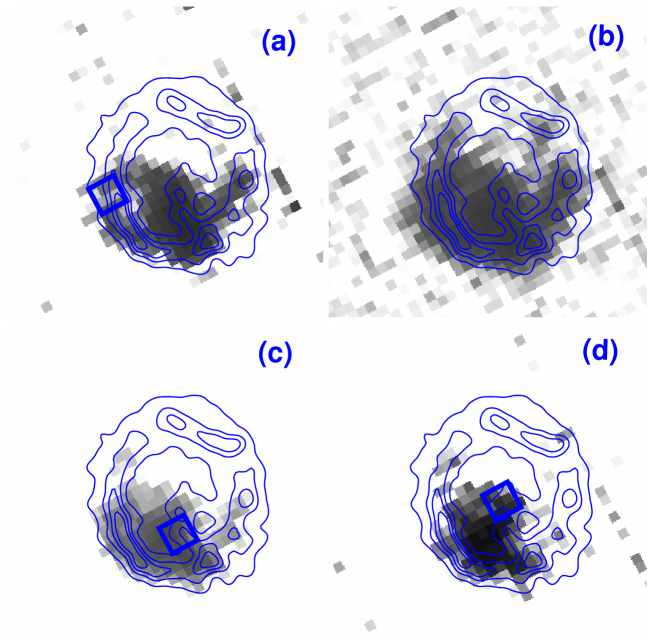
We generated line and continuum maps using the IRS mapping data, which covered the SNR E0102 and the nearby H II region N76. The maps are shown in Figure 7. The line maps were generated for [Ne II], [Ne III], [O IV] and [S III] by subtracting the continuum baselines at neighboring wavelengths. Infrared ejecta emission from [Ne II], [Ne III], [O IV] and [Si II] (Figure 7) coincides with the optical [O III] ejecta emission as well as with X-ray ejecta emission. In spite of the lower angular resolution for the infrared images, this can be seen clearly in the overlay of the [Ne II] image with the optical [O III] contours (from Blair et al. 1989) and the X-ray Chandra image (Gaetz et al., 2000) in Figure 8 . The infrared emission is strong at the southeastern shell and center, both of which coincide with ejecta emission seen in X-ray and optical images. The infrared line emission is weaker in the northern and northwestern regions, which are, however, also associated with X-ray emitting ejecta. The ejecta line profile of the northwestern region shows significant line-broadening (see §3.4 for details). The infrared continuum image is most similar to the infrared [O IV]+[Fe II] (at 26 m) line image, except in the northwestern shell. However, this continuum emission at the northwestern shell nicely follows the X-ray ejecta shell as shown in Figure 7d, and is located inside the forward shocked material traced by the radio shell (see Figure 1). The dust emission is thus seen to be spatially correlated with the ejecta emission.
We compared the line and continuum maps of E0102 with those of the H II region, N76, to its southeast (see Figure 9), in order to examine their infrared colors and to assess the effect of background contamination by N76. E0102 shows stronger [Ne II] and weaker [O IV] emission than N76. The Ne lines of the SNR are thus confidently measured. The continuum and [S III] emission of N76 is strongest at its outer edge, while [O IV] is strongest at the inner shell of N76, as shown in Figure 9. Since E0102 has its strongest [Ne II], [O IV], and dust continuum emission in the southern and eastern parts, we are confident that the Ne, O and continuum measurements are not contaminated by N76. The [S III] line image shows that the SNR also emits [S III] emission as well as the H II region. Therefore, the [S III] line in the IRS spectra likely belongs to the SNR. We use the spectrum without local-background subtraction in Figure 4 for the spectrum of E0102, but the difference from the local-background subtracted spectrum is used in estimating the uncertainty of the spectrum.
Infrared ejecta seem to most closely correlate with optical emission. Figure 8 demonstrates the correlation among the X-ray, optical and three of our infrared ejecta maps. Infrared [O IV] is a fair direct comparison to the optical [O III] line maps, but the [O IV] image has a factor of few worse angular resolution than that of the [Ne II] image. [Ne II] and [O IV] correlate with optical [O III] images in the southwestern shell and center. It is likely the infrared ejecta are denser, cooler ejecta than the optical ejecta. In the future, the infrared and optical data should be combined to more accurately estimate of the ejecta mass, because a wide range of ionization states are observed in the remnant. However, it will be more meaningful to combine them within similar resolution images, since the ejecta knots have very small scales not only in optical but also in infrared as shown in the case of Cas A (Ennis et al., 2006). The dust continuum emission correlates with [O III] and X-ray emission for most of E0102 as well as with infrared ejecta in the southwestern and central parts of the SNR. This may indicate that the freshly formed dust is correlated not only with infrared ejecta, but also with optical and X-ray ejecta (recall that the infrared continuum shell is still located inside the forward shock so it is less likely due to CSM/ISM material). Dust forms in the ejecta when the gas cools below a temperature of 1000-2000 K. After the reverse shock encountered the ejecta, it sufficiently heated both gas and dust, which emit the infrared emission lines and continuum, respectively.
3.4 Doppler-shifted lines and maps
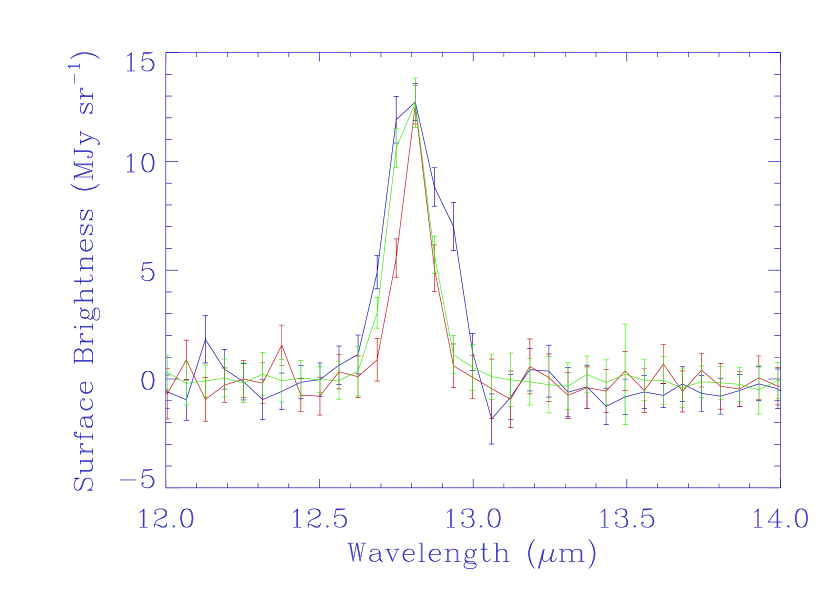
The measured [Ne II] line width of the staring-mode spectrum (SE shell position in Figure 2) is 0.15290.0023 m (Table 3). To examine the velocity broadening, we extracted SL1 spectra from three additional positions in E0102–center, east, and Scenter (see the boxes of Figure 10). The three spectra show different line widths, as shown in Figure 11. The doppler-shifted line maps in Figure 10, with the locations of the three spectra overlaid show that the central position has both blue- and red-shifted emission, while the eastern position has blue-shifted emission. The properties of the line widths at these positions are summarized in Table 3. At the center, the measured 0.12 m line width is comparable to those measured for the [Ne II] calibration sources G333.9, NGC6720 and NGC7293. By contrast, the widths in the center and E spectra do indicate line-broadening.
Fitting one Gaussian component, the line widths correspond to velocity dispersions of 5226304, 357954 km s-1, and 343364 km s-1 for the center, SE shell, and E, respectively. After taking into account the spectral resolution, we can estimate the true velocity dispersion for each position (Table 3). The center, E and SE shell positions show the true velocity dispersion of 4446, 2060, and 2295 km s-1, respectively. The observed velocity shifts and dispersions are comparable to those from optical measurements from -2600 to 3640 km s-1 (Tuohy, 1983; Blair et al., 2000). The broad line profile for the center can also be fitted with two Gaussian components. Using a rest wavelength of [Ne II] of 12.8135 m, the ejecta material must then be red-shifted by 2615 km s-1 and blue-shifted by 641 km s-1. A confirmation with higher-spectral resolution data is desirable because of the limited spectral resolution of IRS low-resolution spectra.
3.5 Ne Line-Flux Ratio
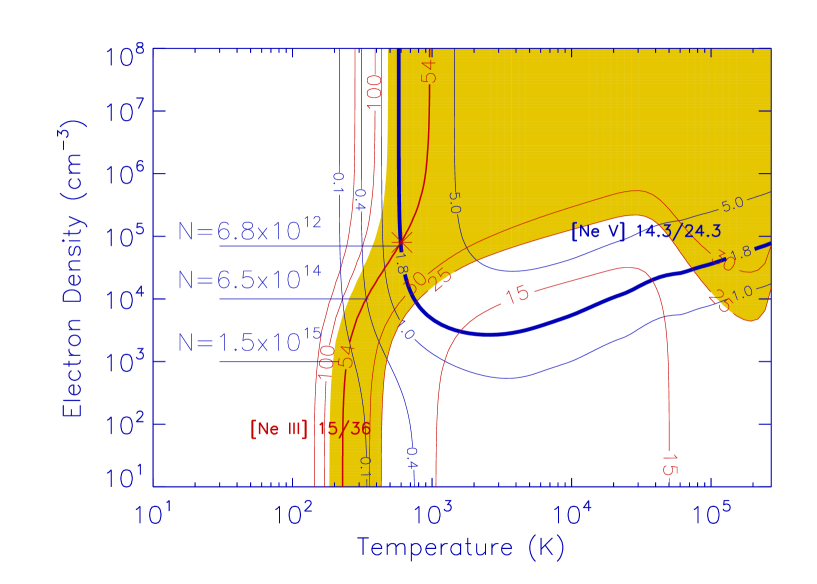
In the line list in Table 2, the ions [Ne III] and [Ne V] offer pairs of lines which are suitable for line diagnostics in order to constrain densities and temperatures. The measured line flux ratios for [Ne V] 14.3/24.3m are 1.760.11, and for [Ne III] 15.6/36 m 5428. The ratio 15.6/36 m is assigned an additional 50% systematic error for the 36 m line intensity, because this line falls on the degrading part of the array. To constrain temperatures and densities, we calculate the line intensities and ratios of [Ne V] and [Ne III]. We solve the excitation-rate equations including collisional and radiative processes as a matrix using 5 energy levels for [Ne V] and 3 levels for [Ne III]. The input atomic data were taken from Griffin & Badnell (2000)222see http://www-cfadc.phy.ornl.gov/dataandcodes/aurost/aurostexcit/ and include temperature-dependent collisional strengths. The solutions of the [Ne V] line diagnostics differ between the newer temperature-independent collisional strengths of Griffin & Badnell (2000) and older values (e.g., Osterbrock, 1989), while those of [Ne III] are almost the same. The line diagnostics are shown in Figure 12. The density and temperature jointly obtained from the ratios of [Ne V] and [Ne III] are 7104 (9000) cm-3 and 612 K, when assuming that both [Ne III] and [Ne V] gas come from the same gas. Such a high density seems to be characteristic of SN ejecta as observed in optical lines; Chevalier & Kirshner (1979, 1978), for example, suggested that the optical [S II] line in Cas A originated from ejecta with a density of 105 cm-3.
4 Discussion
4.1 Dust Spectral Fitting and Dust Mass of E0102
The IRS spectra of E0102 have a prominent dust feature peaking at 18 m which coincides spatially with the emission from the infrared-emitting ejecta. This is clear evidence that dust is forming in the ejecta. To determine the dust composition and mass, we performed spectral fitting to the IRS dust continuum using the deep IRS spectra shown in Figure 3. Note that the wavelength range used for the fits is 5-40 m, and that only the continuum emission is used to estimate the dust mass.
First, we estimated the contribution of the synchrotron emission to the infrared spectrum using the radio fluxes and spectral index. The radio flux at 408 MHz is 0.65 Jy for the entire SNR (Amy & Ball, 1993). We measured the radio surface brightness at the IRS position to be 0.58 MJy sr-1 from the 408 MHz image of Amy & Ball (1993). For a radio spectral index (Amy & Ball, 1993), where , the expected synchrotron fluxes are , , and MJy sr-1 at 5, 20 and 35 m, respectively. This is a very small contribution to the infrared continuum (1%).
The dust continuum was then modeled with the Planck function multiplied by the absorption efficiency () for various dust compositions, with the amplitude and temperature of different components allowed to vary. The fitting technique and mass estimation method is the same as that was used for Cas A (Rho et al. 2008). The spectrum shortward of 10 m is highly uncertain due to background subtraction and instrumental noise. Three dust components are needed to fit the IRS spectrum of E0102.
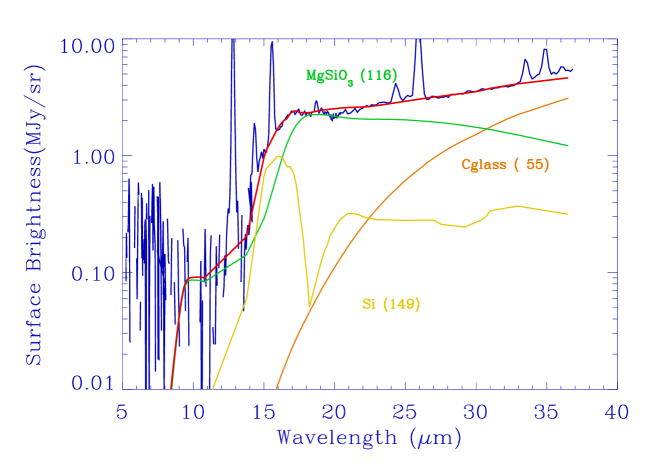
The 18 m-peak dust feature includes silicates, but it cannot be reproduced by the combination of C, Mg-rich silicates, and Al2O3 grains that are most likely to be associated with the Ne- and O-rich ejecta. A component with a feature around 16 m is also needed. Candidates include MgO and Si. Whereas the MgO feature calculated using the optical constants of Hofmeister et al. (2003) turns out to be too narrow, amorphous Si, which can condense in the C-rich layer in the primordial SNe II (Nozawa et al., 2003), can successfully reproduce the observed feature.
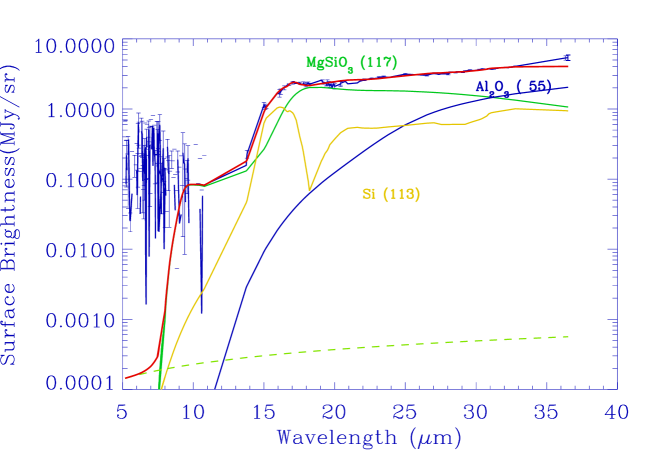
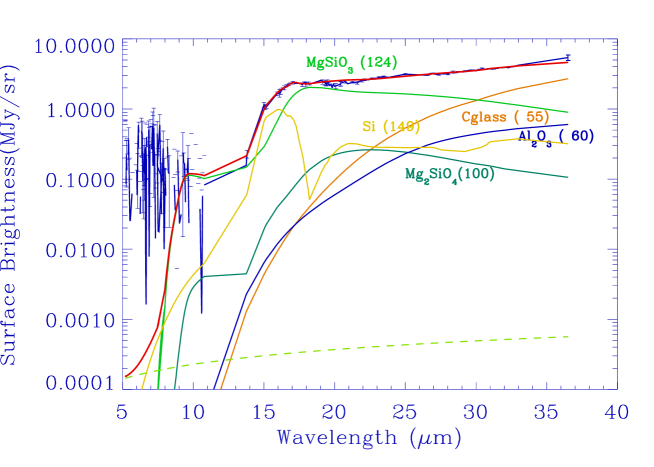
The rest of the continuum requires either carbon (Model A) or Al2O3 (Model B) dust, as shown in Figures 14 and 15. We favor carbon or Al2O3 over solid Fe dust, because we expect carbon or Al2O3 dust to be present where the Ne and O ejecta lines are dominant: Ne, Mg, and Al are all carbon-burning nucleosynthesis products (Woosley, 1995). MgSiO3 and Al2O3 are condensed in the ejecta of Ne, Mg, and Al, which are also carbon-burning products; the O and Al are found in the outer layers of ejecta, which is where Si and carbon dust grains condense. The dust and ejecta compositions seen in E0102 are similar to those of the weak 21 m dust layer in Cas A (Rho et al., 2008). E0102, however, does not have the same silicate dust features seen in Cas A. Also, unlike Cas A, the dust composition in different ejecta layers in E0102 cannot be spatially resolved, at least partly because observations of E0102 suffer from limited angular resolution due to its 18-times greater distance.
The dust compositions, temperatures, and masses obtained from the best fits are summarized in Table 4. The estimated dust masses within the IRS observed slit are 5.010-3 and 5.510-3 M⊙ for Models A (carbon) and B (Al2O3), respectively. To determine the sensitivity to dust temperature, in Model C we performed the fit allowing the temperature of Al2O3 to vary independently. Model C produced a low temperature ( K) that cannot be constrained by our spectra, which lack long-wavelength data; therefore, we don’t consider Model C further and fixed the temperature of Al2O3 in Model B to that of carbon in Model A. To explore the effect of including many minerals, in Model D we performed a fit including all the most common dust compositions (i.e., MgSiO3, Si, Al2O3, carbon, and Mg2SiO4; see e.g.T01, N03). The mass is relatively well constrained by the observations (within 20-40%). The fit of Model D is shown in Figure 16. However, the reduced is still relatively high, largely due to the residuals near where the gas lines were subtracted. (Note that some of lines show kinematic broadening.)
To estimate the total dust mass, we correct the observed mass (within the high-sensitivity spectral slit) for the fraction of the SNR covered by the IRS slit using a continuum map (between 21 and 23.5 m) generated from the lower-sensitivity spectral cube. This approach is justified because the spectra from the cube did not show significant variation across the SNR. The correction corresponding to the total flux of the entire SNR relative to the flux of the regions covered by the IRS slit is a factor of 2.9. The total dust masses for the entire SNR are then 0.015, 0.007, and 0.014 M⊙ for Models A, B, and D, respectively. We favor Models A or D over Models B or C, because the temperature of Al2O3 could not be constrained.
MgSiO3, Al2O3 and carbon are major dust species predicted to be produced in the ejecta of SNe by both Todini & Ferrara (2001); Nozawa et al. (2003). Note that presolar Al2O3 grains from meteorites have been inferred to be among the most abundant isotopically-enriched materials ejected by Type II SNe (Clayton et al., 2004). In terms of amorphous Mg2SiO4 versus MgSiO3, the young SNRs Cas A (Rho et al., 2008) and SN 2006jc (Nozawa et al., 2008) also show a larger mass of MgSiO3 than Mg2SiO4, whereas Nozawa et al. (2003) and Todini & Ferrara (2001) predict the reverse. This may suggest that the chemical network favors MgSiO3 over Mg2SiO4.
4.2 Ionization States of Ne
Column densities for [Ne III] and [Ne V] can be determined from the excitation matrix given by:
| (1) |
where is a line intensity between levels i and j, is a column density in the level i, is spontaneous radiation transition rate, is a column density in the level i, and is the energy difference between i and j levels. For level , the matix to solve the column density Ni is given by:
| (2) |
| (3) |
where is density, is temperature and and the collisional transition and deexcitation rates. The total column density of N = is obtained by solving the matrix. For example, the total column density of [Ne V] is the sum of all five levels as shown in Figure 13. For a temperature of 612 K and a density of 7104 cm-3, the column densities for [Ne III] and [Ne V] are 6.81012 and 5.91011 cm-2, respectively. We estimated the column density for a few sets of densities and temperatures implied by the observed [Ne III] ratio as shown in Figure 12, and found that the column density changes rapidly depending on the electron density as listed in Table 5. We also solved the excitation-rate equation using 2 energy levels for Ne II. The observed line brightness of [Ne II] can be used to estimate the ion column density to be 2.71013 cm-2. The column densities, ionization potentials, and critical densities of Ne are summarized in Table 5.
The nucleosynthetic yields of Ne trace the progenitor mass. In order to obtain the Ne ejecta mass, we must estimate the column densities of the remaining ionization stages of Ne. First we obtain the column densities when we assume local thermodynamic equilibrium, which is described below in this section. Later we use shock models to estimate the column densities of ionization states as described in §4.3.
The Saha equation is given by:
| (4) |
where N is the number density of atoms in the r (or r+1)th stage of ionization, and U is the partition function depending on the temperature, is the mass of the proton, T is the temperature in Kelvin, (IeV) is the ionization potential for r to (r+1) (in units of eV).
We estimated the column densities of [Ne I] and [Ne IV] using the Saha equation repeatedly as follows. First, we obtained a gas temperature of 5667 K by using the column densities of [Ne II] and [Ne III]. While this is a much higher temperature than obtained from the [Ne III] and [Ne V] line diagnostics, it is consistent with the error range for the line ratios (see Figure 12). Second, we estimated the neutral [Ne I] column density by using the column density of [Ne II] and a temperature of 5667 K. Third, we estimated the [Ne V] column density by using the temperature of 5667 K and the Saha equation, and found that the inferred [Ne V] column density was much smaller than the observed value of 5.81011 cm-2. This indicates that most of the observed column density of [Ne V] comes from a gas with a temperature different from 5667 K. An additional component with a temperature of 9100 K is required to fit the observed [Ne III] and [Ne V] column densities. The [Ne IV] column density is then obtained by interpolating between [Ne III] and [Ne V]. Figure 17 shows the column density for each ion of Ne from the two-temperature components derived here. Column densities for the remaining, more ionized Ne can be calculated for these two temperatures, and can be seen to fall rapidly with increasing ionization. We also estimated the column density of [Ne III] for (ne, T) = (104 cm-3, 350 K) and (103 cm-3, 215 K). We find that the column density varies depending on density, as summarized in Table 5 and Figure 12, and that it does not vary much with temperature. A lower electron density yields a higher column density.
4.3 Shock Model and Neon Mass
We have calculated radiative shock models for shocks in the velocity range of 50 - 500 km s-1. These models use many of the same assumptions used by Blair et al. (2000). In particular we use the same elemental abundances () and follow their approach of using a single ram pressure, , for each shock speed in the standard case. We also follow Blair et al. (2000) in using a magnetic field strength of G for our standard case. Blair et al. (2000) use the results of a range of shock models with shock velocities ranging from km s-1, weighting the emission by the fraction of the shock area that is assigned (by assumption) to each shock speed. We take the simpler approach of finding the best fitting single shock speed. In addition to the standard cases, we have calculated models with ram pressures that are larger by a factor of 1.5, 2 and 3 and with smaller magnetic field strengths, down by a factor of 2. The model calculations assume 1-D (plane parallel) steady flow and include non-equilibrium ionization, radiative cooling and magnetic pressure, . We also include photoionization from radiation generated in upstream gas and the accompanying heating. Since the region of strong ionizing radiation emission is mainly in the hot, ionized portion of the shock, while the region of substantial photoionization is downstream, this approach is satisfactory. In fact photoionization and heating are negligable within the X-ray/EUV emitting zones where K. These calculations make use of a revised version of the Raymond & Smith (1977) plasma emission code for the calculation of the hot, ionized post-shock zone and the cooling zone in which the gas temperature drops sharply to K.
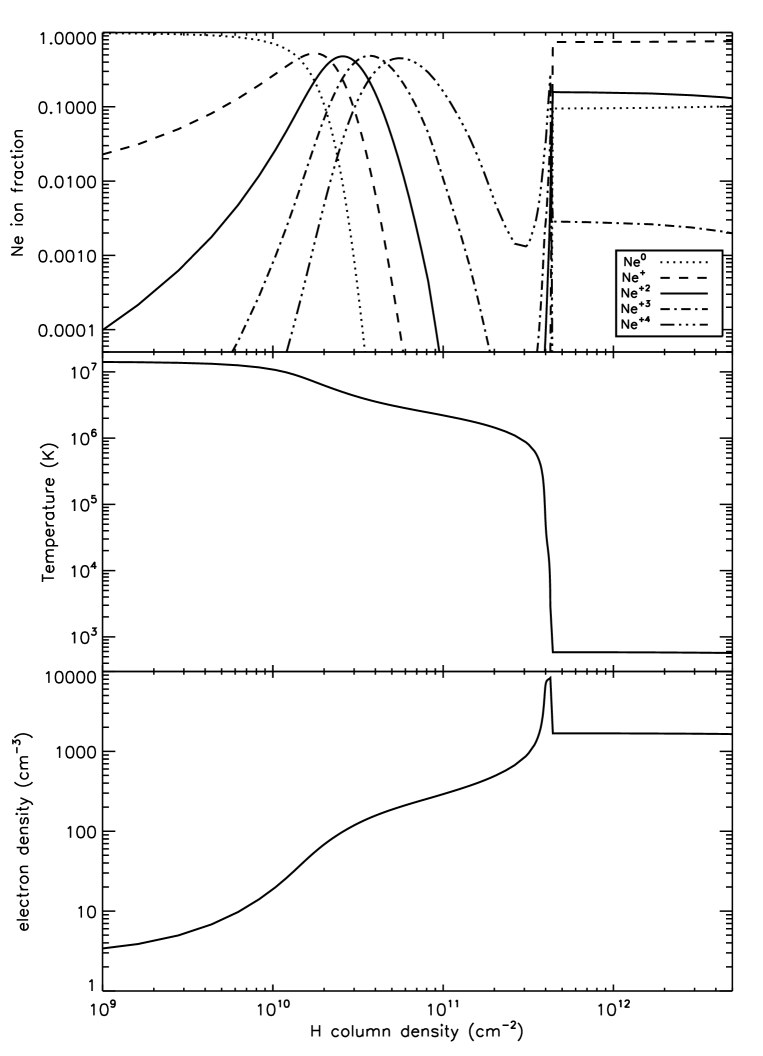
For the calculation of the photoionized zone, we use the Cloudy code (version 07.02.02 of the code last described by Ferland et al., 1998) with the incident radiation field taken to be the ionizing radiation field generated in the hot, collisionally ionized and cooling zones (as calculated using the R&S code). We show an example of the ionizing radiation field in Figure 18. Cloudy assumes thermal and ionization equilibrium (in contrast to our calculations using the R&S code), but this should not be a very bad assumption for the cool ( K), dense gas of the photoionized zone. The intensity of the ionizing radiation field depends on the geometrical factor, , related to the ratio of the lateral extent of the shock front to its thickness (see, e.g. Raymond, 1979). We have generally used in our calculations, but found the best agreement for a model with indicating small shock fronts as might be indicative of shocks propagating into clumps elongated in the radial direction. Figure 19 illustrates the Ne ionization and temperature for the two parts of the calculation for one model.
As illustrated in the figure, [Ne V] emission is entirely from the ionization and cooling zone, while [Ne II] and [Ne III] emission comes primarily from the low temperature, K, photoionization zone. The electron density and temperature derived in Figure 12 from the intersection of the [Ne III] and [Ne V] contours implicitly assumes a uniform temperature and density for the [Ne III] and [Ne V] emitting gas. Since the emission comes from different regions with different temperatures and electron densities, these diagnostics do not apply to emission from the shock.
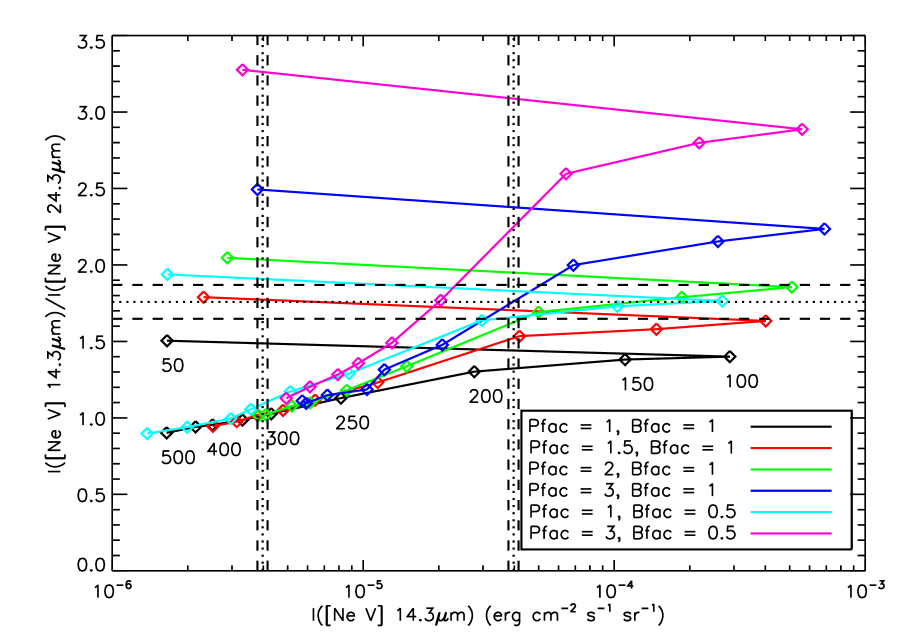
Under the assumption that the [Ne III] and [Ne V] emission comes from the same gas, we calculate the column densities of Ne I, Ne II and Ne III to be 71014, 3.51015, 6.51014 cm-2, respectively, and the total Ne column density to be 7.91016 cm-2. To use the results of our shock models we need to limit the extent of the photoionized zone. We use the total [Ne II] 12.8 µm emission to set the depth of the photoionized zone. The total [Ne V] emission is naturally limited by the size of the post-shock ionization and cooling zones. We find, however, that we are unable to match both the total surface brightness of [Ne V] 14.3 µm emission and the ratio of 14.3 µm/24.3 µm emission at the same time when the surface brightness is determined as in Table 2. Matching the line ratio requires lower shock speeds which in turn leads to more flux.
This problem can be overcome if the emission is clumped on scales unresolved by Spitzer. Table 2 uses the default angular extraction size (10″20″ for LL) to estimate the surface brightness, because the SNR structures were not resolved. However, we know from the other young SNRs that the angular size of ejecta emitting regions are generally much smaller than the implied pc. Therefore, we estimate the angular size (to get the solid angle) using a Ne image of Cas A (Rho et al., 2008). From this we estimate the filling factor of the Ne emission over the 20″10″ field of view to be in surface area. The [Ne V] 14.3 µm surface brightness of 3.97410-6 erg s-1 cm-2 sr-1 thus becomes 3.057(1)10-5 erg s-1 cm-2 sr-1 after the correction, where the errors are estimated using experiments with different surface brightness contours (the filling factor ranging from 0.1 to 0.2).
With the correction for the filling factor we find that we can match both the [Ne V] line ratio and fluxes for shock velocities of km s-1, though a better match is achieved for models with a higher, a factor of 3, ram pressure than the standard Blair et al. (2000) value, as shown in Figure 20. Using the filling factor correction and the best fitting model for the [Ne II] and [Ne V] emission, we find the column densities of [Ne I], [Ne II] and [Ne III] to be 1.51015, 7.81015, and 1.21015 cm-2, respectively, and the total Ne column density of 4.01016 cm-2. The column densities from different ionization states of Ne are summarized in Table 5.
4.4 Ne Ejecta Mass
From the column densities for each ion, we can readily calculate the Ne mass by summing over all the ions as:
| (5) |
where M is the total mass mass, is the column density of ion , is the mass of Ne, d is the distance and the emitting area. In our calculation, we used a wavelength dependent which is equivalent to the line extraction width (the approximate area of the LL extraction region is 10″20″). The mass corresponding to the column densities for each ion is also shown in Figure 17. The total derived Ne mass (within the IRS slit) inferred from excitation and Saha equations is 0.22 M⊙ for ne= 7104 cm-3 and T= 612 K, and 0.07 M⊙ for ne= 1103 cm-3 and T= 215 K, respectively. For the shock model we find a total mass in Ne of M⊙ which supercedes the derived values.
This is the mass enclosed by the IRS slit only, which is just a portion of the entire SNR. We make the correction for the entire SNR using the [Ne III] map at 15.5m. The total flux is 3.03 times larger than that covered by the slit, so we obtain a total Ne mass (for all ions including neutral Ne) in E0102 of M⊙ from the shock model.
We compared our derived Ne mass of E0102 with that of SN2005af at an epoch 214 days after the explosion as a rough consistency check. The Ne mass implied from [Ne II] line of SN2005af is 2.210-3 M⊙ (Kotak et al., 2006). We determine the [Ne II] mass in E0102 to be 310-3 M⊙ (from the shock model), which is within a factor of 1.5 of that determined for SN2005af, also a massive Type II SN. This is a relatively small disparity given that there may be differences in the progenitor mass, the respective physical conditions of Ne-emitting gas, and thermodynamic history of Ne gas, and also does not account for hotter and more ionized O ejecta that are observed at shorter wavelengths.
We detected no infrared H lines from E0102, though a few do fall in the IRS spectral band. H lines are present in the optical spectra of E0102, but it is not likely that they are associated with the supernova ejecta (Blair et al., 2000). For the purpose of estimating the Ne abundance relative to solar (or cosmic) values, however, we adopt the H line flux 5.9410-16 erg s-1 cm-2 and the upper limit of H line flux of 110-16 erg s-1 cm-2 reported by Blair et al. (2000) in order to obtain an upper limit on the H column density. At large optical depth, 4 j(H)/(Np Ne) is a constant for a given temperature that varies by only a factor of 5 over the relevant temperature range (Osterbrock, 1989). Taking the path length to be the aperture beam size of 1′′ (0.299 pc), the H column N is inferred to be 71013 cm-2. The Ne abundance in E0102 ([Ne/H]) using the Ne column density of 41016 cm-2 is then 1.9, while the solar value ([Ne/H]⊙) is 1.2, so [Ne/H]/ [Ne/H]⊙ 18 if the optical H is associated with E0102. More likely, that is not the case, so this is a lower limit for the abundance of Ne relative to solar values.
We also calculated the column density of [O IV] using 5 levels for [O IV] lines and the atomic data of Tayal (2006). The column density inferred from the observed [O IV] line brightness is 1.51013 cm-2. The equivalent oxygen mass is 8 M⊙. We also estimated the column densities and masses of [O I], [O II], [O III], and [O V] using the derived column density of [O IV], the Saha equation, and assuming that the oxygen gas has the same temperature as the Ne gas. The total mass of oxygen in the IRS aperture is thus inferred to be 0.26 M⊙. The calculated mass is quite sensitive to the second component temperature, however. For example, a temperature of 7000 K rather than 9100 K reduces the O mass a factor of two. The uncertainty in the estimated oxygen mass may thus be a factor of a few. To obtain the total oxygen mass for the entire remnant we scale the masses above by the same 3.30 multiplicative aperture correction factor used for Ne. The total oxygen mass estimated for the entire remnant is then approximately 0.78 M⊙, as shown in Table 7. Note that oxygen mass estimate is much less accurate than that of Ne because we only have one observed oxygen line.
4.5 Ejecta Mass and Nucleosynthesis Yields
It is evident that the infrared census of the Ne and O ejecta mass is incomplete because the ejecta that emit at optical and X-ray wavelengths are more ionized and at higher temperatures. Infrared emission traces dense and relatively low temperature ejecta as indicated by our line diagnostics, whereas X-rays trace much hotter and lower density coronal plasmas. The total neon and oxygen masses that we estimate from the infrared observations and shock models are compared to the nucleosynthesis yields of massive stars in Thielemann et al. (1996), Nomoto et al. (1997), and Chieffi & Limongi (2003) as summarized in Table 7.
The He- and H-like ions that dominate the X-ray emission are inferred to have masses of 2 M⊙ for Ne and 6 M⊙ for O in the Chandra study of Flanagan et al. (2004); these indicate a progenitor mass of 32 M⊙. These mass estimates, however, are subject to uncertainties in the composition of the underlying continuum. Flanagan et al. (2004) make their mass estimate assuming that the ejecta do not include light elements, but if this is not the case, Flanagan et al. (2004) note that the X-ray derived ejecta mass could be a factor of 20 lower, at 0.1 and 0.3 M⊙, for Ne and O, respectively. By comparison, our estimates for the Ne and O ejecta masses from the infrared observations are 0.042 M⊙ and 0.78 M⊙, respectively. In the optical/UV analysis of Blair et al. (2000), relative line strengths and shock models favor a progenitor of 25 M⊙, but no attempt is made to estimate ejecta masses for the entire remnant.
If we take the lower set of values for the X-ray emitting ejecta masses, we determine the total ejecta mass determined from the combined infrared and X-ray analysis to be 0.142 M⊙ for Ne and 1.08 M⊙ for O. Taking the higher X-ray values, these masses are 2.04 M⊙ for Ne and 6.8 M⊙ for O. As a comparison, the X-ray emitting Ne mass predicted by our shock model is 0.84 M⊙, though we note that this model was matched to the infrared Ne line emission only. Taken together, the inferred ejecta masses favor a progenitor mass of 30 (25 - 40) M⊙ as shown in Figure 21a and Table 7, but are not strongly constraining. The infrared Ne/O mass (0.13) ratio by itself favors a progenitor mass greater than 25 M⊙, as do the total masses of Ne and O when we take the lower range of the X-ray emitting ejecta mass corresponding to the presence of light elements in the ejecta. This is not surprising given that the infrared ejecta mass makes up a significant fraction of the total mass (30% for Ne, and 70% for O) if the X-ray ejecta masses are taken to be at this lower limit. Contrariwise, the infrared emitting masses make up a very low fraction of the total ejecta mass (2% for Ne and 12% of O) if we take the higher X-ray ejecta masses corresponding to pure heavy elements, and the inferred progenitor mass is then necessarily in agreement with that obtained in the X-ray analysis by Flanagan et al. (2004).
The set of line-emitting ejecta elements is very different for E0102 and Cas A, although both are young core-collapse SNRs with optical emission from high-velocity O ejecta. In E0102, the Ar lines are apparently absent in the infrared, and the Si and S lines are weak. Cas A, by contrast, shows very strong Ar emission as well as strong silicate (21 m-peak) dust emission (see the comparison in Table 6). In addition, Cas A shows unshocked, centrally located Si and S ejecta, whereas E0102 shows no indication of any unshocked ejecta. The differences in the X-ray line emission from these two remnants are in line with those seen in the infrared. E0102 is dominated by O and Ne (Flanagan et al., 2004; Sasaki et al., 2006), while Cas A is dominated by Si, S, Ar, Ca, and Fe. The ejecta temperatures in Cas A are higher, and presumably the O is too ionized to emit appreciable line emission, although Cas A is also subject to much higher interstellar absorption. And in spite of being considerably younger than E0102 (at an age of 330 yr), Cas A has a reverse shock that is already traversing the innermost ejecta layers. The key to this difference may be the extensive mass loss experienced by the Cas A progenitor, which probably had a binary companion (Young et al. 2006). Cas A is likely to have exploded at only 4 M⊙ after having started at 25 M⊙ on the main sequence (e.g., Laming & Hwang 2003). This difference in the mass loss history of the progenitors would also affect the supernova nucleosynthesis and subsequent evolution of the remnant.
It is thus possible that the explosion of E0102 simply did not produce a significant mass of Ar. Certainly, variations of factors of 5-20 in Ar mass are evident in various supernovae (for example, see the comparison of SN 2005af to SN 1987A and SN2004dj in Kotak et al. (2006)). Nucleosynthesis models likewise predict a wide range of Ar masses, with more massive progenitors producing significantly more Ar. The yields range from 0.001 to 0.07 M⊙ for 25-40 M⊙ progenitors, with corresponding Ar/Ne mass ratios of 0.001 – 0.1 (Figure 21). If we scale the predicted Ar/Ne mass ratios to the total infrared Ne ejecta mass of 6.5 M⊙, the models predict an infrared-emitting Ar mass between 6.5 to 6.5 M⊙.
We can use the detection limit of 310-8 erg s-1 cm-2 sr-1 for [Ar II] at 6.985 m to estimate the corresponding mass of Ar in E0102. Using two excitation levels of Ar, the column density of Ar is 11010 cm-2 if we assume that Ar is at the same temperatures as Ne. Since it is likely that the temperature and density could actually be quite different from those values, we consider a range of temperatures from 600 to 20,000 K and densities from 103 cm-2 to 105 cm-2. Including a factor of 3 correction for the IRS aperture, the final upper limit for the Ar mass ranges from 1.510-8 to 1 M⊙. The upper end of this mass range overlaps the range of the expected infrared-emitting Ar mass estimated above. It is thus plausible that the current non-detection of Ar is simply be due to limited sensitivity.
We cannot yet exclude the possibility that the infrared-emitting Ar are truly absent, however. The physical conditions of the infrared-emitting Ar are highly uncertain. Possibly, the reverse shock has simply not reached the deep layers containing Si, S, Ar, and Ca ejecta. It is also possible that the Ar might be detected in a more complete set of deep observations. While the IRS mapping data are too shallow to detect faint lines, the existing deep IRS staring mode spectrum covered only one-third of the remnant. Given that core-collapse remnants often show rather asymmetric ejecta distributions, it cannot be ruled out that deep observations at other positions in E0102 might reveal Ar ejecta.
4.6 [Ne V] lines: Comparison with Other Astronomical Objects
Among various astronomical objects, highly ionized [Ne V] is not commonly detected in the infrared because of its high ionization potential (97.11 eV), whereas lines of both [Ne II] and [Ne III] are common and often bright. In galaxies, the detection of [Ne V] 24.3 m line of comparable brightness to [Ne II] is often taken as a signature of active galactic nuclei (Armus et al., 2007) because [Ne V] cannot be readily produced by O stars. In the Galaxy, planetary nebulae emit [Ne V] lines which are produced by white dwarfs with high temperatures (Rubin, 2004; van Hoof et al., 2000; Rubin et al, 1997). E0102 is the first SNR which is identified as an infrared [Ne V] emitter.
Here, we compare the physical conditions of ionic line emitting material such as [Ne V] in the ejecta of E0102 with those of other astronomical objects. The [Ne V] 14.3/24.3m ratio of 1.76 is similar to many planetary nebulae (Rubin, 2004), an example of which is NGC 7027. E0102 falls at the extreme high end of the range (0.2 to 1.8) observed in active galactic nuclei (Dudik et al., 2007; Sturm et al, 2002). Both our (see Figure 12) and Dudik et al.’s calculations use the same collisional strengths from Griffin & Badnell (2000), and we are able to reproduce the [Ne V] 14.3/24.3 m ratio plot (Figure 1 of Dudik et al., 2007). Our measurements of [Ne V] ratios are not affected by the extinction correction, because the intrinsic extinction correction is very low at less than 0.1% for E0102. In the SNR E0102, [Ne V] lines come largely from collisionally ionized and radiatively cooling zones, whereas [Ne II] is dominantly from the photoionized zone. In active galactic nuclei, both [Ne V] and [Ne II] lines are shown to be from photoionization. The ratio of [Ne V]/[Ne II] is only 0.06 for E0102 and about 1 for AGN.
4.7 Dust Mass and Implication of Supernova Dust in Early Universe
Our dust masses for E0102 are 8-18 times greater than the mass estimated by Stanimirovic et al. (2006) from MIPS imaging, but the latter assumes a temperature of 120 K and typical interstellar dust composition. The inferred dust mass will depend on the composition and temperature of the dust, which can only be accurately identified with spectral data such as the IRS data used here. The difference between our dust mass for E0102 and that of Stanimirovic et al. (2006, hereafter S06) thus arises from a number of factors. First, the IRS spectra indicate that there are three composition and temperature components. While two of the three components have temperatures comparable to the 120 K assumed by S06, the third component had a much lower temperature (55-60 K), and as shown in Table 4, dominates the mass. Moreover, because of the differences in dust composition assumed, there are differences in the absorption coefficients used and also in the inferred density; the latter are generally higher for the grains we used here, with MgSiO3, and Al2O3 having solid-state densities of 3.2 and 2.45 g cm-3, respectively, compared to more typical ISM grains, e.g., graphite with = 2.25 g cm-3.
Our estimated dust mass is also higher than those generally inferred for supernovae. Possibly, it is easier to detect dust in young SNRs than in extragalactic SNe simply because the dust in SNe is too cold to be detected in the infrared by Spitzer, whereas the freshly synthesized dust in young SNRs has been heated by the reverse shock to observable temperatures. Another limitation for estimating the dust mass of extragalactic SNe is that the spatial resolution currently available with IR telescopes for observing supernovae is still poor, and that makes it difficult to distinguish between fresh dust formed in the ejecta and ISM/CSM dust. In the case of E0102, we were able to resolve and separate the ejecta and the forward shocked materials, and found no significant infrared emission from the ISM heated dust.
The estimated total dust mass of 0.007 to 0.015 M⊙ for E0102 is a factor of 3 lower than the mass (from 0.02 to 0.054 M⊙) of Cas A (Rho et al., 2008), though of the same order of magnitude. We discuss a few possibilities for the discrepancy between our estimated dust mass from E0102 and the dust mass per SN predicted by models (e.g. Todini & Ferrara, 2001; Nozawa et al., 2003) to account for the dust in high red-shifted galaxies. First, there may be more mass in dust at lower temperatures. Our wavelength coverage is only up to 40 m, and the MIPS 70 m emission has not been detected due to confusion with the nearby H II region of N76 and the limited spatial resolution of the 70m image, as shown by Stanimirovic et al. (2006). We could not constrain a temperature of 41 K with our IRS data, as shown in Model C of Table 4. Even if colder dust (55 K) exists, our observations would not be sensitive to it. The colder dust components have been detected in Cas A and Kepler (Dunne et al. 2009; Gomez et al. in preparation) suggests that they could be present in other SNRs. Second, there are large uncertainties in dust destruction rates. The dust mass of Cas A may explain the lower limit on the dust masses in high redshift galaxies, when assuming conservative dust destruction rates (Rho et al., 2008; Morgan & Edmunds, 2003). When a more moderate destruction rate is taken account, a much higher dust mass per SN is needed to explain the dust in the early Universe (Dwek, Galliano, & Jones, 2007; Galliano, Dwek, & Chanial, 2008). The grain disruption which occurs primarily in SN-shocks is known to be too efficient to explain the amount of dust in the ISM (Jones et al., 1994). However, new infrared observations of SN 1987A suggest that the destruction rate of the silicate grains is a factor of 2 smaller than previous values (Dwek et al., 2008), and that micro-sized grains can survive the passage of a SN shock wave (Slavin, Jones, & Tielens, 2004). Third, an inaccurate estimation of progenitor masses from ejecta could cause the discrepancy, since the IMF of massive stars is rather steep. As discussed in §4.5, progenitor mass depends on accurate estimates of ejecta masses over a broad range of wavelengths. Fourth, if E0102 contains Fe-bearing dust, the dust mass would be higher because the density of Fe dust ( = 7.95) is three or more times higher than other grains. Since Fe dust (due to the shape of Qabs) is featureless like carbon and similar to that of Al2O3 at low temperatures ( 100 K), it is difficult to distinguish between Fe, C and Al2O3. While we assume no Fe dust because Fe gas lines are not detected, a small contribution of Fe could significantly increase the dust mass. Fifth, some grain types may be larger than assumed, which would increase the inferred mass. Sixth, smaller-sized dust in the ejecta is preferentially destroyed behind the reverse shock as demonstrated by Nozawa et al. (2007); in the case of E0102, this has been ongoing for 1000 yrs. Deep observations with future telescopes, in particular, far-infrared/submm observations and theoretical models of the time evolution of dust that is formed in the ejecta would be needed to settle this issue.
5 Summary
Using Spitzer IRS and IRAC, we have carried out a study of the infrared emission from dust and ejecta in E0102. Our results may be summarized as follows:
1. We have detected infrared emission from E0102 in both continuum and lines. These include bright lines of [Ne II] (12.8 m), [Ne III] (15.5 m), [O IV] and/or [Fe II] (26 m) [O IV] and/or [Fe II] (26 m), weak lines of [Ne V] (14.3 m), [Ne V] (24.3 m), and [Ne III] (36 m), and possibly [SII], [SIII] (33.5 m), [SiII] (34.89 m). The ejecta in E0102 are dominated by Ne and O in the infrared, as in the X-ray and optical.
2. The [Ne II] lines are broadened by 20 -100 % above the instrumental resolution, implying a true velocity dispersion of about 2000-4500 km s-1. This is comparable to velocities measured for the optically emitting ejecta, and indicates that the infrared [Ne II] emission is also from ejecta.
3. The density of the infrared-emitting Ne ejecta is high. The collisionally excited line diagnostics using [Ne V] and [Ne III] line ratios imply that [Ne III] lines come from a low (600 K) temperature and [Ne V] lines from high density region. A shock model with a best velocity parameter of 200 km s-1 indicates that the [Ne V] lines mainly come from the cooling zone, which is hotter dense region, whereas [Ne II] and [Ne III] lines are mainly from the photoinization zone with a cold temperature of 400 - 1000 K.
4. We detect a broad dust feature at 18 m, that we attribute to MgSiO3 and Si; the remainder of the dust continuum can be fitted with either carbon or Al2O3 grains. The spatial correspondence of the dust continuum and the ejecta lines indicates that the dust is freshly formed in the ejecta.
5. The continuum show strong correlation with ejecta of E0102, showing that dust has formed in the ejecta. We estimate a dust mass of to 0.015 M⊙ that is higher than previous estimates by an order of magnitude, but smaller than that of Cas A.
6. We estimate the mass of infrared-emitting Ne and O ejecta. We estimate infrared emitting Ne ejecta mass of 0.014 M⊙ and a total Ne mass of 1.26 M⊙ derived from the best shock models. Together with the X-ray masses, these imply a progenitor mass of 30 M⊙.
For the future, detailed modeling to obtain accurate ejecta masses for young remnants such as Cas A and E0102 will be helpful to understand the production of elements such as Ar deep in the ejecta and their physical conditions in the remnant. More broadly, the goal is to understand the progenitors and the explosions that produced these remnants. Infrared observations with Spitzer and ISO have allowed us to identify dust features in SNRs and SNe including Cas A and E0102. However, the presence of cold dust, which can be only identified in the far-infrared and submm, is still uncertain due to limited angular resolution at these wavelengths. In the near-future, we expect Herschel observations will significantly advance our knowledge of cold dust. Sensitive observations will be very helpful to find and study the ejecta, so deep infrared mid- and near-infrared observations with Spitzer and with future missions such as JWST will significantly advance our understanding of the questions of nucleosynthesis and dust formation in supernova explosions.
References
- Amy & Ball (1993) Amy, S. W., & Ball, L., 1993, ApJ, 411, 761
- Arendt et al. (1999) Arendt, R. G., Dwek, E., & Moseley, S. H. 1999, ApJ, 521, 234 (ADM)
- Armus et al. (2007) Armus, L. et al., 2007, ApJ, 656, 148
- Beelen et al. (2006) Beelen, A. et al., 2006, ApJ, 642, 694
- Bertoldi et al. (2003) Bertoldi, F., Carilli, C. L., Cox, P., Fan, X., Strauss, M. A., Beelen, A., Omont, A., Zylka, R., 2003, A&A, 406, L55
- Bianchi & Schneider (2007) Bianchi, S., & Schneider, R., 2007, MNRAS, 378, 983
- Bianchi (2009) Bianchi, S., 2009, Cosmic Dust-Near & Far, Heidelberg, Germany
- Blair et al. (1989) Blair, W. P., Raymond, J. C., Danziger, J., Matteucci, F., 1989, ApJ, 333, 812
- Blair et al. (2000) Blair, W. P. et al. 2000, ApJ, 537, 667
- Borkowski & Shull (1990) Borkowski & Shull, 1990, ApJ, 348, 169
- Bouchet (2006) Bouchet, P., Dwek., E., Danziger, J., Arendt, R. G., De Buizer, I. J. M., Park, S., Suntzeff, N. B., Kirshner, R. P., & Challis, P., 2006, ApJ, 650, 212
- Chevalier & Kirshner (1979) Chevalier, R. A. & Kirshner, R. P., 1979, ApJ, 233, 154
- Chevalier & Kirshner (1978) Chevalier, R. A. & Kirshner, R. P., 1978, ApJ, 219, 931
- Chieffi & Limongi (2004) Chieffi, A. & Limongi, M., 2004, ApJ, 608, 405
- Clayton (1982) Clayton, D.D., 1982, Lunar and Planetary Science Conference, 12th, Houston, TX, March 16-20, 1981, Proceedings. Section 2. (A82-31677 15-91) New York and Oxford, Pergamon Press, 1982, p. 1781-1801.
- Clayton et al. (1997) Clayton, D.D., Arnett, Kane, J., & Meyer, B.S. 1997, ApJ, 486, 824
- Clayton et al. (2004) Clayton, D.D. & Nittler, L. R., 2004, ARA&A, 42, 39
- Deneault, Clayton, & Heger (2003) Deneault, Ethan A.-N., Clayton, Donald D., & Heger, A., 2003, ApJ, 594
- Deneault, Clayton, & Meyer (2006) Deneault, Ethan A.-N., Clayton, Donald D., & Meyer, Bradley S., 2006, ApJ, 638, 234
- Dudik et al. (2007) Dudik, R. R, Weingartner, J.C., Satyapal, S.,Sisher, J., Dudley, C.C., & O’Halloran, 2007, ApJ, 664, 71
- Dunne et al. (2003) Dunne, L., Eales, S., Ivison, R., Morgan, H., & Edmunds, M. 2003, Nature, 424, 285
- Dunne et al. (2009) Dunne L., Maddox, S. J., Ivison, R. J., Rudnick, L., Delaney, T. A., Matthews, B. C., Crowe, C. M., Gomez, H. L., Eales, S. A., Dye, S., 2009, MNRAS, 394, 1307
- Draine & Lee (1984) Draine, B. T. & Lee, H. M., 1984, ApJ, 285, 89
- Dwek, Galliano, & Jones (2007) Dwek, El, F. Galliano, & A., Jones, 2007, Il Nuovo Cimento B, 122, 959
- Dwek et al. (2008) Dwek., E. et al., 2008, ApJ, 676, 1029
- Ellison, Drury, & Meyer (1997) Ellison, D. C., Drury, L. O., & Meyer, J. 1997, ApJ, 487, 197
- Elmhamdi et al. (2003) Elmhamdi, A., et al. 2003, MNRAS, 338, 939
- Ennis et al. (2006) Ennis, J. et al., 2006, ApJ, 652, 376
- Ercolano et al. (2007) Ercolano, B., Barlow, M.J., & Sugerman, B. E. K., 2007, MNRAS, 375, 753
- Ferland et al. (1998) Ferland, G. J., Korista, K. T., Verner, D. A., Ferguson, J. W., Kingdon, J. B., & Verner, E. M. 1998, PASP, 110, 761
- Finkelstein et al. (2006) Finkelstein, S. L. et al., 2006, ApJ, 641, 919
- Flanagan et al. (2004) Flanagan, K. A., Canizares, C. R., Dewey, D., Houck, J. C., Fredericks, A. C., Schattenburg, M. L., Markert, T. H., Davis, D. S., 2004, ApJ, 605, 230
- Gaetz et al. (2000) Gaetz, T. J., Butt, Yousaf M., Edgar, Richard J., Eriksen, Kristoffer A., Plucinsky, Paul P., Schlegel, Eric M., Smith, Randall K., 2000, ApJ, 534, L47
- Galliano, Dwek, & Chanial (2008) Galliano, F., Dwek, E., & Chanial, P., 2008, ApJ, 672, 214
- Griffin & Badnell (2000) Griffin, D. C. & Badnell, N. R., 2000, Atomic Mol. Opt. Physics, 33, 4389
- Hilditch, Howarth & Harries (2005) Hilditch, R. W., Howarth, I. D., & Harries, T. J. 2005, MNRAS, 357, 304
- Hofmeister et al. (2003) Hofmeister et al. 2003, MNRAS 345, 16
- Hughes et al. (2000) Hughes, J.P., Rakowski, C.E. & Decourchelle, 2000, ApJL, 543, 61
- Jones et al. (1994) Jones A. P., Tielens A. G. M., Hollenbach D.J., McKee C.F., 1994, ApJ, 433, 797
- Krause et al. (2004) Krause, O., et al., 2004, Nature, 432, 596
- Kotak et al. (2006) Kotak, R. et al. 2006, ApJ, 651, L117
- Kozasa et al (1989) Kozasa, T., Hasegawa, H., Nomoto, K., 1989, ApJ, 344, 325
- Kozasa et al (1991) Kozasa, T., Hasegwaa, H., & Nomoto, K., 1991, A&A, 249, 474
- Kozasa (2009) Kozasa, T., Nozawa, T., Tominaga, N., Hideyuki, U., Maeda, H., Nomoto, K., 2009, in Cosmic Dust-Near and Far, eds Th. Henning, E. Grun, & J. Steinacker, ASP Conf. Ser., in press, available at arXiv0903.0217v2
- Keller & Wood (2006) Keller, S. C., & Wood, P. R. 2006, ApJ, 642, 834
- Lagage et al. (1996) Lagage, P. O., Claret, A., Ballet, J., Boulanger, F., Cesarsky, C. J., Cesarsky, D., Fransson, C., Pollock, A. 1996, A&A, 315, L273
- Laming & Hwang (2003) Laming, J. M. & Hwang, U., 2003, ApJL, 597, 347
- Lucy et al (1989) Lucy, L. B., Danziger, I. J., Gouiffes, C., & Bouchet, P. 1989, in Structure and Dynamics of Interstellar Medium, IAU Colloq. No. 120, eds. G. Tenorio–Tagle et al.(New York: Springer), 164
- Lucy et al (1991) Lucy, L. B., Danziger, I. J., Gouiffes, C., & Bouchet, P. 1991, in Supernovae, ed. S. E. Woosley (New York: Springer), 82
- Messenger et al. (2006) Messenger, S., Sandford, S., & Brownlee, D. 2006, in Meteorites and the Early Solar System II, eds. D. S. Lauretta & H. Y. McSween, Jr. (Tucson: U. Arizona Press), 187.
- Morgan et al. (2003) Morgan, H. L., Dunne, L., Eales, S. A., Ivison, R. J., & Edmunds, M. G. 2003, ApJ, 597, L33
- Morgan & Edmunds (2003) Morgan, H. L. & Edmunds, M. G. 2003, MNRAS, 343, 427
- Nomoto et al. (1997) Nomoto, K., Hashimoto, M., Tsujimoto, T., Thielemann, F.-K., Kishimoto, N., Kubo, Yl, Nakasato, N., 1997, Nuclear Physics, 616, 79
- Nozawa et al. (2003) Nozawa, T., Kozasa, T., Umeda, H., Maeda, K., & Nomoto, K. 2003, ApJ, 598, 785 (N03)
- Nozawa et al. (2007) Nozawa, T., Kozasa, T., Habe, A., Dwek, E., Umeda, H., Tominaga, N., Maeda, K., Nomoto, K. 2007, ApJ, 666, 955
- Nozawa et al. (2008) Nozawa, T., Kozasa, T., N. Tominaga, I. Sakon, M. Tanaka, T. Suzuki, K. Nomoto, K. Maeda, H. Umeda, M. Limongi, T. Onaka, 2008, ApJ, 684, 1343
- Osterbrock (1989) Osterbrock, D. E., 1989, Astrophysics of Gaseous Nebulae and Active Galactic Nuclei, University Science Books
- Raymond & Smith (1977) Raymond, J. C., & Smith, B. W. 1977, ApJS, 35, 419
- Raymond (1979) Raymond, J. C. 1979, ApJS, 39, 1
- Rho et al. (2008) Rho, J., Kozasa, T., Reach, W. T., Smith, J. D., Rudnick, L., DeLaney, T., Ennis, J. A., & Gomez, H., 2008, ApJ, 673, 271
- Rho et al. (2009) Rho, J., Jarrett, T. H., Reach, W. T., Gomez, H., & Andersen, M., 2009, ApJL, 693, L39
- Rubin (2004) Rubin, R. H., 2004, IAU symposium no. 217, Australia, ed. by P.A. Duc, J. Briane, & E. Brinks, p190
- Rubin et al (1997) Rubin, R. H., Colgan, S.W.J., Hass, M., R., Lord, S. D., Simpson, J. P., 1997, ApJ, 479, 332
- Sasaki et al. (2006) Sasaki, M., Gaetz, T. J., Blair, W. P, Edgar, R., Morse, J.A, Plucinsky, P.P., & Smith, R. K., 2006, ApJ, 642, 260
- Slavin, Jones, & Tielens (2004) Slavin, J. D., Jones, A. P., & Tielens, A. G. G. M., 2004, ApJ, 614, 796 & Reach, W. T., 2009, ApJ, in press (astroph810.3014)
- Stanimirovic et al. (2006) Stanimirovic, S. et al., 2005, ApJ, 632,103
- Sturm et al (2002) Sturm, E., Lutz, D., Verma, A., Netzer, H., Sternberg, A., Moorwood, A. F. M., Oliva, E., & Genzel, R., 2002, A&A, 393, 821
- Tayal (2006) Tayal, S. S., 2006, ApJS, 166, 634
- Tappe, Rho & Reach (2006) Tappe, A., Rho, J., Reach, W. T., 2006, 653, 267
- Todini & Ferrara (2001) Todini, P. & Ferrara, A., 2001, MNRAS, 325, 726 (TF)
- Thielemann et al. (1996) Thielemann, F.-K., Nomoto, K., & Hashimoto, M.-A., 1996, ApJ, 460, 408
- Tuohy (1983) Tuohy, I. R., & Dopita, M., 1983, ApJ, 268, L11
- van Hoof et al. (2000) van Hoof, P.A.M., Beinterma, D. A., Ferland, G. J., 2000, A&A, 354, L41
- Wang et al (2008) Wang, R. et al., 2008, ApJ, 687, 848
- Wilson & Batrla (2005) Wilson T.L., & Batrla W., 2005, A & A, 430, 561
- Woosley (1995) Woosley, S. E., & Weaver, T. A., 1995, 101, 181
- Young et al. (2006) Young, P. A., et al. 2006 ApJ, 640, 891
| distance | 61.1 kpc (1′17.7801 pc) | |
|---|---|---|
| angular size (diameter) | 44′′ | |
| physical size | 13.04 pc | |
| shock radius | 6.52 pc (22′′) | |
| reverse shock radius | 4.45 pc (15′′) | |
| age | 1000 yr, 2050600 yr | |
| extinction | Av = 0.08 mag, NH=2 cm-2 |
| Wavelength | Line | FWHM | Surface Brightnessa | Surface Brightnessb | Aλ | |
|---|---|---|---|---|---|---|
| (m) | (m) | (erg s-1 cm-2 sr-1) | (erg s-1 cm-2 sr-1) | |||
| 12.8145 0.0010 | [Ne II] | 0.1529 0.0023 | 5.918E-05 8.774E-07 | 5.525E-05 | 0.0022 | |
| 14.3475 0.0023 | [Ne V] | 0.1797 0.0053 | 3.974E-06 1.834E-07 | 3.633E-06 | 0.0016 | |
| 15.5665 0.0014 | [Ne III] | 0.2027 0.0032 | 2.354E-05 1.079E-06 | 2.491E-05 | 0.0019 | |
| 24.3410 0.0059 | [Ne V] | 0.3395 0.0142 | 2.260E-06 9.676E-08 | 2.364E-06 | 0.0016 | |
| 25.9132 0.0006 | [O IV]+[Fe II] | 0.3430 0.0015 | 2.077E-05 9.442E-08 | 2.116E-05 | 0.0015 | |
| 33.5160 0.0010 | [S III] | 0.34890.0040 | 2.394E-063.023E-08 | 2.490E-06 | 0.0011 | |
| 34.8901 0.0010 | [Si II] | 0.34590.0027 | 3.429E-06 2.920E-08 | 3.612E-06 | 0.0010 | |
| 36.0783 0.0041 | [Ne III] | 0.25650.0197 | 4.329E-073.595E-08 | 5.206E-07 | 0.0009 |
| Location | RA. | Dec. | color | Wavelength (m) | FWHM (m) | Velocity (km s-1) | Velocity (km s-1) |
|---|---|---|---|---|---|---|---|
| Center | 01:04:02.05 | -72:01:53.2 | blue | 12.8081 0.0057 | 0.2235 0.0134 | 5226304 | 4446 |
| (1) | 12.78610.0031 | 0.167330.0070 | 3909164 [641a] | ||||
| (2) | 12.92520.0045 | 0.093910.0068 | 21961640 [2615a] | ||||
| E | 01:04:05.01 | -72:01:55.6 | green | 12.7931 0.0012 | 0.1465 0.0028 | 343364 | 2060 |
| Scenter | 01:04:02.5 | -72:01:59.6 | red | 12.8104 0.0026 | 0.1172 0.0060 | 2746140 | |
| SE shell | 01:04:04.04 | -72:02:00.5 | Fig. 3 | 12.8145 0.0010 | 0.1529 0.0023 | 357954 | 2295 |
| Model | a (=/dof) | bDust Compositions (temperature [K], mass [M⊙]) | fMass (M⊙) | fTotal Mass (M⊙) | |
|---|---|---|---|---|---|
| A | 2.41(398/165) | MgSiO3 (116, 3.80E-5), Si (150, 6.20E-5), C (55, 5.00E-3) | c5.12 | c 0.015 | |
| B | 1.98(389/196) | MgSiO3 (117, 3.21E-5), Si (114, 4.4E-4), Al2O3 (55, 2.06E-3) | c2.53 | c0.007 | |
| C | 2.18 (438/201) | MgSiO3 (108, 6.25E-5), Si (142, 9.21E-5), Al2O3 (d41, 0.03) | d0.03 | d0.09 | |
| D | 2.16 (417/193) | MgSiO3 (124, 2.34E-5), Si (149, 6.3E-5), | |||
| Al2O3 (60, 3.33eE-4), C (55, 4.350E-3), Mg2SiO4 (100, 1.10E-5) | e4.80 | e0.014 |
| Ne ionization state | from Excitation-rate equation | from Shock modelb | ||
|---|---|---|---|---|
| Model Aa | Model Ba | Model Ca | ||
| Ne massc (M⊙) in IRS slit | 0.22 | 0.003 | 0.07 | |
| total Ne massc (M⊙) | 0.63 | 0.01 | 0.21 | 0.042 |
| Wavelength | SNR | O | Ne | Mg | Si | S | Fe | Ar | Ca | H | He | referencesa |
|---|---|---|---|---|---|---|---|---|---|---|---|---|
| infrared | E0102 | Y | Y | U | U | pN | N | N | N | this paper | ||
| Cas A | Y | Y | Y | Y | 1, 2 | |||||||
| optical | E0102 | Y | Y | Y | pN | pN | pN | N | N | N | N | 3 |
| Cas A | Y | U | U | U | Y | N | Y | N | Y∗ | 4, 5 | ||
| X-rays | E0102 | Y | Y | Y | Y | U | U | N | Y | 6 | ||
| Cas A | Y | Y | Y | Y | Y | Y | Y | 7 |
| Ne (M⊙) | O (M⊙) | Ar (M⊙) | |||||
| IR ejecta mass | 0.042 (from Shock model) | 0.78 | |||||
| X-ray ejecta mass | 0.1 - 2a (0.84b) | 0.3 - 6a | |||||
| total mass of IR and X-ray ejecta | 0.14 - 2.4 (0.882b) | 1.08 - 6.78 | |||||
| Nucleosynthesis Modelsc | A | B | C | A | B | C | A |
| 13 M⊙ model | 0.028 | 0.023 | 0.064 | 0.21 | 0.151 | 0.308 | 0.0028 |
| 15 M⊙ model | 0.039 | 0.033 | 0.049 | 0.433 | 0.368 | 0.520 | 0.0063 |
| 20 M⊙ model | 0.257 | 0.191 | 1.480 | 0.800 | 0.004 | ||
| 25 M⊙ model | 0.651 | 0.594 | 0.565 | 3.000 | 2.997 | 1.386 | 0.007 |
| 35 M⊙ model | 1.366 | 3.891 | 0.040 | ||||
| 40 M⊙ model | 0.720 | 9.110 | |||||