Highly segmented thin microstrip detector with data-driven fast readout
Abstract
In September 2008 the Slim5 [1] collaboration submitted a low material budget silicon demonstrator to test with 12 GeV/c protons, at the PS-T9 test-beam at CERN. Inside the reference telescope, two different detectors were placed as device under test (DUT). The first was a 4k-Pixel Matrix of Deep N Well MAPS, developed in a 130 nm CMOS Technology, providing digital sparsified readout. The other one was a high resistivity double sided silicon detector, with short strips at 45∘ angle to the detector’s edge, read out by the FSSR2 chip. The FSSR2 is a 128 channel data-driven fast readout chip developed by Fermilab and INFN. In this paper we describe the main features of latter sensor, the striplet. The primary goal of the test was to measure the efficiency and the resolution of the striplets. The data-driven approach of the FSSR2 readout chips has been fully exploited by the DAQ system.
keywords:
Striplets , striplet detector , charged particle tracking1 Introduction
Vertex detectors for experiments at future colliders such as the SuperB Factory [2] or the International Linear Collider [3] will need to fulfill very stringent requirements on position resolution, readout speed, material budget and radiation tolerance. To address these request, a high resistivity double-sided strip detector has been designed and fabricated, featuring strips tilted by 45o with respect to the detector edge, the striplets. It is worth noting that in the SuperB Conceptual Design Report [4] this is the baseline solution proposed for the layer 0 of silicon vertex detector. In this note we report about the sensor design, the readout chip we used, the experimental setup of the test-beam, the data-analysis main features and eventually the results for striplet performance, concerning space-point resolution and hit efficiency.
2 Striplet geometry
The striplet geometry is optimized to limit the strip length (mm) and the material budget (double-sided, m thin detector). The strips are thus tilted by with respect to the detector edge, as shown in Fig. 1.
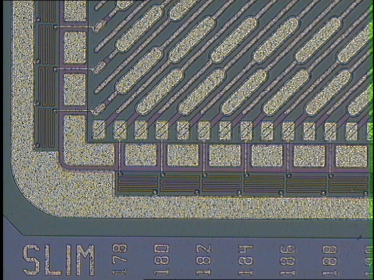
The short strip length reduces the average occupancy per channel and allows coping with the increased strip-to-backside capacitance. The strips are AC coupled, with integrated capacitors and polisilicon biasing-resistors. In order to minimize the dead area along the edges, the resistors are placed outside the guard ring, a solution already adopted for the BaBar SVT sensors. The detector is fully depleted at V bias.
3 The experimental set-up
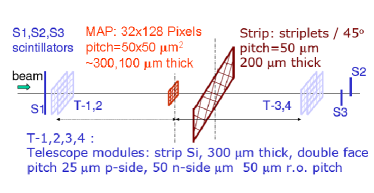
The Slim5 experiment was given the possibility of using for a beam-test the T9 facility at the CERN PS. To minimize the effect of multiple scattering on the resolution, we choose the maximum momentum that could be obtained, that is we got protons of 12 GeV/c as impinging particles, with spills of 400 ms and typical particles/spill. The beam profile had a width of about 0.5 cm RMS. For the reference telescope, four silicon strip detectors, 2cm2cm double-sided, AC coupled with 50 m read-out pitch, have been used, one pair upstream and one downstream the device under test (DUT). The modules (telescope and DUTs) were placed on a customized motorized table with remote control. The two pairs of telescope detectors were placed 40 cm apart, with a fixed 3.5 cm distance between the sensors inside each pair. The whole setup of the beam test is schematically shown in Fig. 2, where one can see also the scintillators, used for trigger studies.
4 Striplets readout and calibration
The striplet sensor is read out by the data-driven FSSR2 chip [5], the second release of the Fermilab Silicon Strip Readout Chip, derived from the one originally designed for the silicon pixel detector of the BTeV experiment. The chip is completely data-driven and operated at 20 MHz readout clock, allowing a maximum data transmission rate of 240 Mbit/s over the six available transmission lines. Each chip serves 128 strips, providing the address, the time stamp and a 3 bit amplitude information for all hits. A total of 384 channels were read out on each side of the sensor by three FSSR2 chips, here used for the first time to process also negative signals. Among the several programmable options we have chosen to operate the chips at low gain, base line restorer selected, 125 ns shaping time, a threshold corresponding to 4400(6300) e- for p(n)-side respectively. The same read out is used for the beam telescope detectors.
For calibration purposes, an internal square-wave pulser provides voltage steps on the integrated injection capacitance of fF. The injection capacitor discharge feeds the amplification chain. We evaluate the input noise charge by measuring the fraction of hits over threshold as a function of the input charge at a given discriminator threshold. The results of the calibrations are summarized in Tab. 1.
| Polarity | positive | negative |
|---|---|---|
| Noise (e-) | 630 | 1020 |
| S/N | 25 | 16 |
| Gain (mV/fC) | 96 | 67 |
| Thr.Dis. (e-) | 880 | 780 |
5 Data analysis
5.1 Track Reconstruction
Data analysis starts with the reconstruction of tracks using the telescope detectors. Clusters of fired strips are formed using a simple algorithm that simply associates adjacent fired strips. Typically a true cluster (one coming from a passing particle) contains one or two fired strips. The position of the cluster is calculated by weighting each fired strip with its measured deposited charge. For each telescope plane, clusters in measured on the U-coordinate (horizontal) side of the detector are combined with the V-coordinate (vertical) clusters to form space points.
The track parameters are the result of a -fit to the telescope-determined space-points, under straight-line assumption.
5.2 Detector alignment
Precise alignment of the telescope detectors as well as the devices under test is essential for making accurate determinations of detector performance. The alignment algorithm is based on minimizing track-hit residuals as a function of detector position. The alignment procedure starts by reconstructing tracks using very large roads and applying no cuts. The alignment parameters are extracted from linear fits to these residuals. The procedure is iterated until specified convergence criteria are satisfied. The mean of the hit-track residuals after alignment is typically on the order of a few microns.
5.3 Determination of efficiency and resolution
Once the telescope detectors and the DUT(s) were aligned, we can measure the efficiency and resolution of the DUTs. We select events with exactly one good reconstructed track and consider the intersection point of the fitted track with one striplet detector as DUT, The DUT will generally have a space point caused by the track itself (the signal hit), but it can also have hits that arise from noise sources. We distinguish signal hits from noise hits statistically by fitting the distribution of the residual distribution, where by residual we mean the position of the hit found in the DUT minus the position of intersection of the extrapolated track.
The space-point resolution of the DUT is determined from the width of the fitted residual distribution. The contribution to this width of the track extrapolation uncertainty and multiple scattering effects, both typically around 5 , are subtracted (in quadrature) to yield the intrinsic resolution.
6 Striplets results
We analyzed runs with one striplet detector placed as DUT to determine its hit-efficiency and space-point resolution.
For a track with normal incidence, a signal cluster contains one strip in 82.5(85.6)% of the cases or two adiacent strips in 16.1(13.3)% the cases on U(V)-coordinate.
For each track that passes the fiducial area of the striplet DUT, we look for a cluster close to the track-intercept in the DUT plane, separately for p and n-side. For the striplets more than 98% of the tracks have a space point within 80 m from the intersection point of the track.
After alignment, the typical residual distribution are shown in figure 3. We fit the residual distribution with a probability density function (p.d.f.) that is the sum of three functions: a) one central gaussian, b) a double-peak function (modelled by two gaussians with same sigma but opposite mean), and c) a wide gaussian, with mean fixed at zero. Each function represents a specific class of events. The central gaussian (a) represents correctly reconstructed hits. This kind of events represent more than the 90% of the total; we use the width of residual distribution to evaluate the space-point resolution. The double-peak function (b) represents true 2-strip cluster hits, wrongly reconstructed as 1-strip cluster; this happens because of the rather high value for threshold: a proton hitting the sensor roughly in the middle of two strips generates an amount of charge that is shared almost equally by the two adjacent strips. Due to signal and noise fluctuations, one strip could fire and the other not. This leads to an error in the hit position of the order of . We fix the mean of the double-peak function to this value. We find from the fit that the 5% of the total events belong to this category. The wide gaussian (c) describes noise hits (and so uncorrelated in space), and also some signal from strips close to dead channels. This kind of event accounts for 3% of the total.
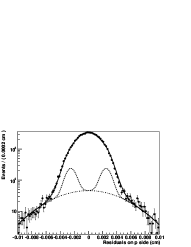
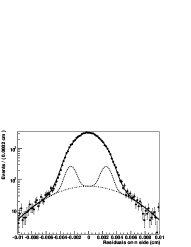
As said, the intrinsic resolution is obtained from the of the central gaussian (a) and after the subtraction of the track extrapolation uncertainty and multiple scattering effects, yields 13.6 (14.1) m for the p(n)-side, slightly better than the digital resolution for a 50 m read out pitch; this is due to the high fraction of clusters with 1-strip only. It is expected a slight worse performance for n-side due to non-ideal response of FSSR2 chip for negative input signals.
As a comparison, we estimated the full-width-half-maximum (fwhm) of the fitted p.d.f. and its variance too. We tried also to fit the residual with a single gaussian function. The results are reported in table 2.
| side | (m) | fwhm/2.35 (m) | (m) | (m) |
|---|---|---|---|---|
| p | 15.4 | 16.6 | 18.7 | 16.6 |
| n | 15.9 | 17.3 | 19.6 | 17.2 |
It is clear from the comparison that the width of a single gaussian is wider than the central one of the p.d.f., due to the presence of misreconstructed hits; moreover, the fwhm (rescaled by 2.35) matches the single-gaussian width very well.
7 Conclusions
The Slim5 collaboration realized a double-sided microstrip silicon detector, with reduced thickness (200) and strips tilted by with respect to the edge. The sensor was readout by a data-driven fast chip, the FSSR2, used here for the first time to read negative signals. The whole detector was one of the DUTs in a test-beam at CERN PS-facility, in which several characteristics were measured. We find that the detector hit-efficiency was more than 98%, with a space-point resolution (m) better than the digital resolution for a 50 m read out pitch.
References
- [1] SLIM5 Collaboration - Silicon detectors with Low Interaction with Material, http://www.pi.infn.it/slim5/
- [2] For an introduction: http://www.pi.infn.it/SuperB
- [3] For an introduction: http://www.linearcollider.org
- [4] The SuperB Concptual Design Report, INFN/AE-07/02, SLAC-R-856, LAL 07-15, Available online at: http://www.pi.infn.it/SuperB
- [5] V. Re et al. IEEE Transactions on Nuclear Science, vol. 53, issue 4, pp. 2470-2476