Subarcsecond Imaging of the High-Mass Star Forming Region Onsala 1
Abstract
We report subarcsecond images of the high-mass star forming region Onsala 1 (ON 1) made with the Submillimeter Array (SMA) at 0.85 mm and the Very Large Array at 1.3 cm and 3.6 cm. ON 1 is one of the smallest ultracompact H II regions in the Galaxy and exhibits various star formation signposts. With our VLA and SMA observations, two new cm-wave sources and five sub-mm dust sources, respectively, within a field of 5 (corresponding to a linear scale of 0.05 pc) are identified, indicating the multiplicity at the center of the ON 1 region. The dust and gas masses of these sub-mm sources are in the range of 0.8 to 6.4 M☉. Among the five sub-mm dust sources, SMA2, with a dust and gas mass of 2.6 M☉, demonstrates several star formation signatures, and hence likely represents an intermediate-mass (or even high-mass) star forming core. Due to the low star formation efficiency of 10%, we suggest that star formation in the ON 1 region will continue. For example, SMA4 and SMA5 are not associated with any star formation signatures and likely mark star formation cores at very early evolutionary stages.
Subject headings:
H II regions — ISM: individual (Onsala 1) — ISM: clouds — stars: formation1. Introduction
Onsala 1 (hereafter ON 1, also known as G69.540.98) is recognized as one of the most compact and isolated H II regions in the Milky Way (Zheng et al., 1985). Measurements of the kinematic distance to ON 1 span a wide range, from approximately 1 to 6 kpc. We adopt here a near kinematic distance of 1.8 kpc favored by most studies (e.g., MacLeod et al., 1998; Kumar et al., 2004; Nagayama et al., 2008). At this distance, the ultracompact (UC) H II region ON 1 has a diameter of 10002000 AU only (Kurtz et al., 1994). It is associated with the luminous (104 L⊙) far-infrared source IRAS 20081+3122 (MacLeod et al., 1998), and also surrounded by an embedded young cluster identified in near-IR emission (Kumar et al., 2003). Single dish observations in CS (54) and 0.35 mm continuum detected a massive (about a few 100 M☉ scaled to the distance of 1.8 kpc) star forming clump of a size of 0.5 pc roughly centered at the position of the UC H II region ON 1 (Shirley et al., 2003; Mueller et al., 2002). Toward the center of the ON 1 region, various H2O, OH, and CH3OH maser transitions are detected (e.g., Downes et al., 1979; Ho et al., 1983; Argon et al., 2000; Nammahachak et al., 2006; Kurtz et al., 2004). To have a consistent nomenclature, in the paper, we use “UC H II region ON 1” or “ON 1” for short to refer to the H II region and “ON 1 region” to refer to the cloud core associated with the H II region.
High-resolution observations provide clues of multiplicity of massive stars at the center of the ON 1 region. Observations at 0.85 mm with higher angular resolution (3) resolved a second dusty clump located approximately 1.5 to the northeast of the UC H II region ON 1 (Su et al., 2004), although observations of 3 mm continuum at 5 resolution revealed only a compact source centered on ON 1. Furthermore, Kumar et al. (2002, 2004) interpreted near-IR H2 and millimeter CO and H13CO+ features as multiple outflows in this region: one along the east-west direction revealed in the near-IR H2 emission and CO (21) transition and another along a position angle of 44∘ traced by the H13CO+ (10) emission. The driving sources of both outflows are likely located in the close vicinity of ON 1.
We report here the results of interferometric observations with the Very Large Array111The National Radio Astronomy Observatory is operated by Associated Universities, Inc., under cooperative agreement with the National Science Foundation. (VLA) and the SubMillimeter Array222The Submillimeter Array is a joint project between the Smithsonian Astrophysical Observatory and the Academia Sinica Institute of Astronomy and Astrophysics, and is funded by the Smithsonian Institution and the Academia Sinica. (SMA) in the continuum and molecular lines at sub-arcsecond resolutions. First we conducted high-resolution SMA observations to understand the nature of the continuum source adjacent to the ON 1 identified by our previous SMA observations at lower resolutions (Su et al., 2004), and a couple of sub-mm continuum sources were revealed. We then carried out VLA observations to further study these sub-mm sources. Using the multi-wavelength high-resolution continuum and molecular-line images, together with the available results, we explore the nature of the newly identified continuum sources, investigate clustered mode of star formation in this region, and discuss the observed chemical variations. We compare the very accurate maser positions obtained from recent interferometric maser observations (e.g., Fish, 2007; Nammahachak et al., 2006; Nagayama et al., 2008; Trejo et al., 2009) with other signposts of star-formation activities, and further clarify the relationship among different tracers.
| Parameter | VLA 8.4/22.4 GHz | SMA 345 GHz | |
|---|---|---|---|
| Primary beam HPBW | 5.4/2 | 35 | |
| Phase center (J2000) | 20h10m09.08s | 20h10m09.08s | |
| (J2000) | 31∘31′35.70 | 31∘31′35.70″ | |
| Projected baseline range (m) | 24011000 | 25220 | |
| Cannel spacing (MHz/km s-1) | — | 0.8125/0.7 | |
| rms noise level (mJy beam-1) | |||
| continuum | 0.05/0.06 | 3a | |
| line | — | 100 | |
| synthesized beam (arcsec) | 0.690.60/0.350.26 | 0.740.54b/0.800.50c | |
| Gain calibrator | 2023+318 | BL Lac | |
| Flux calibrator | 3C48 | Uranus | |
| Passband calibrator | — | 3C279 |
2. Observations and Data Reduction
The 345 GHz (0.85 mm) observations were carried out with the SMA on 2004 August 28 in its extended configuration with seven antennas in the array. See Ho, Moran, & Lo (2004) for more complete specifications of the SMA. The observational parameters are summarized in Table 1. The phase reference center of the observations was the position of the UC H II region ON 1 reported by Kurtz et al. (2004). The half-power width of the SMA primary beam at 0.85 mm was 35. We tuned the receivers to the CS (76) line at 342.8830 GHz in the lower sideband (LSB) and the HCN (43) line at 354.5055 GHz in the upper sideband (USB). Note that the 2 GHz bandwidth in each sideband allowed for CH3OH (131A-130A+) at 342.7298 GHz and SO (8877) at 344.3106 GHz to be observed simultaneously. The spectral resolution was 0.8125 MHz, corresponding to a velocity resolution of 0.7 km s-1. We smoothed our data to 1.0 km s-1 resolution for the analysis presented below. The absolute flux density scale was determined from observations of Uranus, and is estimated to have an uncertainty of 25%. The quasars 3C279 and BL Lac were observed for bandpass and gain calibration respectively. We calibrated the data using the MIR software package adapted for the SMA from the MMA software package developed originally for the OVRO (Scoville et al., 1993). We made maps using the MIRIAD package. The rms noise level in a 1.0 km s-1 velocity bin was 100 mJy beam-1. We incorporated the data presented in Su et al. (2004) (made with the SMA in its compact configuration) to make a continuum map with a noise level of 3 mJy beam-1. The systemic LSR velocity of the ON 1 region is 12 km s-1.
Radio continuum observations at 8.4 and 22.4 GHz (i.e., 3.6 and 1.3 cm) were carried out with the VLA on 2005 March 25 in its B configuration. The pointing center is the same as that of the SMA observations, and the primary beam is approximately 5.4 and 2 at 8.4 and 22.4 GHz respectively. The observational parameters are also summarized in Table 1. At both frequencies, the quasars 3C48 and 2023+318 were observed as the flux and complex gain calibrator respectively. We calibrated the data using the AIPS package. Self-calibrations were performed in order to improve the dynamic range of the images to 400. With uniform weighting, the angular resolutions at 8.4 and 22.4 GHz were 0.69 0.60 at P.A. of 51.6∘ and 0.35 0.26 at P.A. of 57.8∘ respectively. The noise levels of the 8.4 and 22.4 GHz continuum maps were approximately 0.05 and 0.06 mJy beam-1 respectively.
As described in §4.3, our SMA observations do not detected CS (76) at all in spite of the strong detections with single-dish observations. To better understand our SMA results, we also carried out single-dish observations in CS (76) and C34S (76) with the 10 m Heinrich Hertz Submillimeter Telescope (SMT) on Mount Graham, Arizona. The observations were performed in the beam-switching mode. The primary beam is about 22″, and the spectral resolution is 1 MHz (corresponding to a velocity resolution of 0.9 km s-1). The temperature scale T was obtained using standard vane calibration, and the main beam temperatures (Tmb) were derived through Tmb = T/mb, with the main beam efficiency mb = 0.5 (Narayanan et al., 2005). The rms noise level is 110 mK and 38 mK, respectively, for CS(76) and C34S (76) data in main beam brightness temperature units. We reduced the data using the CLASS package.
3. Results
3.1. 3.6 cm and 1.3 cm Continuum
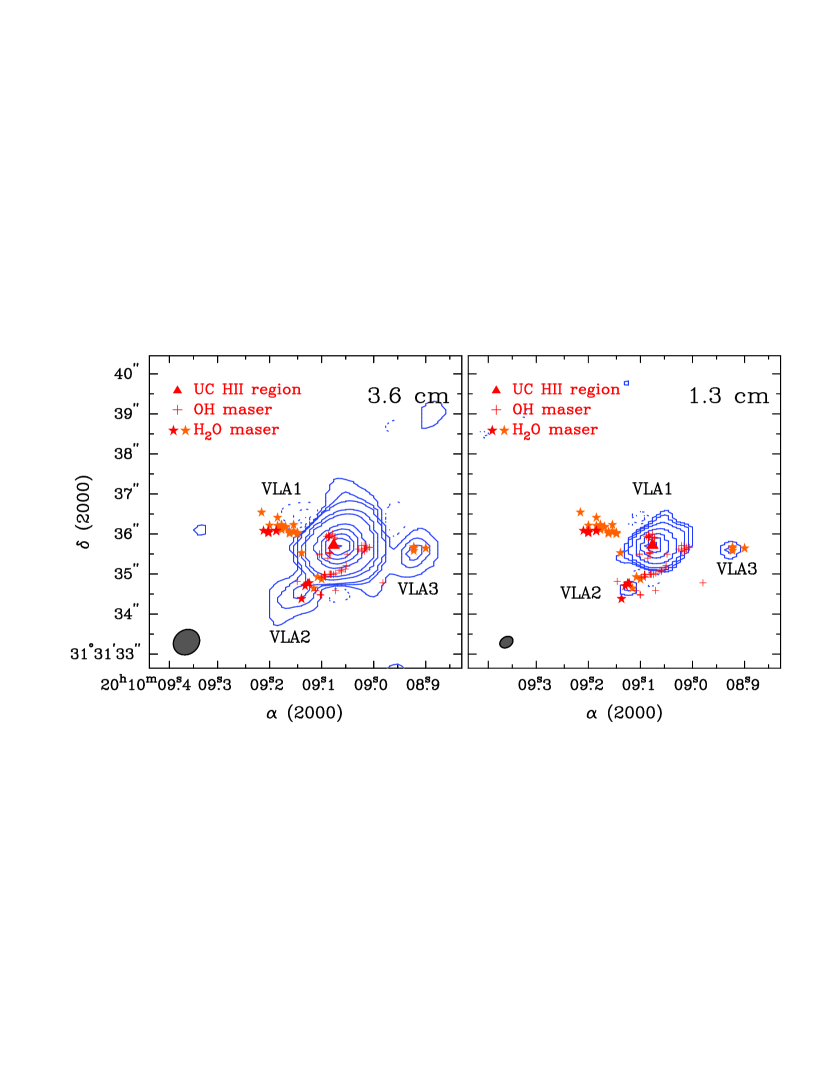
Figure 1 shows the continuum maps at 3.6 cm (left panel) and 1.3 cm (right panel) toward ON 1 region imaged with the VLA. At both wavelengths, three cm-wave sources are detected within a field of 3″. The strongest cm-wave source, denoted as VLA1, is identical to the previously identified UC H II region ON 1, with its measured flux densities at both 3.6 and 1.3 cm in close agreement with previous results (e.g., Zheng et al., 1985; Kurtz et al., 1994). The spectral index of 0.4 inferred from the integrated 3.6 and 1.3 cm emission is consistent with that being free-free emission with a turn-over frequency at around 10 GHz (Zheng et al., 1985). To the southeast and west of the ON 1, two additional cm-wave continuum sources, denoted as VLA2 and VLA3, are located. VLA2 is the first time to be identified, while VLA3 is detected by Argon et al. (2000) without special notification. Both VLA2 and VLA3 appear to be unresolved and are significantly weaker than ON 1. In the same way, we deduced a spectral index of 0.7 for VLA2 and 0.2 for VLA3. Although the spectral index of 0.7 is similar to that of an extragalactic source, VLA2 is still most likely related to the ON 1 region because VLA2 is also associated with several star formation signatures as presented in §4.1. The positions, integrated flux densities, and deconvolved source sizes of these three cm-wave sources are summarized in Table 2.
All the three cm-wave sources demonstrate maser activity. As shown in Figure 1, VLA1 and VLA2 are associated with OH maser spots, while VLA2 also harbors water maser emission (Fish, 2007; Nammahachak et al., 2006; Nagayama et al., 2008; Trejo et al., 2009). Furthermore, recent VLA observations detected a group of water maser spots toward VLA3 (Trejo et al., 2009). Therefore in addition to the UC H II region ON 1, VLA2 and VLA3 may represent another two star forming sites in this region. This is especially true for the case of VLA2 due to its association of several other star formation signatures (see §3.2 and §3.3). A detailed discussion about the nature of these cm-wave sources will be presented in §4.1.
| Position(2000) | S | deconvolved sizea | Mass | |||
|---|---|---|---|---|---|---|
| Source | wavelength | (mJy) | maj″min P.A.∘ | (M☉) | ||
| VLA results | ||||||
| VLA1 | 3.6cm | 20 10 09.07 | +31 31 35.7 | 136.4 | 0.50 0.35 77.7 | |
| 1.3cm | 20 10 09.07 | +31 31 35.7 | 200.0 | 0.42 0.37 +73.4 | ||
| VLA2 | 3.6cm | 20 10 09.16 | +31 31 34.5 | 1.2 | point source | |
| 1.3cm | 20 10 09.12 | +31 31 34.6 | 0.6 | point source | ||
| VLA3 | 3.6cm | 20 10 08.92 | +31 31 35.5 | 1.0 | point source | |
| 1.3cm | 20 10 08.93 | +31 31 35.6 | 0.8 | 0.31 0.21 +56.1 | ||
| SMA results | ||||||
| SMA1 | 0.85mm | 20 10 09.06 | +31 31 35.0 | 320 | 1.23 1.16 16.1 | 4.4 |
| SMA2 | 0.85mm | 20 10 09.13 | +31 31 34.8 | 190 | 0.96 0.79 +29.8 | 2.6 |
| SMA3 | 0.85mm | 20 10 09.07 | +31 31 36.5 | 60 | 0.86 0.26 24.1 | 0.8 |
| SMA4 | 0.85mm | 20 10 09.18 | +31 31 36.5 | 470 | 0.99 0.82 +0.5 | 6.4 |
| SMA5 | 0.85mm | 20 10 09.28 | +31 31 38.6 | 170 | 1.32 1.00 +22.0 | 2.3 |
3.2. 0.85 mm Continuum
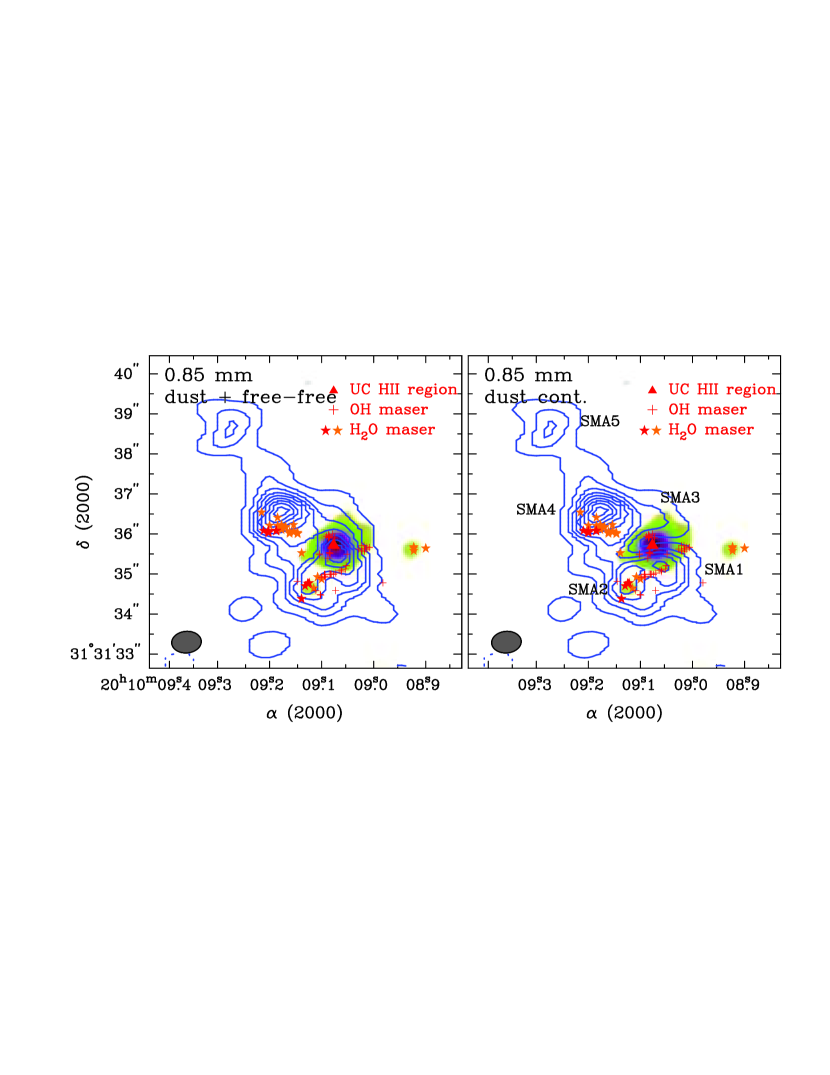
The left panel of Figure 2 shows the 345 GHz (0.85 mm) continuum emission toward ON 1 region imaged with the SMA. Within a field of 5 (i.e., 0.05 pc at 1.8 kpc), several submillimeter continuum features can be discerned. The two strongest peaks have been reported in our previous snapshot observations (Su et al., 2004), while the weaker one is associated with the UC H II region ON 1. Since 0.85 mm continuum could arise from either dust or ionized gas, we estimate the dust contribution to the observed 0.85 mm flux density. First, we extrapolate the free-free emission as measured at cm wavelengths to 0.85 mm. As mentioned in §3.1, the turn-over frequency of the UC H II region ON 1 is around 10 GHz, indicating a flux density ratio of 0.76 between 0.85 mm and 1.3 cm calculating from a optically thin spectral index of 0.1. Secondly, we convolve the 1.3 cm map to a Gaussian beam of 0.740.54 to match the angular resolution of the 0.85 mm map and regrid the convolved 1.3 cm map to have the same coordinate system as that of the 0.85 mm map. We then apply uniformly a scaling factor of 0.76 to all pixels in the regrided 1.3 cm image to obtain an extrapolated free-free image at 0.85 mm. Finally the latter image is subtracted from the observed 0.85 mm map in order to obtain a continuum map without contribution of free-free emission, as shown in the right panel of Figure 2.
The 0.85 mm continuum shown in the right panel of Figure 2 is then presumably produced solely by dust in spite of the scaling factor 0.76 derived only from the UC H II region ON 1 (i.e., VLA1). The reasons are first VLA2 is weaker and has negative spectral index (inferred from 3.6 and 1.3 cm), thus its extrapolated ionized gas component at 0.85 mm should be negligible. Secondly, we can show that the other sub-mm features can not be hypercompact (HC) H II regions, since the turnover frequency of HC H II regions is unlikely higher than 100 GHz. For example, for a HC H II region with an emission measure of 11010, among the highest known value (e.g., De Pree et al., 1997), the turn-over frequency is 50 GHz only. Thus for any HC H II region weaker than 0.18 mJy (i.e., 3 rms noise levels) at 22 GHz, its extrapolated free-free emission at 0.85 mm is also negligible, i.e., 1 mJy.
The major difference between the two panels in Figure 2 is caused by the contribution of free-free emission at 0.85 mm from the H II region ON 1. As shown in the right panel of Figure 2, after removing free-free contribution, the 0.85 mm dust image clearly exhibits a cavity surrounding the UC H II region ON 1, and in total five dust sources (denoted as SMA1, 2, 3, 4, & 5) are further identified. The original sub-mm peak toward the H II region ON 1 is split into two sources (i.e., SMA1 & SMA3). Morphologically speaking, SMA3 can be discerned as the extended feature associated with SMA4. This is, however, unlikely the case because of the different molecular signatures between SMA3 and SMA4 (§3.3). The nature of these sub-mm dust sources will be discussed in §4.1. We fit the 0.85 mm dust image with 2-dimensional Gaussian structures to obtain the position, integrated flux and deconvolved size of each source. The results as well as the inferred dust and gas masses (see below) are listed in Table 2. Assuming a gas-to-dust ratio of 100, a (uniform) dust temperature of 30 K, a dust opacity ν = 0.006 (/245 GHz)β cm2 g-1 (Kramer et al., 1998; Shepherd & Watson, 2002), and an opacity index = 1.5, we estimate the dust and gas masses of the sub-mm sources are in the range of 0.8 to 6.4 M⊙.

3.3. Morphology and Kinematics of the SO & CH3OH Lines
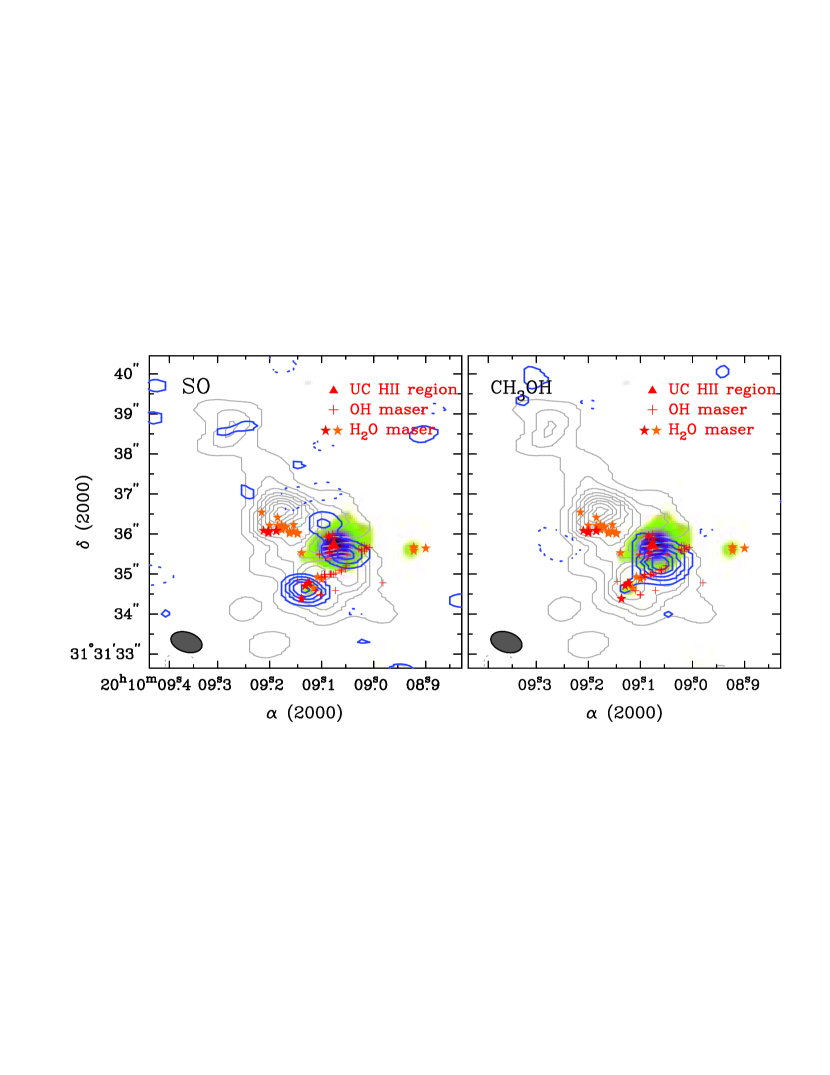
The left panel of Figure 3 shows the integrated SO (877) emission detected toward ON 1 region. The SO emission can be detected from 6 to 15 km s-1 approximately, and is mainly concentrated around the positions of VLA1 and VLA2. As shown in the left panel of Figures 3 & 4, the SO line toward VLA1 (i.e., ON 1) traces an elongated structure along a position angle of 40∘, with blueshifted gas located to the northeast and redshifted to the southwest. Furthermore, there appears to be a SO cavity surrounding VLA1, i.e., the SO emission at the position of VLA1 is significantly weaker than the northeast and southwest lobes. The strongest SO peak spatially coincides with VLA2 and SMA2 very well, and is associated with OH and H2O masers. No clear velocity gradient of the SO line toward VLA2 can be discerned. The right panel of Figure 3 shows the integrated emission of CH3OH (131A-130A+) detected toward ON 1 region. The CH3OH emission is discerned from 7 to 16 km s-1 and is mainly concentrated in the close vicinity of VLA1. In addition to the main source, there appears to be weak CH3OH emission associated with VLA2.
As shown in the right panel of Figure 4, the kinematic structure of the main methanol source is similar to that seen in SO line, although a spatial differentiation between the two species is clearly discerned. Most of methanol gas is located to the southwest of the UC H II region ON 1, while the integrated SO emissions in the northeast and southwest of ON 1 are comparable. The peak positions of the southwest source seen in SO and CH3OH are also slightly different, with an offset of 0.2. Since the upper energy levels of the two transitions are fairly different (Eu of SO (877) = 87.4 K and Eu of CH3OH (131A-130A+) = 227.6 K), the distinct contrast in SO and CH3OH can result from different physical conditions in this region. Interestingly, although the SMA4 shows strong dust continuum, neither SO nor CH3OH emission is detected toward this sub-mm dust source.
4. Discussion
4.1. Nature of Continuum & Molecular-Line Sources
It has been known that high-mass stars tend to form in groups. Indeed, our results of the VLA and SMA observations clearly demonstrate a group of continuum sources in this region. In addition to the known UC H II region, which is powered by a B0 star, we identify here two more cm-wave sources and five more sub-mm sources. Below we discuss the nature of these continuum sources.
SMA2/VLA2 exhibits several star formation signposts such as cm-wave emission (i.e., VLA2), H2O and OH maser activities, and SO and CH3OH emission, and hence marks a newly identified star-forming core toward ON 1 region. Assuming VLA2 to be a radio jet, we could extrapolate the correlation of 3.6 cm radio continuum luminosity and far-IR bolometric luminosity deduced from a sample of radio jets associated with YSOs with luminosities 103 L☉ (Anglada, 1995; Harvey et al., 2002), and infer a bolometric luminosity of 6000 L☉ for the young stellar object (YSO) powering VLA2. In contrast, assuming VLA2 to be an UC H II region, we could estimate the bolometric luminosity of H II region powering source to be 2000 L☉. Furthermore, the dust and gas mass of the associated sub-mm continuum source (i.e., SMA2) is 2.6 M☉. Therefore the available evidences suggest that SMA2/VLA2 likely represents an intermediate-mass (or even high-mass) star forming core.
The nature of VLA3, which is associated with water maser spots, is less clear. In the same way, we estimate a bolometric luminosity of 5000 L☉ and 2000 L☉, respectively, for the VLA3 powering source by assuming VLA3 to be a jet and an UC H II region. The non-detection of sub-mm continuum toward VLA3 indicates an upper-limit to its gas mass of 0.13 M☉ only, while the bolometric luminosity of 20005000 L☉ argues that the dust condensation surrounding VLA3 is unlikely to be missed by our SMA observations. In fact, the velocities of water maser spots associated with VLA3 span from 20 km s-1 to 9 km s-1, approximately 25 km s-1 shifted from the systemic velocity of the ON 1 region. Thus probably VLA3 and its associated water maser spots trace a blue-shifted outflow powered by a YSO within the ON 1 region.
The strongest sub-mm source, SMA4, is not associated with any star formation signatures. Although Nagayama et al. (2008) proposed the highly collimated water maser jet, located 0.8 southwest of the SMA4, to be associated with the SMA4, we argue that this is unlikely the case, as described in §4.4. Similarly, SMA5 does not exhibit any signposts of star formation either. One possible reason is that both SMA4 and SMA5 mark star formation regions at very early evolutionary stages.
In §3.2, we identified two dust sources, SMA1 & SMA3, located to the north and southwest of the UC H II region ON 1, after subtracting free-free emission from the 0.85-mm image. The main methanol source coincides spatially with the SMA1 fairly well. The SO emission to the southwest of the ON 1 is also likely associated with the SMA1, and the SO gas to the northeast of the ON 1 is likely associated with the SMA3. Kinematically speaking, the velocity gradient of H13CO+ (10) along the northeast-southwest direction toward the H II region ON 1 has been reported by various authors, and is interpreted as either molecular outflows (Kumar et al., 2004) or a rotating dense core (Lim et al., 2002). A similar kinematics, which can be caused by molecular outflow, rotation of dense gas, and expansion of H II region, is also seen in SO and CH3OH lines with our SMA observations. Below, we re-examine these interpretations based on our high-spatial resolution results and discuss the nature of SMA1 & SMA3.
First, if the velocity structures seen in SO and CH3OH result from molecular outflow, the most promising outflow driving source shown in our SMA subarcsecond images is the same as the young star powering the UC H II region ON 1. In this scenario, one will expect to identify signature of the ionized shell broken by the outflow activities. Such a signature, however, can not be discerned from the cm-wave images shown in Figure 1. Our results therefore do not appear to favor the interpretation of molecular outflow. The remaining two possibilities (i.e., expansion and rotation) are not very easy to discriminate. With proper motion measurements, Fish & Reid (2007) conclude that the motions of OH masers are consistent with the expansion of the UC H II region ON 1. Since both CH3OH and SO emissions span similar velocity ranges with those measured in OH masers, and the kinematic structures of OH masers and CH3OH and SO gas are similar, we suggest that the SO and CH3OH gas associated with SMA1 and SMA3 trace the expansion of the H II region.
4.2. Clustered Mode of Star Formation
Similar to many other massive star formation regions, the ON 1 region is also associated with an embedded star cluster identified at near-infrared wavelengths (Kumar et al., 2002, 2003). It has been argued that in the Milky Way about 70%90% stars are formed in clusters, and several fundamental properties of the Galactic stellar population, such as the initial mass function (IMF), are forged in embedded star clusters (for a recent review, see Lada & Lada, 2003). The star formation efficiency (SFE, = Mstars/(Mgas+Mstars)) is a fundamental parameter of star and cluster formation processes, and appears to be an indicator for the evolution of an embedded cluster. Observations of nearby embedded clusters show that SFEs range from about 10% to 30%, with the least evolved clusters having the lowest SFEs (see Lada & Lada, 2003, and reference therein). Below, we estimate the SFE in the ON 1 region.
The mass of the molecular clump associated with ON 1 have been evaluated to be 300400 M☉ (scaled to a distance of 1.8 kpc) from single-dish observations (Mueller et al., 2002; Shirley et al., 2003). In contrast, no mass estimation of the associated embedded cluster has been done. Actually, an accurate estimation of stellar mass within an embedded cluster is not easy. We roughly evaluate the cluster mass from the 2MASS Point Source Catalog. We first count the number of the stars detected within a radius of 60 (approximately a factor of two larger than the size of the molecular clump) from the central H II region ON 1, and in total 58 stars are found. Assuming a mean mass of 0.5 M☉ inferred from the general IMF (Kroupa, 2002), the mass of the embedded cluster is 29 M☉. We further include the mass of the UC H II region powering star, which is likely a 10 M☉ B0-type star, and estimate a SFE of 10% in the ON 1 region. The relatively low SFE appears to suggest star formation in the ON 1 region will continue.
Indeed, the identification of multiple centimeter and millimeter continuum sources toward ON 1 region indicates an ongoing (proto)cluster formation. Given the small amount of mass (i.e., 16 M☉) in the sub-mm sources reported in §3.2, nevertheless, the SFE in ON 1 region is still far from 30%. We propose three possibilities for the ON 1 region if it would attain a high SFE of 30% as deduced for the more evolved young clusters. First is that there will be new cores and then stars forming later, second is that a significant fraction of the clump mass has to be accreted onto the existing dust sources, and/or third that a significant number of dust cores have been missed by our SMA observations. For the second possibility, since cores keep accreting gas from clump, estimating final star mass from current core mass is difficult. Thus one may expect a non-correlated relationship between star mass and core mass functions, as predicted by the competitive accretion model (Bonnell et al., 2004).
Due to the lack of sufficient dynamical range, a proper identification of dust continuum sources with masses 0.4 M☉ can not be achieved by our SMA observations. That most sub-mm dust sources detected toward ON 1 region are massive than 2 M☉, however, appears to suggest an absence of low-mass (M 2 M☉) dust sources within field of view. If the core mass function exists at such a star formation scale, the lack of low-mass dust sources toward the cluster center infers a mass segregation, i.e., massive cores preferentially located near cluster center, in the ON 1 region. Such core mass segregation is probably related to the stellar mass segregation often seen in young clusters (e.g., Zinnecker & Yorke, 2007, and reference therein).

4.3. Non-detections of CS (76) and HCN (43)
Although CS (76) gas has been detected toward ON 1 region with a peak flux density of 120 Jy in a 20 beam using single-dish telescopes (Plume et al., 1992), it is not detected at all with our SMA observation in the image plane at a rms noise level of 100 mJy. To estimate the column density upper limit of the CS gas, we assume the CS (76) to be optically thin and in LTE and adopt a gas temperature of 30 K, the same as that of the sub-mm (dust) continuum emission. We derive a CS column density of 91013. Together with the total (gas) column density of (1.16.0)1024 derived from the five 0.85 mm (dust) sources, we estimate a CS abundance X(CS) of (82)10-11, with the highest value (i.e., 810-11) for the SMA5 and the lowest for the SMA4. The inferred CS abundance will be increased if the adopted gas temperature is higher. For example, the upper-limit CS abundance will become (112)10-10 if assuming a gas temperature of 300 K. We conclude that the inferred CS abundance, at least for the more massive sub-mm sources such as SMA4, is likely much smaller than the typical CS abundance of 110-9 toward high-mass star-forming cores obtained from single-dish observations (Shirley et al., 2003). With the same assumptions, similarly we estimate the HCN column density being 2.01013 and the abundance X(HCN) (0.32)10-11. In star forming cores, the typical X(HCN) is about a few 10-9 (Jørgensen et al., 2004).
The direct interpretation of the non-detection of CS (76) and low CS abundance is that there is indeed a depletion of CS in the inner region of the massive star forming core associated with ON 1, and the majority of the CS (76) emission detected by single-dish telescope should arise from an extended envelope. A proper explanation for the CS depletion is not easy. Tafalla et al. (2002) reported a CS depletion at the phase of starless cores, which might be able to explain the non-detection of CS (76) gas at some dust condensations in the ON 1 region. However, ON 1 region appears to harbor (some) YSOs which are more evolved than the pre-stellar-core phase. For example, SMA2 is associated with masers of H2O and OH and cm-wave continuum, and SMA1 exhibits strong CH3OH emission with Eu300 K. Both SMA1 & SMA2 are most likely evolved than the phase of pre-stellar core and their surrounding gas should be hot enough to evaporate CS from grain mantles to gas phase.
An alternative situation is that the CS (76) emission from the outer envelope is optically thick, quite smoothly distributed and resolved out, one therefore cannot see any embedded compact features spanning the same velocities. This is, however, unlikely the case for the ON 1 region. As shown in Figure 5, our single-dish observations with the 10-m SMT indicate that the CS (76) emission toward ON 1 region, with a main-beam temperature of 4 K, is far from optically thick. Moreover, that the line ratio of CS (76) and C34S (76) is very close to the 32S/34S abundance ratio of 22 (Wilson & Rood, 1994) also argues the optically thin CS (76) emission toward ON 1 region.
Although it is unlikely that the CS (7-6) emission is optically thick over the whole single-dish beam of 22, we can not rule out the possibility that the CS (76) of 50100 K is opaque within a region of 5 or so toward the ON 1. Such conditions can still account for the non-detection of the CS (76) in our SMA observations. Interferometric observations at 3″5″resolution, which can provide information to link the large-scale results from single-dish observations and the small-scale measurements with our SMA observations presented here, should help to address this issue.
4.4. Nature of the Extremely High-Velocity Water Masers
One of the most dramatic results from maser observations toward ON 1 region is the detection of extremely high-velocity H2O maser spots, with velocity km s-1, located approximately 1.5 to the east of the UC H II region ON 1 (Nagayama et al., 2008). Such a velocity coverage is among the broadest range of H2O maser emission detected in (high-mass) star forming regions. In particular these extremely high-velocity masers spread into two small (15 15 mas) regions separated approximated 0.2 along the east-west direction and display a clear velocity gradient, with blue spots to the east and red to the west (Nagayama et al., 2008).
Together with proper motion measurements, Nagayama et al. (2008) suggest that these high-velocity H2O masers trace an outflow aligned roughly in the east-west direction driven by a YSO in this region. The collimated jet seen in water masers, however, is not centered on any sub-mm (dust) peak or molecular gas condensation traced by SO and CH3OH. With the existence of a power-law correlation between L and LFIR (Palagi et al., 1993), the measured high water maser luminosity (Nagayama et al., 2008) indicates a pumping source of luminous (L 2104 L☉) and massive YSO unlikely to be missed with our SMA observations. To our knowledge, furthermore, such an extremely high-velocity water maser system exhibiting a compact (300400 AU) jet-like structure has never been detected in other star forming region.
Alternatively, stars at asymptotic giant branch (AGB) stage can demonstrate maser activities of various species (i.e., H2O, OH, and SiO) (Deacon et al., 2007; Imai et al., 2007, and reference therein). The velocities of masers detected in evolved stars usually span less than 40 km s-1, but extremely high-velocity (100 km s-1) water masers have been detected toward approximately 10 evolved stars (for a recent review, see Imai, 2007). These sources are the so-called “water-fountain” sources. They exhibit jet-like signatures in both kinematics and morphology, with extents of a few 100 AU and dynamical timescales of a few tens years. The origin of the high-velocity collimated jets around such AGB stars is not well understood. One possible scenario is that the collimated jets are shaped by stellar magnetic field (Vlemmings et al., 2006).
Given the lack of identification of a young star to be responsible to power the water masers and the similarities in both morphology and kinematics of the H2O maser spots to the so-called “water-fountain” sources, we suspect that the collimated water jet toward ON 1 region may be driven by an evolved star. If this is the case, it is interesting to know whether the water fountain jet as well as its driving source are really located within the massive star forming region ON 1 or just along the line of sight. A precise estimate of the latter probability can not be done due to the lack of the sample statistics of water fountain jets. We consider that the probability of the latter is very small. Given a similar systematic velocity of the ON 1 region and the collimated water jet, a direct discriminate to this issue is not easy. A precise determination of the distance to the water fountain jet and the ON 1 region by the annual parallax measurements with the VLBI will help to answer this question.
5. Summary
We present results of interferometric observations toward the high-mass star formation region ON 1 made with the SMA and VLA in continuum and molecular lines at subarcsecond resolutions. Our main results can be summarized as follows.
1. Observations with the VLA at both 1.3 cm and 3.6 cm identified two new cm-wave continuum sources in addition to the known UC H II region ON 1. All the three cm-wave sources demonstrate maser activity.
2. Our SMA observations identified five sub-mm dust sources within a field of 5, indicating the multiplicity in the ON 1 region. The dust and gas masses of these sub-mm sources are in the range of 0.8 to 6.4 M☉.
3. SMA2 exhibits several star formation signatures such as cm-wave emission (i.e., VLA2), H2O and OH maser activities, as well as SO and CH3OH emission, and hence marks a newly identified star-forming core in the ON 1 region. With an inferred far-IR bolometric luminosity of 6000 L☉, SMA2 represents an intermediate-mass or even high-mass star forming core.
4. SMA1 and SMA3 are associated with SO and CH3OH lines. The kinematic structures of both SO and CH3OH appear consistent with the expansion of the UC H II region ON 1.
5. A low star formation efficiency of 10% suggest that star formation in the ON 1 region will continue. This is consistent with the identification of multiple YSO candidates in the ON 1 region.
6. While strong CS (76) emission was detected toward the ON 1 region with single-dish observations, it is not detected at all by our SMA observations. The results of single-dish observations in CS (76) and C34S (76) rule out the possibility that the CS line was totally resolved out due to the smoothly distributed and optically thick CS emission from the extended envelope over the single-dish beam of 22. The non-detection of CS (76) emission may imply a depletion of CS in the center of the ON 1 region.
7. There is a lack of identification of a young star to be responsible for powering the highly collimated high-velocity water jet identified in the ON 1 region. We therefore suggest that these masers, like H2O maser spots in the so-called “water-fountain” sources, are driven by an evolved star.
References
- Anglada (1995) Anglada, G. 1995, in Circumstellar Disks, Outflows and Star Formation, ed. S. Lizano & J. M. Torrelles (Rev. Mexicana Astron. Astrofis. Ser. Conf. 1) (Mexico, D.F.: Inst. Astron., Univ. Nac. Autonoma Mexico), 67
- Argon et al. (2000) Argon, A. L., Reid, M. J., Menten, K. M., 2000, ApJS, 129, 159
- Bonnell et al. (2004) Bonnell, I. A., Vine, S. G. & Bate, M. R. 2004, MNRAS, 349, 735
- Deacon et al. (2007) Deacon, R. M., Chapman, J. M., Green, A. J., & Sevenster, M. N. 2007, ApJ, 658, 1096
- De Pree et al. (1997) De Pree, C. G., Mehringer, D. M., & Goss, W. M. 1997, ApJ, 482, 307
- Downes et al. (1979) Downes, D., Genzel, R., Moran, J.M., Johnston, K.J., Matveenko, L.I., Kogan, L.R., Kostenko, V.I., & Ronnang, B. 1979, A&A, 79, 233
- Fish (2007) Fish, V. L. 2007, ApJ, 669, L81
- Fish & Reid (2007) Fish, V. L., & Reid, M. J.2007, ApJ, 670, 1159
- Harvey et al. (2002) Harvey, D. W. A., Wilner, D. J., Di Francesco, J., Lee, C.-W., Myers, P. C., & Williams, J. P. 2002, AJ, 23, 3325
- Ho et al. (1983) Ho, P. T. P., Haschick, A. D., & Vogel, S. N. 1983, ApJ, 265, 295
- Ho, Moran, & Lo (2004) Ho, P. T. P., Moran, J., & Lo, K. Y. 2004, ApJ, 616, L1
- Imai et al. (2007) Imai, H., Sahai, R., & Morris, M. 2007, ApJ, 669, 424
- Imai (2007) Imai, H. 2007, in IAU Symp. 242, Astrophysical Masers and Their Environments, ed. W. Baan & J. Chapman (Cambridge: Cambridge Univ. Press), 279
- Jørgensen et al. (2004) Jørgensen, J. K., Hogerheijde, M. R., Blake, G. A., van Dishoeck, E. F., Mundy, L. G., & Schöier, F. L. 2004, A&A, 415, 1021
- Kramer et al. (1998) Kramer, C., Alves, J., Lada, C., Lada, E., Sievers, A., Ungerechts, H., & Walmsley, M. 1998, A&A, 329, L33
- Kroupa (2002) Kroupa, P. 2002, Science, 295, 82
- Kumar et al. (2002) Kumar, M. S. N., Bachiller, R., & Davis, C. J. 2002, ApJ, 576, 313
- Kumar et al. (2003) Kumar, M. S. N., Davis, C. J., & Bachiller, R. 2003, Ap&SS, 287, 191
- Kumar et al. (2004) Kumar, M. S. N., Tafalla, M., & Bachiller, R. 2004, A&A, 426, 195
- Kurtz et al. (1994) Kurtz, S., Churchwell, E., & Wood, D.O.S. 1994, ApJS, 91, 659
- Kurtz et al. (2004) Kurtz, S., Hofner, P., Álvarez, C. V., 2004, ApJS, 155, 149
- Lada & Lada (2003) Lada, C. J., & Lada, E. A. 2003, ARA&A, 41, 57
- Lim et al. (2002) Lim, J., Choi, M., & Ho, P. T. P. 2002, in Hot Star Workshop III: The earliest stages of massive star birth, ed. P. Crowther (San Francisco: ASP), ASP Conf. Proc., 267, 385
- MacLeod et al. (1998) MacLeod, G. C., Scalise, E. J., Saedt, S., Galt, J. A., & Gaylard, M. J. 1998, AJ, 116, 1897
- Mueller et al. (2002) Mueller, K. E., Shirley, Y. L., Evans II, N. J., & Jacobson, H. R. 2002, ApJS, 143, 469
- Nagayama et al. (2008) Nagayama, T., Nakagawa, A., Imai, H., Omodaka, T., & Sofue, Y. 2008 PASJ, 60, 183
- Nammahachak et al. (2006) Nammahachak, S., Asanok, K., Hutawarakorn Kramer, B., Cohen, R. J., Muanwong, O., & Gasiprong, N. 2006, MNRAS, 371, 619
- Narayanan et al. (2005) Narayanan, D., Groppi, C. E., Kulesa, C. A., & Walker, C. K. 2005, ApJ, 630, 269
- Palagi et al. (1993) Palagi, F., Cesaroni, R., Comoretto, G., Felli, M., & Natale, V. 1993, A&AS, 101, 153
- Plume et al. (1992) Plume, R., Jaffe, D. T., & Evans, N. J., II. 1992, ApJS, 78, 505
- Scoville et al. (1993) Scoville, N. Z., Carlstrom, J. E., Chandler, C. J., Phillips, J. A., Scott, S. L., Tilanus, R. P. J., & Wang, Z. 1993, PASP, 105, 1482
- Shepherd & Watson (2002) Shepherd, D. S., & Watson, A. M. 2002 ApJ, 566, 966
- Shirley et al. (2003) Shirley, Y. L., Evans II, N. J., Young, K. E., Knez, C. & Jaffe, D. T. 2003, ApJS, 149, 375
- Su et al. (2004) Su, Y.-N., Liu, S. Y., Lim, J., Ohashi, N., Beuther, H., Zhang, Q., Sollins, P., Hunter, T., Sridharan, T. K., Zhao, J.-H., & Ho, P. T. P. 2004, ApJ, 616, L39
- Tafalla et al. (2002) Tafalla, M., Myers, P. C., Caselli, P., Walmsley, C. M., & Comito, C. 2002, ApJ, 569, 815
- Trejo et al. (2009) Trejo, A. et al. in preparation
- Vlemmings et al. (2006) Vlemmings, W. H. T., Diamond, P. J., & Imai, H. 2006, Nature, 440, 58
- Wilson & Rood (1994) Wilson, T. L., & Rood, R. T. 1994, ARA&A, 32, 191
- Zheng et al. (1985) Zheng, X.W., Ho, P.T.P., Reid, M.J., & Schneps, M.H. 1985, ApJ, 293, 522
- Zinnecker & Yorke (2007) Zinnecker, H., & Yorke, H. W. 2007, ARA&A, 45, 481