Red Clump stars in the Boötes III stellar system
Abstract
We report on the detection of a population of Red Clump (RC) stars probably associated with the recently discovered stellar system Boötes III. The RC is identified as a peak in the Luminosity Function (LF) of colour-selected stars extracted from the SDSS database. The peak is consistently detected in the and LFs at the expected luminosity of a typical RC at the distance of Boötes III. Moreover the stars around the LF peak show a maximum of surface density nearly coincident with the reported center of the system. Assuming that the detected feature is the genuine RC of Boötes III, we find that the system has the HB morphology typical of old and metal-poor dwarf spheroidals, it has an integrated magnitude and an ellipticity , quite typical of the recently identified new class of very faint dwarf galaxies.
keywords:
galaxies: dwarf – galaxies: stellar content – stars: distances1 Introduction
The advent of large modern surveys, like the 2 Micron All Sky Survey (2MASS, Skrutskie et al., 2006) and the Sloan Digital Sky Survey (SDSS, Adelman-McCarthy et al., 2008, and references therein), has greatly increased our ability to detect stellar systems and/or structures of very low surface brightness in the halo and the disc(s) of the Milky Way (MW). Large scale sub-structures have been traced over huge portions of the sky (Newberg et al., 2002; Yanny et al., 2003; Majewski et al., 2003; Martin et al., 2004; Juric̀ et al., 2008), but also feeble tidal streams have been found around disrupting globular clusters (see, for example Rockosi et al., 2002; Grillmair & Johnson, 2006) or lacking an evident progenitor (Belokurov et al., 2006; Grillmair, 2009). Moreover, a completely new class of very faint dwarf galaxies (; Martin, de Jong & Rix, 2008, hereafter MJR08) have been discovered (see Belokurov et al., 2007; Zucker et al., 2006a, b; Irwin et al., 2007; Liu et al., 2008, and references therein). These substructures are generally interpreted as the relics of the process of hierarchical assembly of the MW, as predicted by galaxy formation models within the current cosmological scenario (see Bullock, Kravtsov & Weinberg, 2001; Madau et al., 2008, and references therein).
In Bellazzini et al. (2006a, hereafter B06) we used SDSS data to study the stellar content of the largest tidal stream in the halo of the MW, the one produced by the disruption of the Sagittarius dwarf spheroidal (Sgr dSph) galaxy (Ibata et al., 1994; Majewski et al., 2003; Belokurov et al., 2006). In particular, we showed that it is possible to detect the Red Clump (RC) of core-He-burning stars associated with a given sub-structure as a peak in the Luminosity Function (LF) of sub-samples of stars selected in a relatively narrow colour range including the RC. The RC peak of the sub-structure can be disentangled from the fore/background contaminating population of the MW by subtracting the underlying LF, that is, in general, quite smooth and smoothly varying with position in the sky. In B06 we used this technique to compare the Horizontal Branch (HB) morphology in the stream and in the main body of Sgr. However, it was pointed out that the most natural and direct application would be the determination of accurate distances from the magnitude of the detected RC peaks, as the RC is well known and widely used as a standard candle (see Paczynski & Stanek, 1998; Stanek & Garnavich, 1998; Girardi & Salaris, 2001; Babusiaux & Gilmore, 2005; Bellazzini et al., 2006b, and references therein). For intermediate-old age populations, the luminosity of the RC peak shows relatively modest variations as a function of age and metallicity, in particular when measured in the reddest optical passbands (as Cousins’ I, see Girardi & Salaris, 2001). We have used theoretical isochrones from the Girardi et al. (2004) set to verify that this is true also for the SDSS passbands. We found that the magnitude of the RC peak varies by mag, mag, and mag, in , and , respectively, for ages between 4 and 12.5 Gyr over the metallicity range .
We have started an extensive search and analysis of the RC peak along the portion of Sgr stream that is enclosed in the SDSS, a study that is now almost completed (Correnti et al., 2008). During the analysis, while looking at the LF of a control field outside the Sgr stream, we noticed a relatively weak but well defined peak where a smooth LF was expected instead. Following up this finding, we realized that the considered field enclosed a faint stellar system that was very recently discovered with a different technique by Grillmair (2009, hereafter G09), i.e. the possible dwarf galaxy (or relic dwarf galaxy) Boötes III. G09 detected Boo III as a weak overdensity centered at (RA, Dec)=(,) and extending for from the center (but most of the signal is detected within ), at a mean heliocentric distance kpc. The system has been detected with the matched filter technique (Rockosi et al., 2002) that allows the maximization of the signal from the filtered population over the strong Galactic fore/background. The filter adopted by G09 was mostly sensitive to the blue side of the Main Sequence (MS) and Turn Off (TO) region of a typical old and metal-poor population. G09 concluded that “the galaxy is revealed almost entirely by subgiant and TO stars…”. No significant correlation of the new system with structures in the interstellar extinction maps (Schlegel, Finkbeiner & Davis, 1998, hereafter SFD98) was found, and indeed the reddening is quite low in all the (large) area explored by G09. The cluster of galaxies Abell 1824, having a radius of , was noted to lie within from the object, but G09 showed that the density map obtained from the objects classified as galaxies in the SDSS does not present any obvious correlation with Boo III. The field-subtracted CMD (G09 Fig. 12) shows upper MS, TO and SGB features that are reasonably bracketed by the ridge lines of the globular clusters M13 and M15, having [Fe/H] and [Fe/H], respectively. The RGB and (possible) RC remain buried in the subtraction noise, that dominates the plot for . However the inspection of the un-subtracted CMD allowed G09 to identify a population of likely BHB stars (at , where the contamination is very low) probably associated with Boo III. Matching the observed BHB with empirical templates, he found . Boo III is very sparse and appears significantly elongated in the E-W direction. G09 finds it immersed into a very faint stellar stream, dubbed Styx. Since he found that the populations in the two substructures appear similar he concluded that Boo III is (very likely) a disrupting dwarf galaxy physically associated with the stream and that it is its most probable progenitor. In this letter we report on the detection of Boötes III (Boo III) from RC stars and on the new insight on the stellar content of this system obtained from this population.
2 The Red Clump of Boötes III
To trace the RC population of Boo III, that was not detected by G09, we will adopt the technique developed by B06. The technique used by G09 (and many others, see Rockosi et al., 2002; Newberg et al., 2002; Yanny et al., 2003; Belokurov et al., 2006, 2007) is optimized for the detection of new structures, as it maximizes the contrast over the background. It uses mainly MS stars - the most abundant stars in any stellar system - thus reaching very low surface brightness levels and allowing the efficient surveying of large areas of the sky. On the other hand, our approach is best suited for a more accurate localization of detected structures. The method collapses all the information from colour-selected candidate RC stars into a mono-dimensional histogram, where any statistically significant peak provides a direct estimate of the distance. The RC stars are much less numerous than MS stars but, in general, are tightly clumped, both in colour and in magnitude, when placed at the same distance. In the following we will consider the SDSS-DR6 photometry of objects classified as stars (extracted from the SDSS CasJobs query system, Adelman-McCarthy et al., 2008) from two fields: (a) F1, a circular field centered on the center of Boo III (as determined by G09) and with radius , (b) CF, a square Control Field with the same center as F1 but with the inner circle removed. To average out statistic noise in the fore/background population, CF has much lager area than F1 (by a factor of ). As the two globular clusters NGC5466 and M3 were included in CF, we excised from it two circular areas centered on the clusters and having radius , i.e. much larger than their limiting radii (Harris, 1996, H96, hereafter). All the stars are corrected for reddening using the SFD98 maps. The average and standard deviation in E(B-V) is in F1 and in CF. In the following all the reported colours and magnitudes must be intended as corrected for reddening.
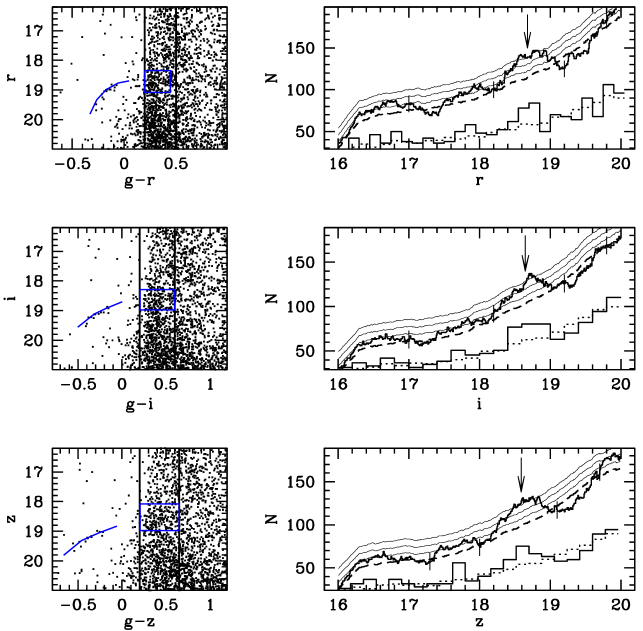
The LFs in , , and of F1 and CF stars, lying in the colour range that is expected to enclose the RC, are compared in the right panels of Fig. 1. The independent colour selections adopted in , and are shown in the corresponding CMDs in the left panels of Fig. 1. The LFs are computed as running histograms having bin width of mag and step of mag, as this approach allows the best determination of the position of peaks (see Bellazzini, Gennari & Ferraro, 2005, and references therein). It seems quite clear that the LFs of F1 present additional structures with respect to CF, for . In particular, all the LFs show a clear peak around that is hardly compatible with a chance fluctuation of star counts. The peak is detected also in the LF but it is not shown if Fig. 1 for reasons of space. The LFs of the CF have been normalized to the F1 ones by minimizing the average difference over large intervals around the main peak, i.e. and , and . In all the considered cases the peaks reach the level above the background, that includes both the Poisson noise and the uncertainty in the adopted normalization.
We estimated the position of the peaks by fitting Gauss curves to the residuals of the subtraction between the LFs of F1 and CF. We obtain , , , and , with a typical uncertainty of mag. If interpreted as genuine Red Clump peaks, these would imply a distance very similar to Boo III. For instance, transforming the theoretical absolute V and I magnitudes of the RC for a Z=0.001, age=10 Gyr population provided by Girardi & Salaris (2001) into and 111Using transformations derived from the comparison between 713 stars in common between the SDSS and Stetson (2000) photometry of NGC 2419., we find and , to be compared with (G09). The coincidence calls for a common origin of the MS + SGB + BHB populations found by G09 and the possible RC detected here.
When dealing with such distant, ghostly systems, with very low surface brightness and luminosity, like Boo III (or Boo II, CV II, etc., see MJR08, Liu et al., 2008), we may face the possibility that the proof of their existence and their characterization can be obtained only by painstaking accumulation of many - sometime weak, but consistent - clues. While the evidence presented here is not sufficient in itself to confirm the presence of a stellar system, we think that it provides strong support to the findings by G09 and it may allow a further insight on the nature of Boo III. In the following we will show that even if the statistical significance of the detected peak is not very strong (), the interpretation of this feature as the RC population of Boo III has an excellent degree of consistency with the known properties of the stellar system.
Even if in Fig. 1 we adopted the intervals that maximize the signal of the RC peak, the feature is well detected for a range of colour selections. On the other hand the colour of the RC is mostly sensitive to the chemical composition (Girardi & Salaris, 2001) and can provide useful indications on the metallicity of the detected population. To allow a direct comparison with empirical templates we studied the RC population of the two old clusters displaying an RC in the SDSS sample by An et al. (2008, i.e., Pal 4, M71). The colour of the putative RC of Boo III () is much bluer than that of M71 ( and ), and even bluer than that of Pal 4 ( and ), suggesting that these stars belongs to a population more metal-poor than , in agreement with the independent results by G09.
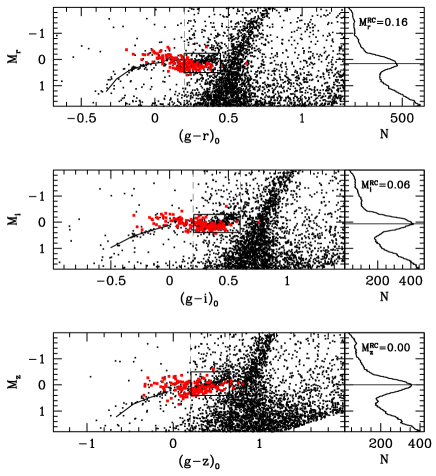
If Boo III is a new stellar system and the LF peak detected here is indeed its RC population, we are facing an old metal-poor system that displays a complex (bi-modal?) HB morphology, having both a BHB and a RC. This is very reminiscent of classical dwarf spheroidal satellites of the MW dominated by old and metal-poor populations like, for example, Sculptor, Sextans, Leo II, Tucana, Ursa Minor and Draco (see Harbeck et al., 2001, and references therein). Since Draco is included in the SDSS it may provide the ideal template for a simultaneous fit of the RC and BHB of Boo III. In Fig. 2 we present a determination of the , , and absolute magnitudes of the RC in Draco, obtained from the peak of colour-selected LFs, as above, from SDSS-DR6 photometry. The adopted reddening and distance are from Bellazzini et al. (2002, hereafter B02), the RR Lyrae are identified from the list by Bonanos et al. (2004). We have also plotted rectangles that approximately comprise the RC in the various CMDs, as well as ridge lines fitting the mean loci of the BHB. With these tools in hand we can attempt a simultaneous fit of the RC and BHB of Boo III. In case of success this will lend strong support to the association of the two features and, in turn, to the interpretation of Boo III as a dwarf galaxy (or relic of). Coupling the apparent magnitudes of Boo III RC from Fig. 1 with the absolute magnitudes of Draco RC from Fig. 2 we obtain , and , from , , and , respectively. Averaging these value we obtain a final estimate of (internal) (external), in good agreement with G09, once taken into account that his estimate is based on the H96 distance scale that is shorter than the scale adopted in B06 (Ferraro et al., 1999). Accounting for this systematic the two estimates differ by only 0.03 mag. Shifting the Draco RC+BHB templates by in the Boo III CMDs we achieve the matches of the BHB shown in the left panels of Fig. 1, that can be considered as very satisfactory. Hence the BHB and the putative RC of Boo III can be simultaneously fitted by the respective Draco templates. Fig. 2 also indicates that (a) our colour-selected RC samples may be contaminated by type ab RR Lyrae observed at random phase, that may partially blur the actual RC signal, and (b) the weak features in the F1 LFs, brighter than the RC peak, may be due to Asymptotic Giant Branch stars falling into the selection window.

In the upper panels of Fig. 3 we show the running histograms of RA and Dec for stars in the RC peak. The two distributions have clear maxima nearly coinciding with the position of Boo III estimated by G09. Moreover the Gauss curve that best fits the peak in the RA direction has a times larger than its counterpart in Dec, nicely confirming the strong E-W elongation found by G09. Finally, the plot in the lower panel of Fig. 3 shows that the surface density profile of RC peak stars displays a radial decline from the center of Boo III, with a slope fully consistent with what found by G09.
3 Discussion
We have detected a peak in the LFs of colour-selected candidate RC stars in a circular field centered on the newly proposed dwarf galaxy Boo III (G09). Even if the statistical significancy of the peak is not particularly strong (), the detection (a) has been consistently obtained in the , and LFs, (b) in all cases it is located at the expected luminosity of Boo III RC, (c) a simultaneous fit of the putative RC and BHB of Boo III has been obtained with RC+BHB templates of Draco dSph, (d) the stars located in the RC peak have a maximum in surface density at the same position in the sky as Boo III, and (e) their radial surface-density profile is fully consistent with that found by G09 for MS stars of Boo III. Hence, it is extremely likely that the detected signal is due to a population that is physically associated with the newly discovered system. This results lend support to the G09 interpretation of Boo III as a new stellar system, possibly a disrupting dwarf spheroidal galaxy, even if a final verdict must wait for spectroscopy of a sizable sample of member stars. If we accept the hypothesis that Boötes III is a genuine stellar system, from the present analysis we can draw the following conclusions:
-
1.
The system has a composite HB morphology very typical of dSph galaxies dominated by old and metal-poor populations (but having a spread in age and metallicity, like Scu, Sex, UMi, Dra). All of these galaxies contains also RR Lyrae variables. By analogy some RR Ly could be present also in Boo III. Re-scaling the population of Draco to the total luminosity of Boo III, RR Ly are expected.
-
2.
The average distance modulus from the RC is corresponding to kpc. The difference with respect to G09 is completely accounted for by the different distance scales adopted. The detected signal is too weak to look for the difference in distance between the Eastern and Western lobes of the galaxy claimed by G09. For the same reason we were unable to find any detectable RC signal from the much fainter Styx stream that was claimed to be associated with the galaxy (G09). 222On the other hand, the LFs of sources, colour-selected as in Fig. 1 and classified as “galaxies” in the SDSS do not show any peak over the whole considered range and lie much below than the level reached by stellar LFs around (by a factor of ), thus confirming the conclusion by G09 that the Boo III overdensity is not associated with the A1824 cluster of galaxies.
-
3.
The technique adopted here allows us to count the RC stars (B06). Adding also the BHB we obtain a rough estimate of the number of core-He-burning stars () that can be directly converted into a distance-independent estimate of the absolute integrated V magnitude by means of the Evolutionary Flux Theorem (Renzini & Buzzoni, 1986), as done in Bellazzini et al. (2006b). Using Eq. 1 of Renzini (1998), adopting the parameters appropriate for a population with [M/H] and age=10 Gyr from Maraston (2005), and yr from the BASTI database (canonical Z=0.01 models of age=8.2 Gyr; Cordier et al., 2007), we get , very weakly depending on the assumed age and metallicity. This value is straight in the middle of the range covered by the new class of faint dwarf galaxies and in agreement with their distribution in the half-light radius vs. plane, for any reasonable choice of in the range between 0.1 kpc and 0.7 kpc, corresponding to and (see MJR08, and references therein). From we also estimated an average surface brightness within of mag/arcsec2. Finally, estimating the ellipticity as (thanks to the E-W orientation of the major axis, see G08 and Fig. 3) we find , also in agreement with the other newly discovered faint dwarfs (MJR08).
Acknowledgments
This research is supported by INAF through the PRIN-2007 grant CRA 1.06.10.04. We are grateful to R. Ibata for a critical reading of the original manuscript.
References
- Adelman-McCarthy et al. (2008) Adelman-McCarthy, J.K., et al., 2008, ApJS, 175, 297
- An et al. (2008) An, D., et al., 2008, ApJS, 179, 326
- Babusiaux & Gilmore (2005) Babusiaux, C., & Gilmore, G., 2005, MNRAS, 358, 1309
- Bellazzini et al. (2002) Bellazzini, M., Ferraro, F. R., Origlia, L., Pancino, E., Monaco, L., & Oliva, E., 2002, AJ, 124, 3222
- Bellazzini, Gennari & Ferraro (2005) Bellazzini, M., Gennari, N., & Ferraro, F.R., 2005, MNRAS, 360, 185
- Bellazzini et al. (2006a) Bellazzini, M., Newberg, H.J., Correnti, M., Ferraro, F.R., & Monaco, L., 2006a, A&A, 457, L21
- Bellazzini et al. (2006b) Bellazzini, M., Ibata, R., Martin, N., Lewis, G.F.,Conn, B., & Irwin, M.J., 2006b, MNRAS, 366, 865
- Belokurov et al. (2006) Belokurov, V., et al., 2006, ApJ, 642, L137
- Belokurov et al. (2007) Belokurov, V., et al., 2007, ApJ, 654, 897
- Bonanos et al. (2004) Bonanos, A.Z., Stanek, K.Z., Szentgyorgyi, A.H., Sasselov, D.D., & Bakos, G.Á, 2004, AJ, 127, 861
- Bullock, Kravtsov & Weinberg (2001) Bullock, J.S., Kravtsov, A.V., & Weinberg, D.H., 2001, ApJ, 548, 33
- Correnti et al. (2008) Correnti, M., Bellazzini, M., Ferraro, F.R., & Monaco, L., 2008, in XXI Century Challenges for Stellar Evolution, S. Cassisi & M. Salaris Eds., Mem. SAIt, 79, 692
- Cordier et al. (2007) Cordier, D., Pietrinferni, A., Cassisi, S., & Salaris, M., 2007, AJ, 133, 468
- Girardi et al. (2004) Girardi, L., Grebel, E.K., Odenkirchen, M., & Chiosi, C., 2004, A&A, 422, 205
- Girardi & Salaris (2001) Girardi, L., & Salaris, M., 2001, MNRAS, 323, 109
- Grillmair & Johnson (2006) Grillmair, C.J., & Johnson, R., 2006, ApJ, 639, 17
- Grillmair (2009) Grillmair, C.J., 2009, ApJ, in press (arXiv:0811.3965v1) (G09)
- Ferraro et al. (1999) Ferraro et al., 1999, AJ, 118, 1738
- Harbeck et al. (2001) Harbeck, D., et al., 2001, AJ, 122, 3092
- Harris (1996) Harris, W.E., 1996, AJ, 112, 1487
- Ibata et al. (1994) Ibata, R., Gilmore, G., & Irwin, M.J., 1994, Nature, 370, 194
- Irwin et al. (2007) Irwin, M.J., et al., 2007, ApJ, 656, L13
- Juric̀ et al. (2008) Juric̀, M., et al., 2008, ApJ, 673, 864
- Liu et al. (2008) Liu, C., Hu, J., Newberg, H.J., & Zhao, Y., 2008, A&A, 477, 139
- Madau et al. (2008) Madau, P. Kuhlen, M., Diemand, J., Moore, B., Zemp, M., Potter, D., & Stadel, J., 2008, ApJ, 689, L41
- Majewski et al. (2003) Majewski, S.R, Skrutskie, M.F., Weinberg, M.D., & Ostheimer, J.C., 2003, ApJ, 599,1082
- Maraston (2005) Maraston, C., 2005, MNRAS, 362, 799
- Martin et al. (2004) Martin, N.F., Ibata, R.A., Bellazzini, M., Irwin, M.J., Lewis, G.F., & Dehnen, W., 2004, MNRAS, 348, 12
- Martin, de Jong & Rix (2008) Martin, N.F., de Jong, J.T.A., & Rix, H.-W., 2008, 684, 1075
- Newberg et al. (2002) Newberg, H.J., et al., 2002, ApJ, 569, 245
- Paczynski & Stanek (1998) Paczynski, B., & Stanek, K.Z., 1998, ApJ, 494, L219
- Renzini (1998) Renzini, A., 1998, AJ, 115, 2459
- Renzini & Buzzoni (1986) Renzini, A., & Buzzoni, A., in Spectral evolution of galaxies, Dordrecht, D. Reidel Pub. Co., p. 195
- Rockosi et al. (2002) Rockosi, C., et al., 2002, AJ, 124, 349
- Schlegel, Finkbeiner & Davis (1998) Schlegel, D.J., Finkbeiner, D.P., & Davis, M., 1998, ApJ, 500, 525
- Skrutskie et al. (2006) Skrutskie, M.F., 2006, AJ, 131, 1163
- Stanek & Garnavich (1998) Stanek, K.Z., & Garnavich, P.M., 1998, ApJ, 503, L131
- Stetson (2000) Stetson, 2000, PASP, 112, 925
- Yanny et al. (2003) Yanny, B., et al., 2003, ApJ, 588, 824
- Zucker et al. (2006a) Zucker et al., 2006a, ApJ, 643, L103
- Zucker et al. (2006b) Zucker et al., 2006b, ApJ, 650, L41