Comments on "Remeasuring the Double Helix"
Abstract
Mathew-Fenn et al. (Science 2008, 322, 446-9) measured end-to-end distances of short DNA and concluded that stretching fluctuations in several consecutive turns of the double helix should be strongly correlated. I argue that this conclusion is based on incorrect assumptions, notably, on a simplistic treatment of the excluded volume effect of reporter labels. Contrary to the author’s claim, their conclusion is not supported by other data.
Long DNA double helices behave as continuous elastic rods placed in a heat bath. [1] The average end-to-end distance and its fluctuations depend upon the temperature, the molecular elasticity and the DNA length . The fluctuations are commonly characterized by one of the two ascending functions, namely, the standard deviation, , or the variance, . The growth of is mainly due to bending. The twisting contribution to is oscillating and it does not accumulate with . However, in fragments much shorter than the bending persistence length (=50 nm) the relative contribution of stretching may become appreciable. If the local stretching fluctuations in a straight double helix are statistically independent (as in the elastic rod), the variance should be a linear function. A convex shape of indicates that local fluctuations are correlated.
The striking conclusion of Mathew-Fenn et al. [2] is based upon a convex (nearly square) measured profile of . This observation is corroborated by similar dependences obtained from the published data for two alternative methods (trsmFRET and DERR). One more method can be added to this list, namely, the atomic force microscopy (AFM). In AFM, the DNA contour length is measured directly by the Gaussian fitting to the distribution produced by a large number of DNA images. Recent studies demonstrated that, in optimal conditions, good agreement with the canonical B-DNA length is reached, [3, 4, 5] with the relative standard deviation nearly constant in the range of DNA lengths from 300 to 4000 bp, corresponding to a square growth of the variance.
A closer look reveals, however, that in all these cases a convex shape of cannot be due to DNA and rather should be attributed to the method. This becomes clear from comparison of the fluctuation amplitudes. The relative standard deviation is about 7 % for the author’s new method, but 17 % for the trsmFRET and DERR, and 3 % for AFM. Three different values cannot all refer to the true DNA fluctuations. Rather the smallest of them obtained with AFM establishes the upper limit because experimental errors augment the amplitudes. The contribution of DNA dynamics in the AFM variance is unknown and probably small, but we can be sure that in the other three methods the variances are dominated by factors other than DNA itself. If the postulated correlations occur only with bp the reported dependence should be continued linearly on bp; the decreases, and the AFM level is reached with bp. This is the lower boundary of the available AFM data (to my knowledge), but the linear profile in AFM is stable over hundreds of bp and there is no reason to suspect that it stops at 300 bp. With some reservations concerning the accuracy of the literature data, we have to conclude that the above discrepancies argue against the author’s interpretation of the convex profile of .
It is more reasonable to suppose that the profiles in all above examples are dominated by other experimental factors. In the present case, the authors erroneously assumed that the bulky labels attached to DNA make a constant contribution to . This would be true if the labels were freely rotating around the points of attachment. In reality, these are bulky objects that, due to the excluded volume effect, on average protrude from DNA and continue it. Their motion effectively increases the bending contribution to the measured variance of . Quantitatively this effect is evaluated in Figure 1 where the data of Ref. 2 are compared with BD simulations of discrete worm-like chain (WLC) models of the corresponding labeled DNA fragments. The BD method correctly samples from the canonical ensembles with correct thermodynamic averages [6]. The gold clusters were modeled as two beads attached to the opposite DNA ends on 1.5 nm strings, which approximately corresponds to their true size and provides satisfactory agreement with experimental regardless of the fitting parameters (see the upper panel of Figure 1). The stretching modulus for was constant for the whole system (1000pN). The bending persistence length of DNA and the average deviation angle of the end labels were varied separately.
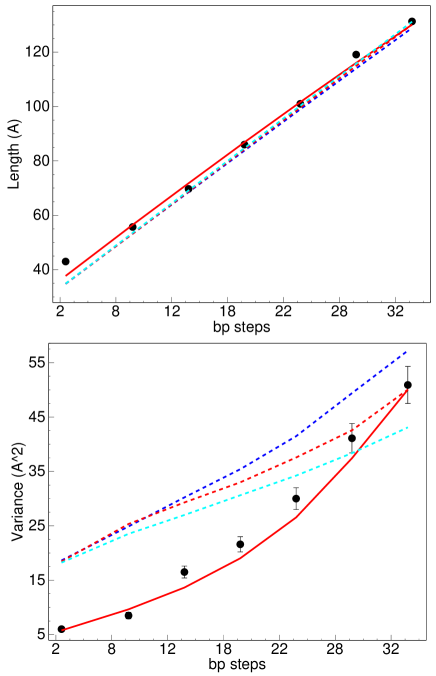
The dashed red lines in Figure 1 display the results for the standard DNA persistence length =50 nm, and adjusted to fit the experimental , which is achieved with . This corresponds to relatively free motion, but the labels never look backward with respect to DNA direction. The bending contribution to the variance for 35bp unlabeled DNA is about 7 Å2. With the labels attached, it is greatly increased due to the end fluctuations enhanced by the flexibility of DNA. This is seen from the difference between the blue, red, and cyan traces corresponding to =40, 50, and 60 nm, respectively, with the same . For very short DNA the three traces converge to the value corresponding to the proper contribution of the attached clusters. It is larger than in experiment because, with small , the clusters interact directly. The cluster-cluster excluded volume effect significantly restrains their motion, which can be readily shown by introducing appropriate potentials (not shown). Figure 1 checks how strong these restraints should be to fit the experimental data. To this end, the value was was fit to experiment for L=4bp and the corresponding energy coefficients were linearly interpolated for 4bp<L<35bp. The result is shown in Figure 1 by the solid red line. The corresponding values gradually increase from 30∘ to 46∘, which is not large.
As we see, these experimental data can be well accounted for with a few physically reasonable assumptions. The most important of them concerns the cluster-cluster interactions, however, it is supported by the published distance distribution for these clusters joined by a flexible hinge. [7] Notably, the contact distance is 40 Å, which corresponds to the diameter of a passivated cluster plus two layers of hydration water. The same data [7] suggest that the cluster-cluster interactions are long-range and may well continue to 100 Å. The fitting in Figure 1 demonstrates that is very sensitive to the amplitude of the end fluctuations. The clusters are attached to DNA by flexible hinges, therefore, the actual value of would be affected by weak environmental factors, like electrostatic and hydration end effects that may slightly evolve with the DNA length.
One can note in conclusion that, although the new molecular ruler developed by the authors opens interesting new prospects in studying biomacromolecules, neither their data nor the earlier literature indicate the existence of long-range stretching fluctuations in double helical DNA.
References
- [1] Cantor, C. R.; Schimmel, P. R. Biophysical Chemistry, Part III: The Behavior of Biological Macromolecules; W. H. Freeman: San Francisco, 1980.
- [2] Mathew-Fenn, R. S.; Das, R.; Harbury, P. A. B. Science 2008, 322, 446–9.
- [3] Rivetti, C.; Codeluppi, S. Ultramicroscopy 2001, 87, 55–66.
- [4] Sanchez-Sevilla, A.; Thimonier, J.; Marilley, M.; Rocca-Serra, J.; Barbet, J. Ultramicroscopy 2002, 92, 151–158.
- [5] Podesta, A.; Imperadori, L.; Colnaghi, W.; Finzi, L.; Milani, P.; Dunlap, D. J Microscopy-Oxford 2004, 215, 236–240.
- [6] Mazur, A. K. J. Phys. Chem. B 2008, 112, 4975–4982.
- [7] Mathew-Fenn, R. S.; Das, R.; Silverman, J. A.; Walker, P. A.; Harbury, P. A. B. PLoS ONE 2008, 3, e3229.
Appendix
The foregoing Technical Comments were considered for publication
in Science during four months and rejected based upon the
considerations given in the letter below. Regrettably, the Science
editors were strongly against posting this information and I had to
drop the referee’s comments.
13 April 2009
Dear Dr. Mazur:
Thank you for submitting your Technical Comment on the Science paper by Mathew-Fenn et al.
We sent your comment and the author response, which is attached for your information, out to two external referees for evaluation. Unfortunately their reviews (appended below) are not positive enough to support publication of your manuscript. As you’ll see, although the referees felt that your comment raised potentially valid technical points, they did not find the development of those points sufficiently clear and persuasive to drive the debate forward and provide an enlightening discussion for the broad readership of Science.
Although we recognize that you may be able to address some of the specific criticisms in a revised manuscript, the overall nature of the reviews is such that the manuscript would not be able to compete with other Technical Comments under consideration. Notwithstanding this disappointing outcome, we appreciate the chance to consider the comment, and hope that you find the authors’ response and the referee comments helpful should you decide to prepare the manuscript for submission to another journal. Thanks for your patience during this long process, and thanks for your interest in Science.
Sincerely,
Tara S. Marathe
Associate Online Editor, Science
tmarathe@aaas.org