The Precision Array for Probing the Epoch of Reionization: 8 Station Results
Abstract
We are developing the Precision Array for Probing the Epoch of Reionization (PAPER) to detect 21cm emission from the early Universe, when the first stars and galaxies were forming. We describe the overall experiment strategy and architecture and summarize two PAPER deployments: a 4-antenna array in the low-RFI environment of Western Australia and an 8-antenna array at our prototyping site in Green Bank, WV. From these activities we report on system performance, including primary beam model verification, dependence of system gain on ambient temperature, measurements of receiver and overall system temperatures, and characterization of the RFI environment at each deployment site.
We present an all-sky map synthesized between 139 MHz and 174 MHz using data from both arrays that reaches down to 80 mJy (4.9 K, for a beam size of 2.15e-5 steradians at 154 MHz), with a 10 mJy (620 mK) thermal noise level that indicates what would be achievable with better foreground subtraction. We calculate angular power spectra () in a cold patch and determine them to be dominated by point sources, but with contributions from galactic synchrotron emission at lower radio frequencies and angular wavemodes. Although the cosmic variance of foregrounds dominates errors in these power spectra, we measure a thermal noise level of 310 mK at for a 1.46-MHz band centered at 164.5 MHz. This sensitivity level is approximately three orders of magnitude in temperature above the level of the fluctuations in 21cm emission associated with reionization.
Subject headings:
cosmology: observations, instrumentation: interferometers, radio continuum: general, techniques: interferometric, site testing, telescopes1. Introduction
The Epoch of Reionization (EoR) marks the transition of the primordial intergalactic medium (IGM) from a neutral to a highly ionized state as a result of radiation from the first stars and massive black holes (Loeb & Barkana, 2001). This phase transition represents a key benchmark in the history of cosmic structure formation and a major frontier of cosmic evolution yet to be explored. Observations of Gunn-Peterson (GP) absorption by the IGM towards distant quasars (Becker et al., 2001; Fan et al., 2006) and large-scale Cosmic Microwave Background (CMB) polarization from Thompson scattering (Page et al., 2007) have constrained cosmic reionization between redshifts . However, deeper exploration of reionization via these probes faces fundamental limitations: the GP-effect saturates at low neutral fractions and CMB polarization is an integral measure of the Thompson optical depth to recombination.
The most incisive probe of EoR is direct observation of the neutral IGM using the hydrogen 21cm line (Furlanetto et al., 2006; Barkana & Loeb, 2005a). The rich astrophysics traced by HI and the intrinsic three-dimensionality of the signal make this approach especially appealing (Barkana & Loeb, 2005b; Loeb & Zaldarriaga, 2004). However, the challenges of exploring reionization with red-shifted 21cm emission in an observing band below 200 MHz are daunting. EoR detection experiments require unprecedented levels of instrumental calibration and foreground characterization. The brightness temperatures of polarized galactic synchrotron emission, continuum point-sources, and galactic/extra-galactic free-free emission can exceed the expected 10 mK fluctuations of the 21cm EoR signal by more than 5 orders of magnitude (Zahn et al., 2007; Santos et al., 2005). Wide fields-of-view (FoVs), large fractional bandwidths, large numbers of antennas, significant RFI environments, and ionospheric variation all present challenges for next-generation low-frequency arrays.
The Precision Array to Probe the Epoch of Reionization (PAPER) is a first-generation experiment focused on statistical EoR detection, but with sufficient sky coverage and sensitivity to detect the very rare, largest-scale structures formed at the end of reionization. PAPER represents a focused effort to overcome the substantial technical challenges posed by using large, meter-wave interferometric arrays to detect the 21cm EoR signal.
In §2, we present the principle deployments of the PAPER instrument. We then outline the architectures of the analog (§3) and digital (§4) signal paths and describe the calibration pipeline (§5) that is applied to the data. Finally, we present observational results in §6 that include an all-sky map and angular power spectra measured toward a colder patch of the synchrotron sky.
2. PAPER Deployments
PAPER is being developed as a series of deployments of increasing scope to address the instrumentation, calibration, and foreground characterization challenges that must be surmounted in order to detect a 21cm signal from EoR. By characterizing and optimizing each component in the array with careful engineering, we hope to reduce the complexity of data calibration and analysis. Our staged approach allows for a systematic investigation of observational challenges, with a capacity for adaptation as the characteristics of our instrument and of interfering foregrounds are better understood.
| PGB-4 | PWA-4 | PGB-8 | PWA-64 | ||
| Deployment Date | 2004 | 2007 | 2006-8 | (2009) | |
| 4 | 4 | 8 | 64 | ||
| 1 | 1 | 1 | 4 | ||
| (str) | .96 | .96 | 0.43 | 0.43 | |
| (MHz) | 100 | 150 | 150 | 100 | |
| 256 | 2048 | 2048 | |||
| (s) | 32 | 7.16 | 14.32 | ||
| (days) | 1 | 3 | 14 | 90 | |
| (m) | 100 | 150 | 300 | 600 | |
There have been three principal PAPER deployments, whose characteristics, along with a planned 64 antenna deployment, are outlined in Table 1; is the number of antennas in each deployment; is the number of polarization cross-multiples computed in the correlator; denotes the solid angle of the primary beam at 150 MHz; is the correlated bandwidth; is the number of frequency channels computed over the correlated bandwidth; is the integration time per visibility; is the longest continual operation; is the approximate maximum baseline length. In its initial 2004 deployment at the NRAO facilities in Green Bank111The National Radio Astronomy Observatory (NRAO) is owned and operated by Associated Universities, Inc. with funding from the National Science Foundation. the PAPER instrument consisted of four sleeved dipoles above planar ground-screens arranged on an east-west line with integrated differential amplifiers. This minimum-redundancy array, dubbed PGB-4, had a longest baseline of 100 meters and provided initial field experience and a means by which to evaluate our analog and digital electronics. PGB-4 established PAPER’s basic architecture as that of a transit array of zenith-pointing dipoles connected to a central correlator via fixed-length cables running above ground.
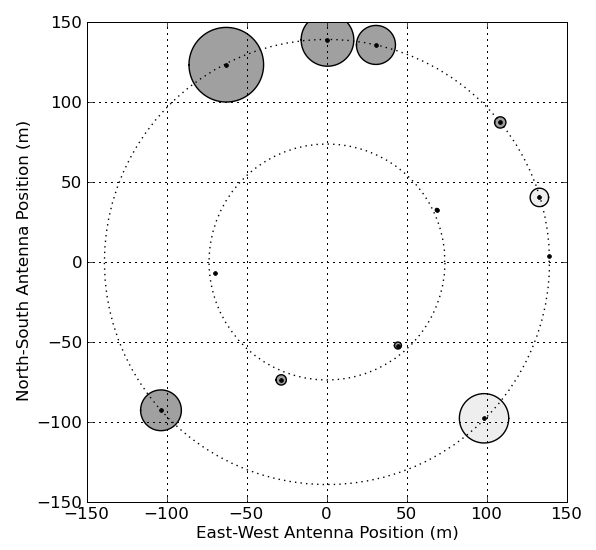
The second PAPER deployment, PGB-8, began in 2006 and underwent continual development until it was upgraded to PGB-16 in October 2008. PGB-8 consisted of eight antennas deployed on a 300m diameter circle (Fig. 1) at the NRAO Green Bank Galford Meadow site, with a small hut for rudimentary climate control built at the center of the array to house the receivers and correlator. As discussed in §3, antenna signals propagate to the hut over 75 ohm coaxial cable. The correlator itself went through several cycles of improvement paralleling the development of the scalable correlator architecture described in §4. In its final state, the PGB-8 correlator employed a packetized correlator (PaCo-8) that processed 2048 spectral channels across 150 MHz of bandwidth, computing all 4 Stokes parameters, although the analog system only supported one polarization. In early 2008, we improved the forward gains of antennas by adding side reflectors to the ground-screens.
Our third deployment, PWA-4, was near the Murchison Radio Observatory (MRO) site222We acknowledge the Wajarri-Yamatji people of Australia as the Native Title Claimants of the purposed MRO lands and we thank them for allowing scientific activity on the site. in Western Australia in July 2007. This path-finding array gave us firsthand experience with the logistics of deploying and operating an array at a very remote site. The success of this deployment gave us confidence in the low RFI levels and data quality that can be expected from a much larger array at this site. PWA-4 consisted of four antennas with planar ground-screens (no side reflectors) arranged in a trapezoid pattern with a maximum baseline of 150m. The 4-input “Pocket Correlator” (PoCo) described in §4 correlated signals from these four elements.
A fourth deployment, PGB-16, is underway. A total of sixteen sleeved dipole antennas using ground-screens with side reflectors have been deployed at Galford Meadow. Initial operations are proceeding in single-polarization mode using PaCo-8, but will evolve to dual-polarization with a PaCo-16 correlator.
3. The Analog System
The levels of instrumental calibration and foreground characterization that will be required to model and remove signals interfering with an EoR detection are unprecedented in the 100-MHz to 200-MHz band expected to encompass reionization. With this in mind, we have taken care that each stage of our analog system (see Fig. 2) exhibits smooth responses as a function of frequency and direction, thereby minimizing the number of parameters needed to describe these responses and limiting the magnitude of errors introduced by imperfect calibration.
3.1. Antenna Design
PAPER antennas are designed as rugged dual-polarization versions of the sleeved dipole (Johnson, 1993). Crossed dipoles made from copper tubing are encased between two thin aluminum disks, creating a dual-resonance structure that broadens the antenna’s frequency response. The dimensions of the tubing and disks have been tuned for efficient operation over a 120-MHz to 170-MHz band. This design produces a spatially smooth primary beam pattern that evolves slowly with frequency.
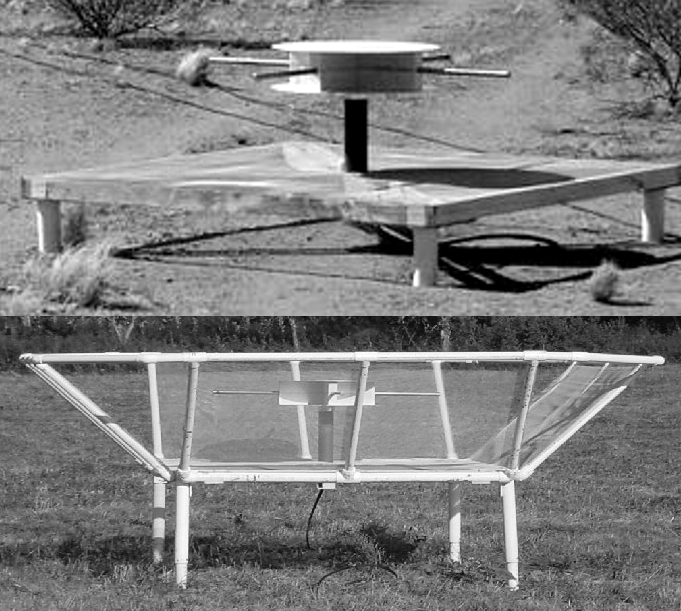
The antenna design includes a grounding structure that alleviates the gain variations that result from the effects of climatic conditions on the dielectric properties of earth ground. PGB-4 and PWA-4 deployments employed simple wire-mesh ground planes supported by a wooden framework (Fig. 3, top). This design was improved to include planar wire-mesh reflectors that attach to the original ground-screen (now supported by a steel framework) and rise outward at a angle (Fig. 3, bottom), essentially becoming a dual-polarization trough reflector (Hall, 1988). This design produces a primary beam whose angular size more closely matches the angular size of colder patches in galactic synchrotron emission, effectively reducing PAPER’s sky-noise-dominated system temperature. Reduction of horizon gain also mitigates susceptibility to some RFI sources. We have ensured that these side-reflectors have not compromised the spatial and spectral smoothness of the primary beam.
The smoothness of the primary beam as a function of frequency and direction enable it to be effectively parametrized using low-order spherical harmonics and frequency polynomials according to the equation:
| (1) |
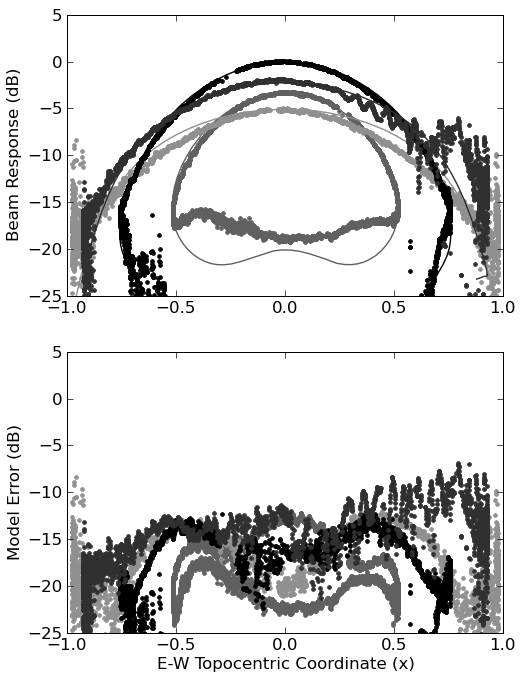
where the frequency-dependence of the antenna response is modeled by a seventh-order polynomial and the spatial variation of each polynomial coefficient is described by coefficients of low-order spherical harmonic functions . This first-order beam model smoothly interpolates to any chosen pointing and frequency, and has been assumed for all of the analysis presented in this paper. As shown in Figure 4, the model predicts the perceived flux densities of sources with approximately 93% accuracy for zenith-angles less than . Errors in the beam model are primarily the result of the spectral response of the primary beam being steeper as a function of zenith angle than what is predicted by the model. This systematic effect is currently impeding the accurate measurement of spectral indices of calibrator sources.
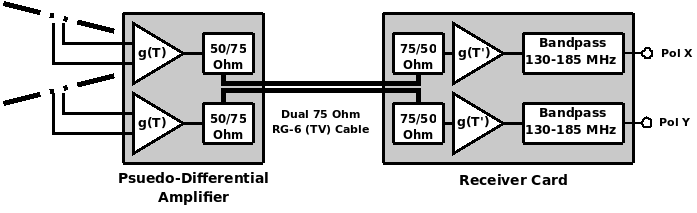
3.2. Pseudo-Differential Amplifier Design
A pseudo-differential amplifier (PDA, Fig. 5) is housed within the riser suspending each dipole element above its ground-screen. Amplifiers employ three cascaded gain stages where the initial stage consists of a differential amplifier based on NEC NE46100 bipolar junction transistors. This circuit features an inherent direct-current pathway from input to ground, making the amplifier tolerant of electrostatic charge build-up that can pose a serious problem in dry climates (Jackson & Farrell, 2006). The total 32 dB gain through the PDA unit is sensitive to ambient temperature with a coefficient over the range 5–50∘C. This coefficient enters into the voltage gain of an antenna as
| (2) |
where is the ambient temperature as a function of time and represents a fixed time at which static gain calibration is performed. Although not corrected for in the PWA-4 and PGB-8 systems, gain variation with temperature can be partially offset by recording the average ambient temperature of the array and applying a correction to all recorded visibilities. We are currently developing a system for using one antenna input as a “gain-o-meter” by swapping dipoles for a load attached at the front of the PDA unit and using the gain variation of this input to normalize the gains of the other antenna inputs. A more advanced system could also record the ambient temperature at each PDA to allow for per-antenna gain correction.
We have estimated the receiver temperature of the antenna/PDA system by modeling the frequency-dependent auto-correlation power as a function of time :
| (3) |
where is defined in Equation 2; is the temperature of a model galactic synchrotron sky weighted by the primary beam of an antenna; is the receiver temperature; is the bandwidth of a channel. was modeled by scaling a 408-MHz sky map (Haslam et al., 1982) to 162 MHz using a spectral index of -2.52 (Rogers & Bowman, 2008). As the galactic synchrotron sky rotates through the primary beam, the perceived varies, providing a modulation that enables the separation of sky and receiver temperatures. After applying a first-order correction for the temperature-dependence of amplifier gain using measured temperatures from a nearby weather station, we fit an average receiver temperature of 110 K for the PGB-8 system.
3.3. Signal Transmission
Coaxial cables transport antenna signals from each PDA unit to a central processing location. Because these cables are not buried, they must be rugged to withstand harsh environmental conditions and the occasional chew from local fauna. We chose RG-6, 75 ohm cable with a polyethylene jacket for its stable propagation characteristics as a function of temperature and humidity and for its low cost. Signal attenuation over a 150m cable run is approximately 12 dB at 150 MHz, with a slope of . This cable also contains a wire suitable for delivering DC power to PDA units.
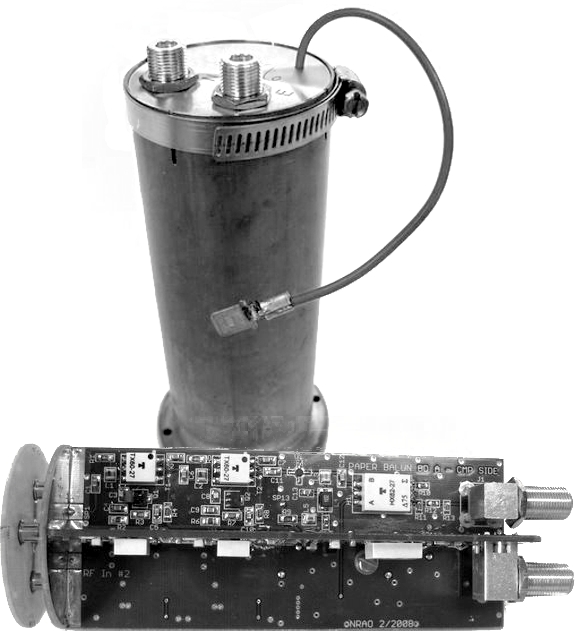
On the receiving end, dual-channel receiver boards consisting of amplifier stages and band-limiting filters prepare signals for digitization in the correlator. The high gain of these receiver cards poses a significant regenerative feedback concern not found in heterodyne systems (Slurzberg & Osterheld, 1961). This issue was mitigated by mounting the receivers inside a special shielded enclosure (Bradley, 2006). The gain of the amplifiers in the receiver cards is also sensitive to temperature, with a coefficient of . To avoid a second temperature dependence in signal gain, a thermal enclosure with thermoelectric heat pumps will be employed to stabilize the temperature of all receiver boards. The “gain-o-meter” approach described in §3.2 will also provide a first-order correction.
4. The Digital System
A series of real-time digital FX correlators employing Field-Programmable Gate Array (FPGA) processors addresses the growing digital signal processing (DSP) needs of visibility computation in PAPER deployments. These correlators are based on the architecture described in Parsons et al. (2008), wherein DSP engines transmit packetized data through 10-Gbit Ethernet (10-GbE) links to commercial switches that are responsible for routing data between boards. This architecture, along with a set of analog-to-digital converters and modular FPGA-based DSP hardware and a software environment for programming, debugging, and running them, were developed in collaboration with the Center for Astronomy Signal Processing and Electronics Research (CASPER, Parsons et al. 2006). The flexibility of this correlator design shortens development time, allowing a series of correlators of increasing scale to be developed parallel to PAPER’s incremental build-out.
4.1. CASPER Hardware and Gateware
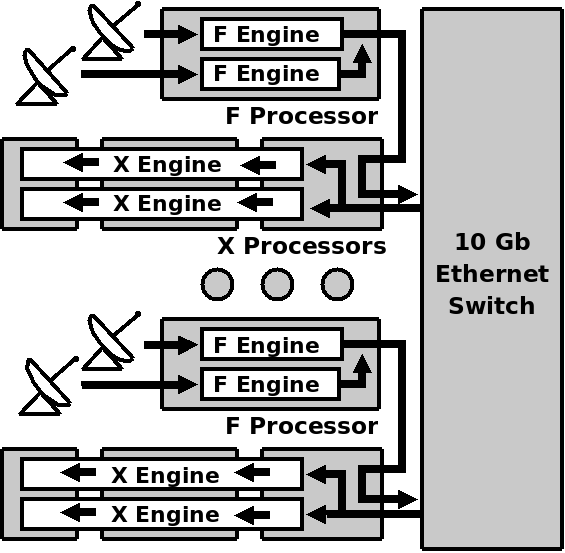
The generic FX correlator architecture (Fig. 6) on which PAPER correlators are based consists of a set of modules responsible for digitizing, down-converting, and channelizing antenna inputs (“F” Engines), followed by a set of signal processing modules that cross-multiply all antenna and polarization samples for each frequency and accumulate the results (“X” Engines). The problem of transmitting data from every F engine to every X engine is solved by packetizing data according to the 10-GbE protocol and then using a commercial switch to sort data streams. This approach, unique to the CASPER architecture for correlators of this size and bandwidth, avoids custom backplanes and communication protocols that are tailored to a single application, which are the traditional solution to the cross-connect problem in correlators.
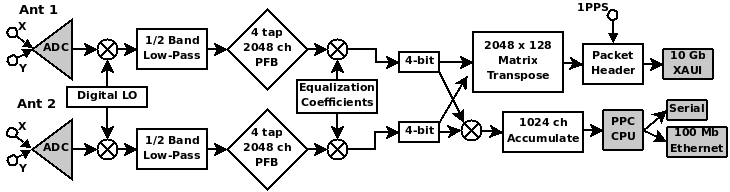
Signals from PAPER antennas are digitized by Atmel AT84AD001B dual 8-bit ADC chips capable of digitizing two streams at 1 Gsample/sec. While overrated for this application, this chip has been used in many CASPER applications and is extensively tested. The wide bandwidth of this ADC allows the entire PAPER bandwidth to be Nyquist-sampled as a single, real voltage and then digitally mixed to baseband with perfect in-phase and quadrature-phase components. Two ADC boards connect to each of the CASPER IBOB processing boards used as F engines in PAPER’s correlator. On the IBOB, one FPGA is responsible for the signal flow outlined in Figure 7–namely, digitally down-converting four digitized signals, spectrally decomposing the resulting baseband signals using a Polyphase Filter Bank (PFB) (Crochiere & Rabiner, 1983; Vaidyanathan, 1990), and re-quantizing spectral data to 4 bits. PAPER correlators equalize antenna spectra before re-quantization to ensure optimal linearity of the output power with respect to input power, as described in §5.1. Output data are passed briefly to the BEE2 board (described below) where they are formatted into 10-GbE packets and transmitted to a commercial switch.
A 12-port Fujitsu CX600 10-GbE switch is employed for routing packets between F and X engines. Each port on this switch carries data for two antennas. The performance of this switch was evaluated over a period of 16 hours, with pseudo-random data transmitted and received on each data link. During this time, no errors were detected, placing a limit on the bit-error rate of transmission at 2.2e-16 bits/s. Furthermore, the asynchronous correlator architecture employed by PAPER is tolerant of dropped packets, so errors that do occur do not cause system failures.
We rely on CASPER’s BEE2 boards for implementing X engine processing. Each of four FPGAs on a BEE2 operates independently to unscramble packets received from the 10-GbE switch. Two X engine cores inside each BEE2 FPGA then compute cross-multiplications for all antennas for 1/ of the frequency channels and the results are accumulated for a selectable time interval. Output of accumulated data over a 100-Mbit Ethernet connection currently imposes a 14-second minimum integration time. We are currently migrating this output to 10-GbE, which will allow shorter integrations that more adequately resolve ionospheric fluctuations.
4.2. PoCo and PaCo-8
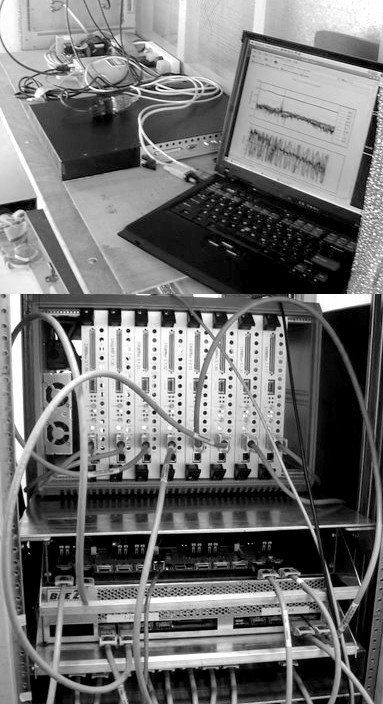
The “Pocket Correlator” (PoCo, Fig. 8, top) used with the PWA-4 deployment is a single IBOB system for correlating and accumulating four input signals (Fig. 7). ADCs sample each analog input at 600 MHz and a 75-MHz to 225-MHz band is extracted digitally. A 4-tap PFB decomposes this sub-band into 2048 channels, which are then equalized to remove per-channel scaling differences before being re-quantized to 4 bits. Limited buffer space on the IBOB permits only 1024 channels (selectable from within the 2048) to be accumulated. Accumulated visibilities are output via serial connection to a host computer after being integrated for 7.16 seconds.
The 8-antenna packetized correlator (PaCo-8, Fig. 8, bottom) used with the PGB-8 deployment employs four IBOBs and one BEE2 board that communicate through a Fujitsu XG700 10-GbE switch, following the architecture outlined in Figure 6. Each IBOB in this system operates identically to PoCo, but branches data from the equalization module to a matrix transposer for forming frequency-based packets. Packet data for each antenna are multiplexed through a point-to-point connection to a BEE2 FPGA and then relayed in 10-GbE format to the switch. A central CPU on each BEE2 board collects all visibility data after it has been accumulated for 14.32 seconds and transmits it over 100 Mb Ethernet to a server where it is written to disk in MIRIAD format (Sault et al., 1995). In field deployments, correlators are housed inside a special shielded enclosure (Bradley, 2006) to mitigate self-interference.
5. The Calibration Pipeline
The greatest challenge of using low-frequency interferometry to detect the cosmic reionization lies in characterizing the celestial sky and modeling the system response such that foregrounds to the EoR signal can be effectively suppressed. Various methods for estimating the effects of instrumental calibration on a statistical EoR detection have been analyzed (Morales, 2005; Morales et al., 2006; Bowman et al., 2006), but improving the calibration and stability in early instruments remains an open problem (Yatawatta et al., 2008; Bowman et al., 2007). Wide fields-of-view, large fractional bandwidths, strong RFI environments, and ionospheric variation all complicate the calibration of next-generation low-frequency arrays such as PAPER, the Murchison Widefield Array333http://haystack.mit.edu/ast/arrays/mwa (MWA), the Long Wavelength Array444http://lwa.unm.edu (LWA), and the LOw Frequency ARray555http://www.lofar.org (LOFAR). Obtaining an accurate sky model requires accurate models of primary beams, receiver passbands, gain variation, and array geometry. However, characterization of these often depends on the availability of an accurate sky model. The PAPER approach to this problem has been to emphasize precision, with the goal of characterizing system components to within 1% in order to facilitate further model refinement via sky modeling and self-calibration.
Although many standard tools exist for calibrating interferometric data, we are developing an open-source software project called Astronomical Interferometry in PYthon666http://pypi.python.org/pypi/aipy (AIPY) that modularizes interferometric data reduction to facilitate the exploration of new algorithms and calibration techniques. The niche targeted by this package are developing arrays whose evolving instrumental characteristics require flexible, adaptable tools. AIPY uses the dynamically interpreted Python programming language to wrap together interfaces to packages such as MIRIAD (Sault et al., 1995) and HEALPix (Górski et al., 2005) using a common numerical array interface. AIPY also includes object-oriented implementations of a wide range of algorithms useful for radio interferometry, including W-Projection (Cornwell et al., 2003), CLEAN (Högbom, 1974), Maximum-Entropy deconvolution (Cornwell & Evans, 1985; Sault, 1990), aperture synthesis imaging, faceted map-making, visibility simulation, and coordinate transformations. AIPY relies heavily on 3rd party, public-domain modules for scientific computing, allowing its development to focus on interferometry-specific functionality.
AIPY analysis centers around parametrizing interferometric measurement equations for the instrument in question. However, before data from a PAPER correlator is ready to be compared to the measurement equation shown in Equation 4, it requires gain linearization, RFI excision, and crosstalk removal.
5.1. Gain Linearization
Mitigating the effects of data quantization in the PAPER correlator requires that power levels be carefully set for optimal SNR and that output data be converted to a linear power scale (see Ch. 8 of Thompson et al. (2001)). Correction factors for gain non-linearities in digital systems employing 1-bit and 2-bit quantization of voltage samples are well-known. The non-linear power response of the PAPER correlator, with its 4-bit correlation, is still significant. Our approach to gain linearization is detailed in Parsons et al. (2008). Inside the correlator, optimal SNR during re-quantization is ensured by applying an equalization function that shifts data samples to the region of maximal linearity in the 4-bit quantization response curve. This equalization function is updated hourly to adjust for changing mean power levels as the galactic synchrotron sky traverses the dipole beam. The first steps of PAPER calibration are to deduce an average 4-bit value from the accumulated output of the correlator, to invert the known quantization response for this value (Fig. 13 in Parsons et al. (2008)), and then to remove the equalization function used in the correlator.
5.2. RFI Excision
As a general solution to identifying data points that depart from an otherwise smooth function, we employ an algorithm that iteratively fits a smooth polynomial to visibility amplitudes, subtracts that polynomial to identify and exclude outlying points, and repeats. This algorithm identifies outlying points by finding the mean and standard deviation of the logarithm of all data points and defining a threshold in units of the standard deviation. The effectiveness of this technique is improved by first subtracting simulated visibilities using accurate models of the array response and the celestial sky.
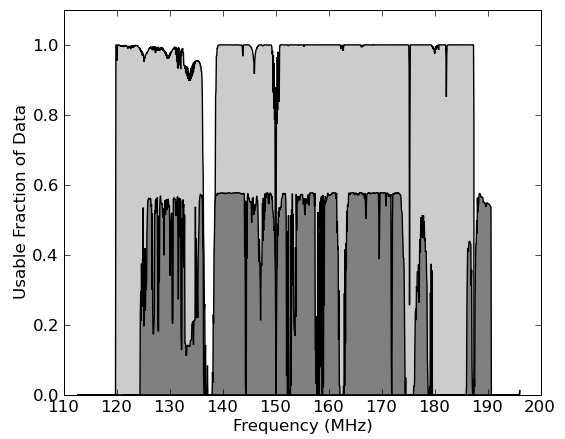
This RFI excision algorithm is applied to spectra of cross-correlation data to identify narrow-band interference and to time-series in auto-correlation data to identify integrations where strong RFI such as aircraft communication saturates the ADC input. Such saturation events result in wide-band “drop-outs” where signal is lost across all frequencies. In both cases, detection of an interference event in a given channel/integration on any baseline results in that data being flagged for all baselines. Figure 9 illustrates the usable fraction of data averaged over a full day for the PGB-8 and PWA-4 deployments. The RFI environment in Western Australia represents a marked improvement over that of Green Bank, with fewer channels occupied by continuous RFI and almost no ADC saturation events. Such events cause approximately 40% of PGB-8 integrations to be unusable.
5.3. Crosstalk Removal
The inadvertent introduction of a correlation between two independent inputs via a cross-coupling pathway is unavoidable in radio interferometers. Many systems use phase switching to help remove crosstalk introduced along the signal path from an antenna to the ADC. PAPER does not currently implement phase switching, although we are exploring options for doing so. However, in the absence of (or in addition to) phase switching, there are other techniques for removing crosstalk from visibility data, provided that such crosstalk is adequately stable with time. PAPER’s crosstalk is modeled as an additive component of measured visibilities that varies slowly on the timescale of several hours. Because this crosstalk is stable on a timescale much longer than the inverse of the typical fringe-rate of a source over the shortest baseline and because its power is concentrated at low delays, PAPER crosstalk is easily suppressed using frequency-based time-averages or delay/delay-rate filters (Parsons & Backer, 2009). As with RFI, crosstalk removal is facilitated by the subtraction of simulated visibilities.
5.4. PAPER’s Measurement Equation
At the heart of the PAPER analysis model is a measurement equation for the single polarization visibility response () of a baseline at channel center frequency and time :
| (4) |
where is a time-dependent unit vector pointing in the direction of a source whose flux density is ; is the frequency-dependent baseline response, which is expressed in terms of the voltage gain of each antenna (; Eq. 2) for constituent antennas indexed by ; is the direction-dependent response of a baseline’s primary beam, expressed in terms of the electric field response of each antenna (; Eq. 1); represents the baseline vector separating antenna positions in units of light propagation time; is the relative electronic delay of antenna signals into the correlator; and is a relative instrumental phase between antenna signals.
The design of our antenna and analog electronics leads to antenna-based gains () that can be modeled by smooth functions in time and frequency with a modest number of parameters. The degrees of freedom in these parameters are over-constrained by wide-band visibility data, even when using a sky model that includes only a small number of point sources. However, the larger FoV of PAPER elements has complicated early calibration by decreasing the extent to which a single source dominates the correlated signal between antennas. Without isolation of sources, self-calibration cannot proceed as a direct computation using raw data, but rather must proceed by fitting models of the array and the observed sky to remove baseline-dependent interference patterns (Cornwell & Fomalont, 1989). To address this problem, we employ a two-tiered calibration process wherein initial coarse calibration that employs source-isolation techniques is followed by multi-source, least-squares fitting to visibilities for the parametrization described in (4).
5.5. First-Order, Time-Independent Self-Calibration
Phase calibration involves solving for the position and electronic signal delay associated with each antenna. The parameter space associated with phase calibration contains many local minima separated by wavelength increments projected toward calibrator sources. To speed the phase calibration process, we rely on theodolite-surveyed antenna positions. When initial antenna positions include errors greater than a wavelength, we have developed a procedure for fitting positions that is reasonably robust against converging to non-global minima. First, a single source is isolated in data either by selecting a time when one source is dominant, or by using coarse delay/delay-rate filtering (Parsons & Backer, 2009). Baseline components and a throw-away phase term are then fit for a pair of nearby antennas using a narrow set of frequency channels and a range of time over which fringes wrap several times. Next, data including a few other sources are used to separate out of the remaining phase term. As a final step in single-baseline phase calibration, wide-bandwidth data are used to account for the final phase as a combination of electronic signal delay () and a small, frequency-independent phase term ().
Following accurate phase calibration for a subset of antennas, another antenna is added and the procedure outlined above is repeated using data for all baselines that connect this antenna to the calibrated subset. With phase calibration for four antennas, preliminary antenna-based gain calibration is possible. PAPER visibilities have been flux-calibrated using Cygnus A with a value of 1.09e4 Jy at 150 MHz and a spectral index of 0.69, which are derived from the data in Baars et al. (1977). The beam model described in §3.1 provided a first-order correction for the effects of the primary beam on the Cygnus A spectrum. In addition to an initial gain model that incorporated the measured responses of the analog and digital filters in the PAPER pipeline, fourth-order polynomials in frequency were fit for the bandpass functions () of antennas in the array.
At each stage, the residuals remaining after flux-calibration can help to highlight baselines with poorer fit scores–a hallmark of convergence to a non-global minimum. Once all problematic baselines have been eliminated, simultaneous fitting of phase and gain parameters can proceed until time-variable effects such as ionospheric distortion and changing primary beam response towards strong sources dominate residual visibilities.
5.6. Excision of Strong Point-Sources
Strong point-sources, while useful for initial calibration, complicate further calibration by degrading sensitivity toward other positions on the sky. This is especially true for small arrays, since the sidelobe response toward a source scales approximately as , where is the number of independent locations in the -plane that are being phased and summed. For PWA-4 and PGB-8, sources stronger than a few hundred Jy can dominate the response of a synthesized beam, even when using earth rotation synthesis.
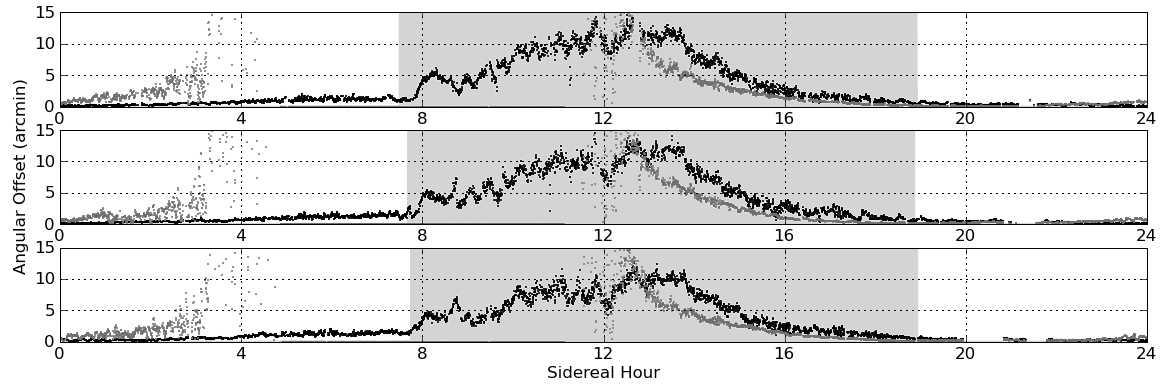
Deep removal of the strongest sources is essential for improving primary beam models using sources at a variety of declinations. A time-invariant model of source position, flux density, and spectral index is moderately effective at removing these sources, depending on the accuracy of current beam models and the activity of the ionosphere. For PGB-8, we were able to achieve 95% suppression of sources using static modeling. However, the residual flux densities of the strongest five sources (Sun, Cygnus A, Cassiopeia A, Virgo A, Taurus A) were still strong enough to introduce noticeable imaging sidelobes. Improving source removal required fitting for offsets in source position and flux spectrum as a function of time. We attribute these variations to ionospheric refraction (Fig. 10) and defects in the primary beam model, respectively. All of these components were necessary to achieve source suppression at a level of 1e-3 to 2e-4, depending on a source’s position within the primary beam.
6. Observational Results
Results were obtained using 3-day observations with a single east-west linear polarization for both PWA-4 and PGB-8 deployments. For both sets of data, the five strongest sources visible from the northern hemisphere (Sun, Cygnus A, Cassiopeia A, Virgo A, and Taurus A) were removed following the procedure described in §5.6. Residuals associated with these sources reflect deviations of their spectra (as viewed through an imperfectly calibrated primary beam) from a strict power-law. The Sun was further suppressed via the application of a delay/fringe-rate filter (§5.5). Although these filters potentially corrupt wider areas of the map, the strength and variability of the Sun is such that their application greatly improves imaging of the daytime sky.
6.1. PWA-4/PGB-8 All-Sky Map
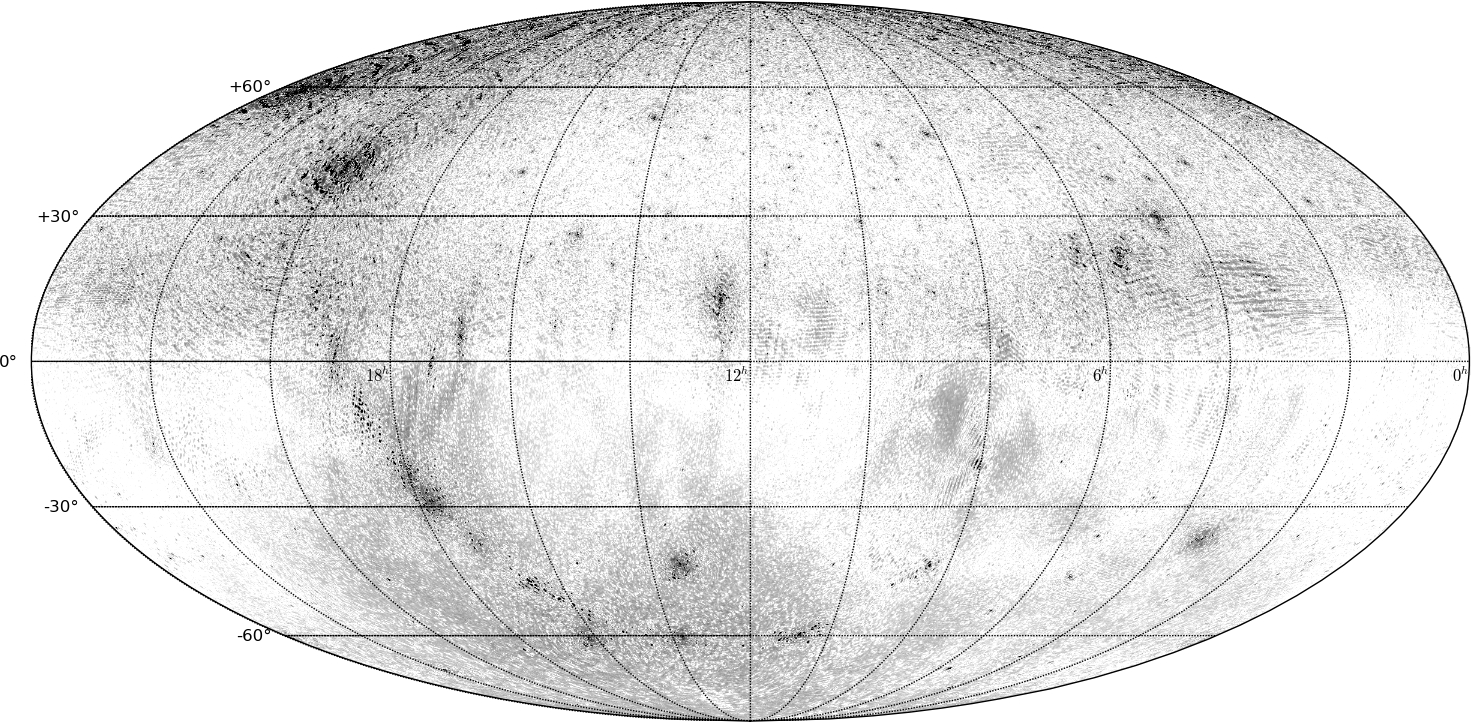
The all-sky map in Figure 13 illustrates average flux density per beam area over a band between 138.8 MHz and 174.0 MHz. The northern hemisphere was imaged using PGB-8 data with peak beam response at declination . The southern hemisphere was imaged with data from PWA-4, which employed both a more compact array configuration and a broader primary beam. Peak beam response in the southern hemisphere lies at declination . Imaging over the full 35.2-MHz bandwidth was performed by generating full maps in 1.46-MHz intervals and then summing maps. Each map was generated using 200 facets, with phase centers equally spaced around the sphere. While each imaged facet employed W-projection (Cornwell et al., 2003) to correct for the curvature of the sky, facet imaging was nonetheless required to incorporate differences in data weighting between phase centers. This weighting optimizes SNR by accounting for the array’s direction-dependent gain toward that location as it drifts through the primary beam.
Thermal noise and point-source sidelobes both contribute to the noise level seen in this all-sky map. As mentioned in §6, only the strongest five sources have been removed from this map prior to imaging. Image-domain CLEAN deconvolution was used to achieve modest suppression of sidelobes from other sources. The complexities of wide-field imaging with drift-scan data make further post-imaging deconvolution impractical, since CLEAN components of gridded visibilities may not be directly applied to ungridded visibility data. Our plan is to use imaging as a pathway for identifying sources that may then be fit and removed from raw visibilities. With this in mind, we have devoted little additional effort toward suppressing sidelobes of imaged sources. From the map in Figure 13, we measure an RMS flux density of noise between point sources of 80 mJy (4.9 K using a synthesized beam area of 2.15e-5 steradians at 156.4 MHz). As we discuss in §6.2 and in §6.3, this noise level exceeds thermal noise by a factor of eight, and is dominated by point-source sidelobes, with only a small contribution from galactic synchrotron emission at lower frequencies.
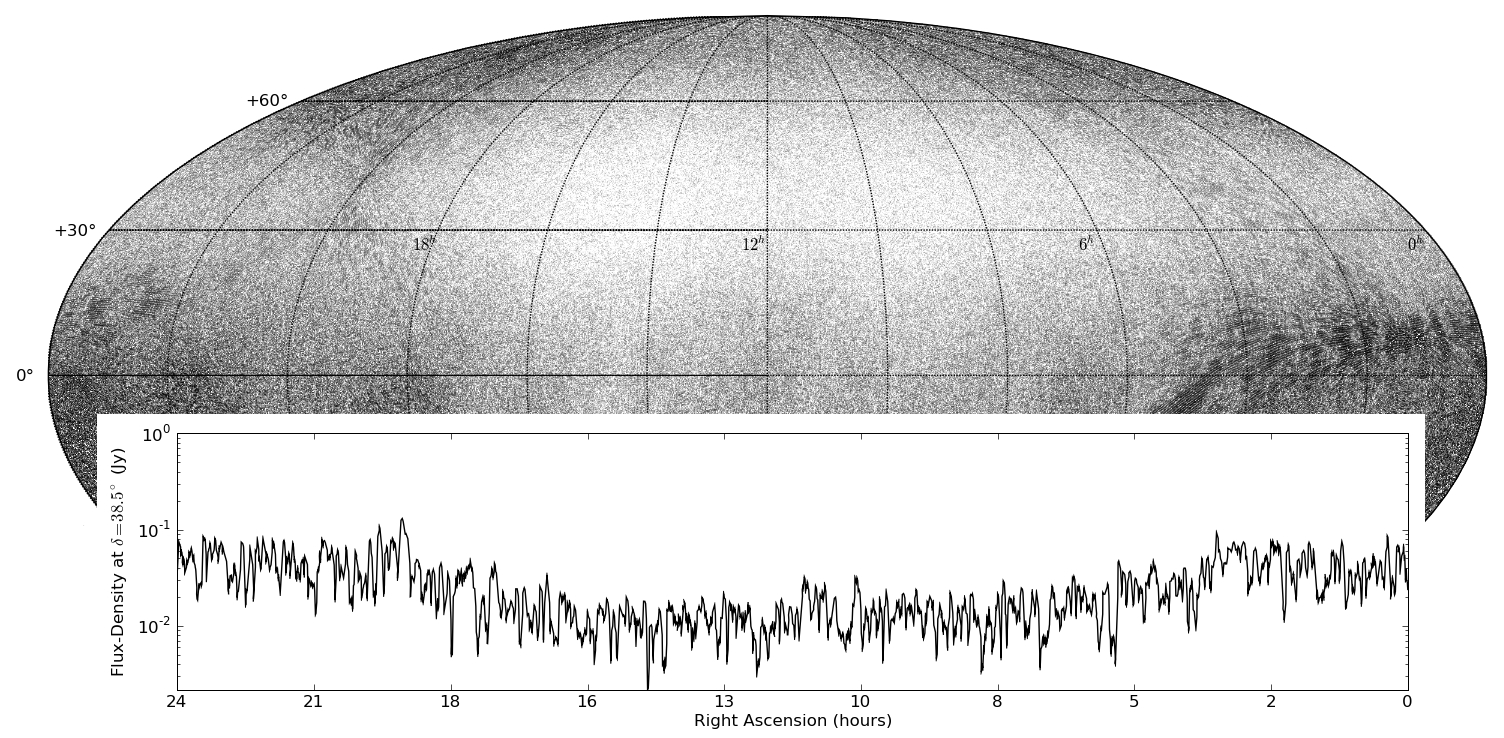
The position-dependent response of primary beams in each array is evidenced by changing noise levels in the map as a function of declination. Noise levels in the map also change with right-ascension because system temperature depends on the average temperature of galactic synchrotron emission across the primary beam. To illustrate the levels of thermal noise in the all-sky map, we repeated the map-making process detailed above, but with alternating integrations added with opposite signs, so that celestial sources with slow time variation were heavily suppressed relative to thermal noise. The map generated by this technique, illustrated in Fig. 14, shows that for the PGB-8 portion of the map, noise levels range from 10 mJy to 50 mJy (620 mK to 3.1 K using a synthesized beam area of 2.15e-5 steradians at 156.4 MHz) in the declination range of peak sensitivity of the array.
6.2. Thermal Noise Contributions to PGB-8 Map
The map statistics in the direction of a colder patch of the galactic synchrotron were evaluated using 1.46-MHz facet images with phase centers at , , , and . Each frequency interval and phase center was imaged twice with independent sets of alternating (odd and even time index) 14-second integrations from the 3-day PGB-8 observation described in 6.1. For each facet, these two images were summed and differenced to produce images of the celestial sky and of thermal noise, respectively. For the following analysis, image statistics were evaluated independently over diameter circular patches around each phase center and averaged over facets afterward.
Thermal noise levels were inferred from measured RMS pixel values according to the equation:
| (5) |
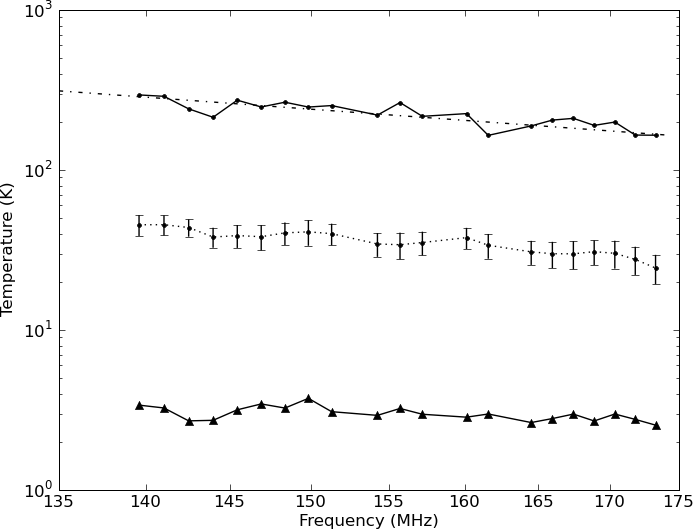
where is the solid angle of a synthesized beam; is the solid angle of the primary beam; is the bandwidth of data used in the image; is the integration time; is the number of antennas in the array; and denotes the RMS value. The thermal noise images produced by differencing integrations yield the estimates plotted in Fig. 11 for each 1.46-MHz band.
From each measured we also inferred the system temperature present before integration in the correlator. A comparison of this temperature with the predicted for a colder patch of the galactic synchrotron (see §3.2) shows that the PGB-8 system temperature is dominated by sky-noise. Finally, the standard deviation of pixel values in the summed facet images exceeds thermal noise, implying contributions from celestial point sources, their sidelobes, and galactic synchrotron emission. The temperature associated with this pixel distribution reflects a sky temperature as perceived by the partially filled aperture of PGB-8. This perceived temperature is approximately a factor of 6 lower than the temperature of the galactic synchrotron because sparse samplings of short -spacings cause much of the emission from this source to be resolved out.
6.3. Angular Power Spectra
The angular power spectra illustrated in Figure 12 are measured using the PGB-8 data described in §6. Our analysis follows the techniques developed in White et al. (1999) for calculating angular power spectra with interferometric data in the flat-field approximation. To make this approximation, gridded visibility data projected towards each of the four phase centers defined in §6.2 were limited to a diameter FoV by applying a circular boxcar windowing function , whose effect in the -plane is to convolve by the complementary Fourier kernel . Within each facet, angular power spectra were calculated using the equation:
| (6) |
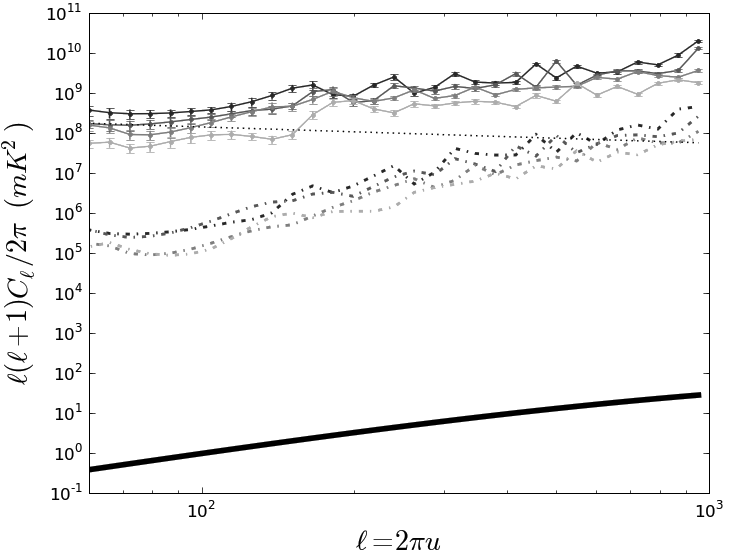
where represents the solid angle spanned by ; and represents the measured visibility as a function of position in the -plane; denotes integration around a ring of . The relationship between -coordinates and angular wavenumber is defined by . In practice, is accompanied by sample weights , so that Equation 6 becomes:
| (7) |
where represents the solid angle spanned by the primary beam.
For each facet, separate spectra were formed in 1.46-MHz intervals by integrating around rings in the -plane that were logarithmically spaced in radius and width. Within each ring, data were weighted by the square of the primary beam response toward phase center for optimal SNR. We estimated the contribution of thermal noise to the error in each measurement by generating power spectra for thermal noise images. This was done using the technique of adding integrations with alternating signs described in the previous section. The error from cosmic variance was much larger than the error from thermal noise, owing to the limited aperture sampling of the PGB-8 array and the limited area on the sky employed for this analysis. Error contributions from cosmic variance were estimated by measuring the standard deviation of all measurements in rings of constant in the -plane for each facet, and dividing this by the square root of the number of independent measurements made. We estimated independent measurements by calculating the size of a coherence patch in the -plane that arises from and then degrading the pixel resolution in the -plane to a corresponding size. At the lower resolution, each pixel sample was considered an independent measurement, with the caveat that for a real-valued sky, only half of the samples in a ring are independent.
PGB-8 angular power spectra are dominated by unclustered point sources, as indicated by the approximate power-law in of the angular power spectra plotted in Figure 12. However, at lower radio frequencies for , we see a flattening of these spectra to a shallow, negative power-law that shows qualitative agreement with the model adopted by Tegmark et al. (2000) and Santos et al. (2005). Progress in modeling point sources and in subtracting spectrally smooth emission associated with synchrotron sources will facilitate the suppression of these foregrounds, with a fundamental limit placed by the thermal limit of these observations (Fig. 12, dot-dashed), which we measure to be 310 mK for at 160 MHz. Overall, our measurements indicate that over the range , the fundamental sensitivity level of these observations is between two and three orders of magnitude in temperature above the fiducial model of reionization at (140 MHz) used by Santos et al. (2005).
7. Conclusion
PAPER is following an incremental build-out strategy that emphasizes the characterization and optimization of instrumental performance at each stage of development. We have given special attention to designing antenna elements whose smooth spatial and spectral responses are conducive to calibration that will be required to model and remove strong foregrounds to the 21cm EoR signal. Facilitating the incremental build-out of PAPER is a series of digital correlators that take advantage of the scalability and reusability of CASPER’s packet-switching correlator architecture. We are developing post-correlation calibration, imaging, and analysis pipelines as part of the open-source AIPY software package. This package emphasizes the needs of low-frequency interferometry and facilitates experimentation with new analysis architectures and calibration techniques.
With results from the PWA-4 and PGB-8 deployments in Western Australia and Green Bank, respectively, we demonstrate a first level of calibration that is sufficient for modeling strong sources to a level where ionospheric refraction and temperature-dependent gains must be taken into account. This calibration relies heavily on a static model of the primary beam. Next steps in calibration will focus on the first-order removal of temperature-dependence in antenna gains and on measuring deviations of the primary beam of each antenna from the computed model.
Data from the PWA-4 and PGB-8 deployments have been used to generate an all-sky map that attains a thermal noise level of 10 mJy/Beam (corresponding to 620 mK, for a 2.15e-5 steradian synthesized beam size at 154.4 MHz) integrated across a 138.8-MHz to 174.0-MHz band. This achievement represents a first iteration in a cycle of improvement wherein sky models are used to improve array calibration, which in turn allows increasingly accurate sky models to be generated. In analyzing the noise characteristics of this map, we find the system temperature of the PGB-8 array to be consistent with a model of galactic synchrotron emission. Angular power spectra generated from these data indicate that point sources are currently the dominant foreground to the EoR signature, with evidence for contributions from galactic synchrotron emission at lower radio frequencies and angular wavemodes. Errors in measurements are dominated by cosmic variance, but by differencing integrations, we measure the thermal noise level at and 160 MHz to be 310 mK–a sensitivity threshold that lies between two and three orders of magnitude in temperature above fiducial reionization models. These results demonstrate the need for a next level of calibration, modeling, and foreground suppression that will be pursued in the next PAPER deployments.
This work was supported by NSF AST grants 0804508, 0505354, and 0607838, and by significant efforts by staff at NRAO’s Green Bank and Charlottesville sites. NEG acknowledges support from the Virginia Space Grant Consortium. JRM acknowledges financial support from the MeerKAT project and South Africa’s National Research Foundation. We thank R. Beresford & T. Sweetnam of CSIRO for their aid in the PWA-4 deployment and J. Richards and the Western Australia government for their support. CASPER research, including components of PAPER’s correlator development, is supported by the NSF grant AST-0619596. We would like to acknowledge the students, faculty and sponsors of the Berkeley Wireless Research Center, and the NSF Infrastructure grant 0403427.
References
- Baars et al. (1977) Baars, J. W. M., et al. 1977, A&A, 61, 99
- Barkana & Loeb (2005a) Barkana, R. & Loeb, A. 2005a, ApJ, 624, L65
- Barkana & Loeb (2005b) —. 2005b, ApJ, 626, 1
- Becker et al. (2001) Becker, R. H., et al. 2001, AJ, 122, 2850
- Bowman et al. (2007) Bowman, J. D., et al. 2007, AJ, 133, 1505
- Bowman et al. (2006) Bowman, J. D., et al. 2006, ApJ, 638, 20
- Bradley (2006) Bradley, R. 2006, A Low Cost Screened Enclosure for Effective Control of Undesired Radio Frequency Emissions, NRAO EDIR 317, http://www.gb.nrao.edu/electronics/edir
- Cornwell & Fomalont (1989) Cornwell, T. & Fomalont, E. B. 1989, in ASPCS, Vol. 6, Synthesis Imaging in Radio Astronomy, ed. R. A. Perley, F. R. Schwab, & A. H. Bridle, 185–+
- Cornwell & Evans (1985) Cornwell, T. J. & Evans, K. F. 1985, A&A, 143, 77
- Cornwell et al. (2003) Cornwell, T. J., et al. 2003, W-Projection: A New Algorithm for Non-Coplanar Baselines, EVLA Memo 67
- Crochiere & Rabiner (1983) Crochiere, R. & Rabiner, L. R. 1983, Multirate Digital Signal Processing (Englewood Cliffs, NJ, Prentice-Hall, 1983. 336 p.)
- Fan et al. (2006) Fan, X., Carilli, C. L., & Keating, B. 2006, ARA&A, 44, 415
- Furlanetto et al. (2006) Furlanetto, S. R., et al. 2006, Phys. Rep., 433, 181
- Górski et al. (2005) Górski, et al. 2005, ApJ, 622, 759
- Hall (1988) Hall, G., ed. 1988, The ARRL Antenna Book, 15th Edition (American Radio Relay League, Newington, CT, 1988.), 16
- Haslam et al. (1982) Haslam, C. G. T., et al. 1982, A&AS, 47, 1
- Högbom (1974) Högbom, J. A. 1974, A&AS, 15, 417
- Jackson & Farrell (2006) Jackson, T. L. & Farrell, W. M. 2006, IPPS, 44, 2942
- Johnson (1993) Johnson, R. C. 1993, Antenna Engineering Handbook, 3rd Ed. (New York, McGraw-Hill, 1993.), 18–23
- Komesaroff (1960) Komesaroff, M. M. 1960, AuJP, 13, 153
- Loeb & Barkana (2001) Loeb, A. & Barkana, R. 2001, ARA&A, 39, 19
- Loeb & Zaldarriaga (2004) Loeb, A. & Zaldarriaga, M. 2004, PRL, 92, 211301
- Morales (2005) Morales, M. F. 2005, ApJ, 619, 678
- Morales et al. (2006) Morales, M. F., et al. 2006, NewAR, 50, 173
- Page et al. (2007) Page, L., et al. 2007, ApJS, 170, 335
- Parsons et al. (2008) Parsons, A., et al. 2008, PASP, 120, 1207
- Parsons & Backer (2009) Parsons, A. R. & Backer, D. C. 2009, Sub. to AJ. ArXiv:0901.2575
- Rogers & Bowman (2008) Rogers, A. E. E. & Bowman, J. D. 2008, AJ, 136, 641
- Santos et al. (2005) Santos, M. G., et al. 2005, ApJ, 625, 575
- Sault (1990) Sault, R. J. 1990, ApJ, 354, L61
- Sault et al. (1995) Sault, R. J., et al. 1995, in ASPCS, Vol. 77, ADASS IV, ed. R. A. Shaw, H. E. Payne, & J. J. E. Hayes, 433–+
- Slurzberg & Osterheld (1961) Slurzberg, M. & Osterheld, W. 1961, Essentials of Radio-Electronics, 2nd Ed. (New York, McGraw-Hill, 1961.), 595
- Tegmark et al. (2000) Tegmark, M., et al. 2000, ApJ, 530, 133
- Thompson et al. (2001) Thompson, A. R., et al. 2001, Interferometry and Synthesis in Radio Astronomy, 2nd Edition (New York, Wiley-Interscience, 2001. 692 p.)
- Vaidyanathan (1990) Vaidyanathan, P. P. 1990, Proc. IEEE, 78, 56
- White et al. (1999) White, M., et al. 1999, ApJ, 514, 12
- Yatawatta et al. (2008) Yatawatta, S., et al. 2008, ArXiv:0810.5751
- Zahn et al. (2007) Zahn, O., et al. 2007, ApJ, 654, 12