The Electronic Phase Diagram of the Iron-based High Superconductor Ba(Fe1-xCox)2As2 Under Hydrostatic Pressure ()
Abstract
We report comprehensive resistivity measurements of single crystalline samples of the Ba(Fe1-xCox)2As2 high superconductor under hydrostatic pressure up to 2.75 GPa and over a broad concentration range, . We show that application of pressure progressively suppresses the SDW transition temperature, , in the underdoped regime (). There is no sign of pressure-induced superconductivity in the undoped BaFe2As2 down to 1.8 K, but applied pressure dramatically enhances in the underdoped regime . The effect of pressure on is very small in the optimally and overdoped regimes . As a consequence, the dome of the superconducting phase extends to under pressure. We discuss the implications of our findings in the context of a possible quantum phase transition between the SDW and superconducting phases.
pacs:
74.70.-b,74.62.FjI Introduction
The superconducting mechanism of the new iron-based high superconductors Kamihara et al. (2008) is highly controversial. Among the key questions which remain unsolved is whether the conventional phonon mechanism is responsible for the superconductivity. Given that the ground state of the undoped parent phases, such as RFe2As2 (R = Ba, Sr, Ca), is magnetically ordered in a commensurate SDW (Spin Density Wave) state Huang et al. (2008); Kitagawa et al. (2008); Jesche et al. (2008); Ronning et al. (2008); Ni et al. (2008a), it is conceivable that spin fluctuations may be playing a role as a glue of Cooper pairs. Unlike the high cuprate superconductors, however, the magnetically ordered ground state of the undoped parent phases is not a Mott insulating state, and the electrical resistivity remains finite in the SDW state Kamihara et al. (2008); Rotter et al. (2008a). As little as 2 to 4 percent of electron doping into the FeAs layers alters the nature of the SDW order, as evidenced by the dramatic changes of the 75As and 59Co NMR lineshapes in the ordered state of Ba(Fe1-xCox)2As2 Ning et al. . The exact nature of the SDW phase in the presence of doped electrons is not understood very well, but the large distributions of the static hyperfine magnetic field observed by NMR are not consistent with a homogeneous, commensurate SDW state Ning et al. . Upon further increasing the level of electron doping to the optimal doping level of 6 to 8 %, a high phase emerges with K Sefat et al. (2008a); Ning et al. (2009); Ni et al. (2008b); Chu et al. (2009); Wang et al. .
Besides doping, it also turns out that applied pressure can induce superconductivity with as high as K in the undoped parent phases of RFe2As2 Alireza et al. (2009); Fukazawa et al. (2008); Torikachvili et al. (2008a); Park et al. (2008); Igawa et al. (2009); Kotegawa et al. (2009). The existence of the pressure induced superconducting phase indicates that subtle changes and/or contractions of the structure can switch on superconductivity from a SDW phase. However, the mechanism of pressure induced superconductivity is very poorly understood, and more detailed studies are required to clarify the effects of applied pressure on the electronic properties of iron-based high superconducting systems. Most of the past experimental studies of these pressure effects, however, have focused on the optimally doped superconducting phase, or on pressure induced superconductivity in the undoped parent phase (see Chu and Lorenz for a review). Only limited experimental studies have been reported for the interplay between the amount of doping and pressure on the RFe2As2 systems Ahilan et al. (2008). In this paper, we will present comprehensive resistivity measurements under hydrostatic pressure for Ba(Fe1-xCox)2As2 single crystals over a wide range of Co concentrations from the undoped () to overdoped regimes up to . Unlike earlier reports of the observation of superconductivity under pressures applied by anvil cells Alireza et al. (2009); Fukazawa et al. (2008), we do not observe superconductivity in the undoped BaFe2As2 at least up to 2.75 GPa. On the other hand, we do find that applied pressure strongly enhances in the underdoped regime . The pressure effect on is very weak in the optimum and overdoped regimes, hence the dome of the superconducting region in the phase diagram extends toward under hydrostatic pressures.
The rest of this paper is organized as follows: in Section II, we describe experimental details. Our experimental results in ambient pressure and under hydrostatic pressure are described in Sections III and IV, respectively, followed by summaries and conclusions in Section V.
II Experimental Methods
We grew Co-doped BaFe2As2 single crystals based on FeAs self-flux methods Sefat et al. (2008a). The samples were cleaved and cut into small pieces with typical dimensions of 2 mm 1 mm 0.15 mm for electrical transport measurements. We applied high pressures of up to 2.75 GPa using a compact hybrid pressure cell with a BeCu outer jacket and a NiCrAl inner core. Daphene oil 7373 and 99.99 purity Sn were used as a pressure transmitting medium and a pressure calibrating gauge, respectively. Sample contacts were made using silver epoxy for conventional four-lead ac-resistivity measurements. We employed a highly flexible, home-made ac-resistivity measurement rig to achieve high accuracy in the resistivity measurements. The high pressure cell was placed in a vacuum canister with helium exchange gas. All of the measurements reported in this paper were carried out while warming up the sample from the base temperature of 1.8 K. In order to ensure that thermal equilibrium was reached properly, we stabilized the temperature of the system before conducting the resistivity measurement at each temperature, instead of continuously ramping the temperature. We confirmed that measurements carried out in the warming cycle agree well with those in the cooling cycle for all of the measurements. We exercised these precautions because the heat capacity of the high pressure cell is rather large, and the Cernox temperature sensor is attached to the exterior of the high pressure cell. We estimate the upper bound for the potential inaccuracy in sample temperature at 0.5 K.
In this paper, we present the details of the resistivity measurements primarily for , 0.02, 0.051, and 0.097. We refer readers to Ref. Ahilan et al. (2008) for the additional details of measurements in and 0.082.
III Results in Ambient Pressure
We begin our discussions with a summary of the resistivity data in ambient pressure, , shown in Fig.1a. In the undoped sample with , decreases suddenly below K, in agreement with earlier reports Rotter et al. (2008b); Huang et al. (2008). The cause of this dramatic change has been identified as a first order SDW phase transition accompanied by a structural phase transition from a high temperature tetragonal to low temperature orthorhombic structure Huang et al. (2008). We note that would increase below if SDW energy gaps open for all branches of bands crossing the Fermi energy Jerome and Schultz (1982). Instead, actually decreases below in the undoped sample.
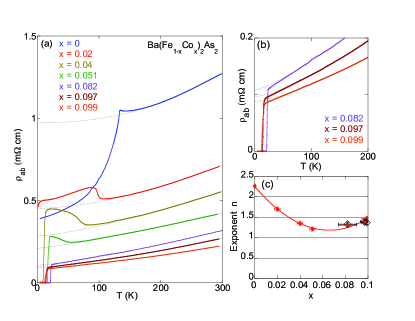
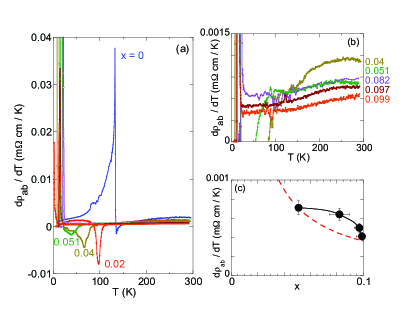
Once we dope a few percent of Co into the Fe sites, however, the abrupt drop of is no longer observable, and exhibits a step-like increase Sefat et al. (2008b); Ahilan et al. (2008). We proposed earlier that the temperature derivative of the resistivity data permits us to characterize the step-like anomaly Ahilan et al. (2008). We show the summary of the temperature dependence of in Fig.2. The minimum of is clearly observable at K for . The justification for identifying the minimum of as is that our 75As and 59Co NMR measurements for the same batch of crystals reveal typical signatures of a second order magnetic phase transition at the same temperature, including divergent behavior of the nuclear spin-lattice relaxation rate and the onset of broadening of the NMR lineshapes Ning et al. (2009, ). The enhancement of originates from the critical slowing down of the low frequency components of spin fluctuations toward a magnetic phase transition, while the NMR line broadening is due to the growth of spontaneous magnetization below a magnetic phase transition.
For higher doping levels with and 0.051, the resistivity upturn is less pronounced. By applying the same criterion based on the minimum of , we determined the SDW transition temperature as K for and K for , respectively.
We also observe a clear signature of a resistive superconducting transition for samples with or above. For example, the sample exhibits the onset of superconductivity at K. In what follows, we define the superconducting transition temperature as the temperature where decreases by 10 % from the extrapolated linear behavior of from higher temperature. Interestingly, even the crystal shows a slight decrease of below 4 K. The observed decrease is very subtle in ambient pressure. However, application of hydrostatic pressures dramatically enhances the onset temperature of the drop in to as high as 10.5 K, and reaches almost zero at 1.8 K in 2.4 GPa, as discussed in Section IV. We also confirmed that application of a 9 T magnetic field suppresses the onset of the resistivity drop, while NMR measurements Ning et al. reveal no additional magnetic anomaly around K or below. We therefore conclude that even the lightly electron-doped crystal has a resistive superconducting transition.
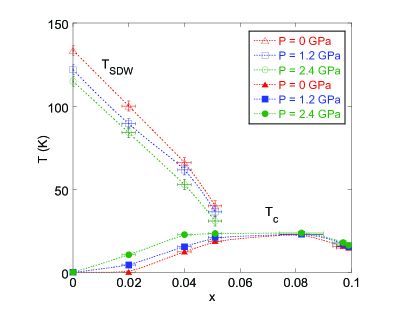
We summarize the concentration dependence of and in the electronic phase diagram shown in Fig. 3. The Fe1-xCoxAs layers in the underdoped regime, , undergo successive SDW and superconducting phase transitions. The reaches a maximum value of K in the optimally doped region for . Although there is no SDW transition in the optimally doped regime, the NMR spin-lattice relaxation rate is enhanced above , providing evidence for the presence of residual antiferromagnetic spin fluctuations Ning et al. (2008, 2009). Once we enter the overdoped regime, begins to decrease, and the NMR data no longer show evidence for enhanced antiferromagnetic spin fluctuations near Ning et al. (2009). We will discuss the implications of the phase diagram in Section IV combined with the results of our measurements under hydrostatic pressure.
Among many puzzling aspects of the electronic properties of electron-doped Ba(Fe1-xCox)2As2 is the temperature and concentration dependencies of . One can fit the overall temperature dependence of above and to a power-law behavior, , with a constant background Ahilan et al. (2008). The exponent , as determined from the fit in the temperature range above 170 K so that we could apply the same fitting criterion for all samples, shows only a mild concentration dependence, , above , as summarized in Fig. 1c. We note that the value of does not depend very strongly on the fitting range. For example, even if we extend the fitting range down to in the superconducting samples with , the deduced values (shown by open diamonds in Fig.1c) are about the same. The observed exponent is very close to 4/3 or 3/2, typical values observed in some heavy Fermion systems Sarrao et al. (2002) or overdoped high cuprates Takagi et al. (1992). It is not clear, however, if the assumption of the presence of a large temperature independent background resistivity is justifiable, especially in the underdoped regime. We also note that the extrapolation of the fit below 170 K poorly reproduces the data below K in all of the superconducting samples, because asymptotically approaches T-linear behaviors, as evidenced by constant slopes below K in Fig.2b. This T-linear behavior is not consistent with canonical Fermi liquid behavior, . We recall that 75As NMR results in the T-linear regime do not satisfy the Korringa law, , expected for a Fermi liquid either Ning et al. (2008, 2009) ( is the spin contribution to the NMR Knight shift, which is proportional to the uniform spin susceptibility).
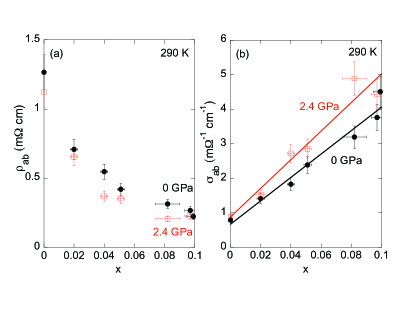
In order to quantify the systematic variation of , we summarize the dependence of at 290 K in Fig. 4a. decreases monotonically with . To better understand the systematic trend, we also plot the in-plane conductivity () in Fig. 4b. The latter suggests that at 290 K increases in proportion to , where is a constant. We found that the concentration dependence of at a fixed temperature above 150 K shows analogous linear dependence on as long as all samples remain paramagnetic. It is well known that similar linear dependence of was also observed in the high cuprates for a broad concentration range Takagi et al. (1992); Ando et al. (1995, 2004).
In the case of the high cuprate La2-xSrxCuO4, exhibits T-linear behavior over a broad temperature range up to as high as K and for a broad hole concentration range from to Ando et al. (2004). This T-linear behavior may be caused by, among other possibilities, the quantum criticality Chubukov and Sachdev (1993). The persistence of the T-linear behavior to such high temperatures implies that the fundamental energy scale which dictates the electronic properties of high cuprates is large (e.g. the Cu-Cu superexchange interaction is as large as K in undoped La2CuO4). In contrast, in the present case, the slope is constant (hence ) only below K and only for , as shown in Fig.2b. The fact that the T-linear behavior breaks down above K suggests that the fundamental energy scale of the electronic properties of FeAs layers is relatively low.
Another important distinction is the concentration dependence of the slope. In cuprates, the slope is roughly inversely proportional to the doped hole concentration, i.e. in the T-linear regime Ando et al. (2004). This implies that each hole in the CuO2 planes of the high cuprates contributes to the in-plane conductivity () by the same amount, regardless of the level of doping. In the present case, however, the low temperature slope in the T-linear region does not vary as , as shown in the Fig.2c. Instead, is roughly constant in the optimally doped regime, and begins to decrease very rapidly once we enter the overdoped regime above . In fact, upon further increasing , BaCo2As2 with has a Fermi-liquid-like ground state, and satisfies below K Sefat et al. (2009, ). The latter implies that asymptotes to zero with decreasing temperature for . Recent studies suggest that this crossover into the Fermi-liquid-like ground state with takes place around Ni et al. (2008b); Chu et al. (2009); Wang et al. .
IV Pressure Effects
In Fig.5, we summarize representative results of resistivity measurements under hydrostatic pressures for undoped , lightly doped , underdoped , and overdoped samples. We refer readers to our earlier report for the details of the measurements on underdoped and optimally doped samples Ahilan et al. (2008). In all cases, does not show major qualitative changes under hydrostatic pressure. The magnitude of decreases by % from 0 GPa to GPa, but the empirical relation for the concentration dependence, , still holds with a % larger value of , as shown in Fig.4b. The exponent from the fit to is also comparable between and 2.4 GPa Ahilan et al. (2008).
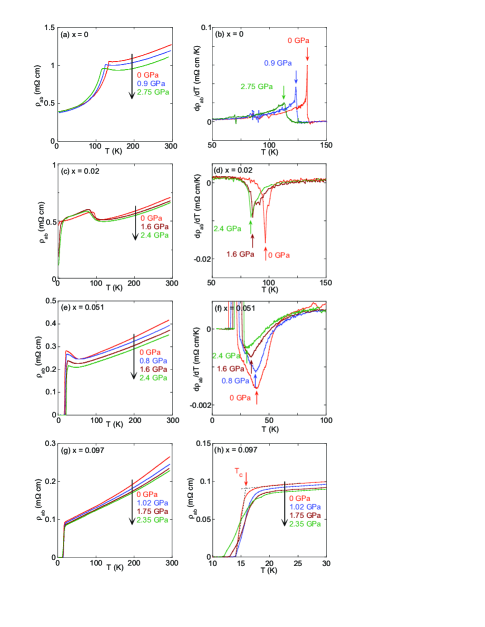
How does hydrostatic pressure affect the phase transition temperatures and ? In the case of undoped BaFe2As2, our data in Fig.5a and its derivative in Fig.5b clearly show progressive suppression of from 135 K in 0 GPa to 114 K in 2.75 GPa. The extremely sharp peak of at K becomes broader under pressure, and the sharp peak is no longer observable in 2.75 GPa. This may be an indication that the first order nature of the phase transition at in 0 GPa becomes gradually weaker under pressure, and quite possibly the SDW transition may become second order. However, we cannot entirely rule out an alternate scenario in which the applied pressure has a mild distribution due to the freezing of the pressure medium etc., and therefore itself has a small distribution under pressures, especially at GPa. A distribution of over K would easily mask the sudden nature of the first order transition, and make the transition appear to be of the second order.
Another important aspect of our data for the undoped BaFe2As2 is that we find no hint of a resistive superconducting transition up to at least 2.75 GPa. In contrast with our results, earlier SQUID measurements detected diamagnetic Meissner signals of a superconducting transition with as high as 29 K in BaFe2As2 above a critical pressure GPa applied by diamond anvil cell Alireza et al. (2009). A subsequent report on resistivity measurements in non-hydrostatic pressure applied by a Bridgman cell also detected strong suppression of resistivity above a comparable , although zero resistivity was never observed Fukazawa et al. (2008). In the present case, we cannot rule out the possibility that our maximum hydrostatic pressure of 2.75 GPa () is somewhat too low to induce superconductivity. Our compact hydrostatic high pressure cell risks damage, or even a catastrophic failure, at GPa or higher. Accordingly, we have not explored the pressure range above 2.8 GPa. However, it is worth pointing out that our data in 2.75 GPa shows a robust signature of an SDW transition at K; it seems highly unlikely that bulk superconductivity suddenly sets in under hydrostatic pressure at GPa unless a structural phase transition takes place between 2.75 and 2.8 GPa.
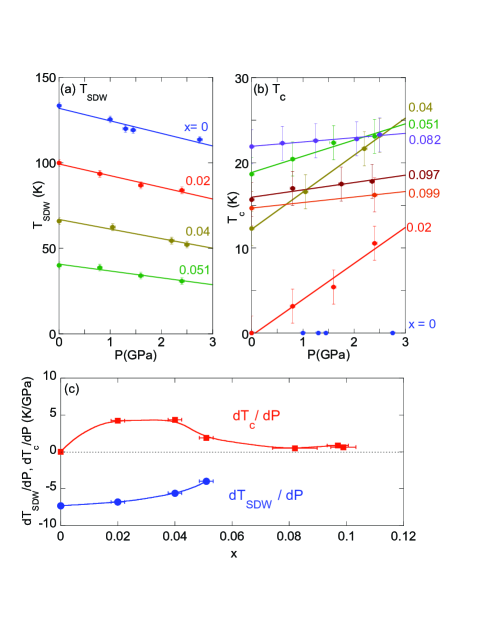
Next, we turn our attention to the interplay between Co doping and applied pressure. We summarize and as a function of hydrostatic pressure in Fig. 6a, and b, respectively. Fig.6c summarizes the pressure coefficient, and , for various Co doping levels based on the linear fits of the data points in Fig.6a and b. The results in Fig.6a and c clearly establish that the pressure induced suppression of becomes progressively weaker as we increase the Co concentration from to 0.051. On the other hand, Fig.6b and c show that hydrostatic pressure always enhances , but the sensitivity of on pressure depends strongly on the Co concentration . reaches as large as +4.3 K/GPa for , but decreases to K/GPa in the optimum and overdoped regimes. It is not clear why the pressure effect on becomes so weak for or above. Our observation of in both and 0.082 also defies the conventional wisdom based on the Ehrenfest relation of as estimated by thermal expansion data Bud’ko et al. . Another remarkable point from Fig. 6c is that the magnitude of both and decrease strongly near . In other words, the effects of pressure on and become weak near . These trends suggest the existence of a crossover in the electronic properties near . This finding may be related to a recent report on the crystal structure which showed that Ba(Fe1-xCox)2As2 does not undergo a high temperature tetragonal to low temperature orthorhombic structural phase transition in the concentration range Lester et al. .
In passing, it is worth noting that the pressure effects on do not seem to obey a simple universal behavior in other systems either, and what dictates the pressure induced change of is not clear. For example, in the case of the (Ba1-xKx)Fe2As2 system with x = 0.45, decreases smoothly with pressure up to 2 GPa at a rate K/GPa Torikachvili et al. (2008b). On the other hand, for the La(O1-xFx)FeAs system K sharply increases to 43 K with pressure up to 3 GPa at an average rate K/GPa, but application of higher pressure suppresses Takahashi et al. (2008).
V Summary and Conclusions
By linearly interpolating data points in Fig. 6a and b at and 2.4 GPa, we construct the electronic phase diagram of Ba(Fe1-xCox)2As2 under pressure at and 2.4 GPa in Fig. 3. Application of a hydrostatic pressure of 2.4 GPa suppresses by K for all samples with a SDW transition. On the other hand, applied pressures enhance dramatically only in the underdoped region, while affecting little in the optimum and overdoped regimes. Accordingly, the optimally doped regime with K extends to as low as . Also notice that the optimally doped region emerges when the magnetic phase boundary intersects the dome of the superconducting phase near in GPa. In the case of ambient pressure, the intersection is located at a somewhat higher value near Ning et al. (2009); Ni et al. (2008b); Chu et al. (2009); Wang et al. .
One can take several different views on the phase diagram in Fig.3. One possible scenario is that the SDW and superconducting phases compete each other. In this viewpoint, one can attribute the extension of the optimum region to in 2.4 GPa as a consequence of the suppression of the SDW instability by pressure. One can also take a completely opposite viewpoint; notice that if we traverse the phase diagram near from the superconducting phase toward , low frequency antiferromagnetic spin fluctuations as a function of would diverge at in GPa and in GPa when we hit the boundary with the SDW phase, i.e. a quantum phase transition at from the superconducting to SDW ground state. In fact, our earlier NMR measurements showed enhancement of antiferromagnetic spin fluctuations for lower doping level Ning et al. (2009), and confirmed such trends.
In this second scenario, our phase diagram in Fig. 3 might imply that enhanced quantum spin fluctuations near are the key to the superconducting mechanism. We recall that an analogous scenario involving quantum criticality has been debated extensively in the context of high cuprates since the early 1990’s Imai et al. (1994); Chubukov and Sachdev (1993); Sokol and Pines (1993), and more recently in the context of pressure induced superconductivity in heavy Fermions Saxena et al. (2000); Mathur et al. (1998). The recent finding that application of hydrostatic pressure enhances both Mizuguchi et al. (2008); Medvedev et al. ; Margadonna et al. and antiferromagnetic spin fluctuations in FeSe Imai et al. renders additional support to this second scenario, because spin fluctuations would be suppressed by pressure if superconductivity genuinely competes with the SDW instability.
On the other hand, one may need to be somewhat cautious in the debate over the cooperation or competition between superconductivity and SDW in the present case of Ba(Fe1-xCox)2As2, because the structural phase boundary between the tetragonal and orthorhombic phases terminates near Lester et al. . We cannot rule out the possibility that subtle changes in the crystal structure turn off the SDW order rather suddenly and switch on superconductivity. In this third scenario, decreases from in 0 GPa to in 2.4 GPa as a consequence of the shift of the tetragonal-orthorhombic structural boundary to under pressure. Further structural studies under pressure are required to test the scenario.
VI Acknowledgment
The work at McMaster was supported by NSERC, CFI, and CIFAR. Research at ORNL was sponsored by Division of Materials Sciences and Engineering, Office of Basic Energy Sciences, U.S. Department of Energy.
References
- Kamihara et al. (2008) Y. Kamihara, T. Watanabe, M. Hirano, and H. Hosono, J. Amer. Chem. Soc. 130, 3296 (2008).
- Huang et al. (2008) Q. Huang, Y. Qiu, W. Bao, M. A. Green, J. W. Lynn, Y. C. Gasparovic, T. Wu, and X. H. Chen, Phys. Rev. Lett. 101, 257003 (2008).
- Kitagawa et al. (2008) K. Kitagawa, N. Katayama, K. Ohgushi, M. Yoshida, and M. Takigawa, J. Phy. Soc. Jpn. 77, 114709 (2008).
- Jesche et al. (2008) A. Jesche, N. Catoca-Canales, H. Rosner, H. Borrman, A. Ormeci, D. Kasinathan, H. H. Klauss, H. Luetkens, R. Khasanov, A. Amato, et al., Phys. Rev. B 78, 180504(R) (2008).
- Ronning et al. (2008) F. Ronning, T. Klimczuk, E. D. Bauer, H. Volz, and J. D. Thompson, J. Phys.: Condens. Matter 20, 322201 (2008).
- Ni et al. (2008a) N. Ni, S. Nandi, A. Kreyssig, A. I. Goldman, E. D. Mun, S. L. Bud’ko, and P. C. Canfield, Phys. Rev. B 78, 014523 (2008a).
- Rotter et al. (2008a) M. Rotter, M. Tegel, and D. Johrendt, Phy. Rev. Lett. 101, 107006 (2008a).
- (8) F. L. Ning, K. Ahilan, T. Imai, A. S. Sefat, R. Jin, M. A. McGuire, B. C. Sales, and D. Mandrus, eprint Phys. Rev. B Rapid (in press), cond-mat/0902.1788.
- Sefat et al. (2008a) A. S. Sefat, R. Jin, M. A. McGuire, B. C. Sales, D. J. Sing, and D. Mandrus, Phys. Rev. Lett. 101, 117004 (2008a).
- Ning et al. (2009) F. L. Ning, K. Ahilan, T. Imai, A. S. Sefat, R. Jin, M. A. McGuire, B. C. Sales, and D. Mandrus, J. Phy. Soc. Jpn. 78, 013711 (2009).
- Ni et al. (2008b) N. Ni, M. E. Tillman, J. Q. Yan, A. Kracher, S. T. Hannahs, S. L. Bud’ko, and P. C. Canfield, Phys. Rev. B 78, 214515 (2008b).
- Chu et al. (2009) J.-H. Chu, J. G. Analytis, C. Kucharczyk, and I. R. Fisher, Phys. Rev. B 79, 014506 (2009).
- (13) X. F. Wang, T. Wu, R. H. Liu, H. Chen, Y. L. Xie, and X. H. Chen, eprint cond-mat/0811.2920.
- Alireza et al. (2009) H. Alireza, B. C. Ko, H. L. Gillett, J. Petrone, R. J. Cole, G. G. Lonzarich, and W. F. Sebastian, J. Phys. Conden. Matter 21, 012208 (2009).
- Torikachvili et al. (2008a) M. S. Torikachvili, S. L. Bud’ko, N. Ni, and P. C. Canfield, Phys. Rev. Lett. 101, 057006 (2008a).
- Park et al. (2008) T. Park, E. Park, H. Lee, T. Klimczuk, E. D. Bauer, F. Ronning, and J. D. Thompson, J. Phys. Conden. Matter 20, 322204 (2008).
- Igawa et al. (2009) K. Igawa, H. Okada, H. Takahashi, S. Matsuishi, Y. Kamihara, M. Hirano, H. Hosono, K. Matsubayashi, and Y. Uwatoko, J. Phy. Soc. Jpn. 78, 025001 (2009).
- Kotegawa et al. (2009) H. Kotegawa, H. Sugawara, and H. Tou, J. Phy. Soc. Jpn. 78, 013709 (2009).
- Fukazawa et al. (2008) H. Fukazawa, N. Takeshita, T. Yamazaki, K. Kondo, K. Hirayama, Y. Kohori, K. Miyazawa, H. Kito, H. Eisaki, and A. Iyo, J. Phys. Soc. Jpn. 77, 105004 (2008).
- (20) C. W. Chu and B. Lorenz, eprint cond-mat/0902.0809.
- Ahilan et al. (2008) K. Ahilan, J. Balasubramaniam, F. L. Ning, T. Imai, A. S. Sefat, R. Jin, M. A. McGuire, B. C. Sales, and D. Mandrus, J. Phys. Conden. Matter 20, 472201 (2008).
- Rotter et al. (2008b) M. Rotter, M. Tegel, D. Johrendt, I. Schellenberg, W. Hermes, and R. Pottgen, Phys. Rev. B 78, 020503 (2008b).
- Jerome and Schultz (1982) D. Jerome and H. Schultz, Adv. Phys. 31, 299 (1982).
- Sefat et al. (2008b) A. S. Sefat, A. Huq, M. A. McGuire, R. Jin, B. C. Sales, D. Mandrus, M. D. Cranswick, P. W. Stephens, and K. H. Stone, Phys. Rev. B 78, 104505 (2008b).
- Ning et al. (2008) F. L. Ning, K. Ahilan, T. Imai, A. S. Sefat, R. Jin, M. A. McGuire, B. C. Sales, and D. Mandrus, J. Phy. Soc. Jpn. 77, 103705 (2008).
- Sarrao et al. (2002) J. L. Sarrao, L. A. nad Morales, J. D. Thompson, B. L. Scott, G. R. Stewart, F. Wastin, J. Rebizant, P. Boullet, E. Colineau, and G. H. Lander, Nature 420, 297 (2002).
- Takagi et al. (1992) H. Takagi, B. Batlogg, H. L. Kao, J. Kwo, R. J. Cava, J. J. Krajewski, and W. F. Peck, Phy. Rev. Lett. 69, 2975 (1992).
- Ando et al. (1995) Y. Ando, G. S. Boebinger, A. Passner, T. Kimura, and K. Kishio, Phy. Rev. Lett. 75, 4662 (1995).
- Ando et al. (2004) Y. Ando, S. Komiya, K. Segawa, S. Ono, and Y. Kurita, Phy. Rev. Lett. 93, 267001 (2004).
- Chubukov and Sachdev (1993) A. V. Chubukov and S. Sachdev, Phy. Rev. Lett. 71, 169 (1993).
- Sefat et al. (2009) A. S. Sefat, D. J. Sing, R. Jin, M. A. McGuire, B. C. Sales, and D. Mandrus, Phys. Rev. B 79, 024512 (2009).
- (32) A. S. Sefat, D. J. Sing, R. Jin, M. A. McGuire, B. C. Sales, F. Ronning, and D. Mandrus, eprint cond-mat/0903.0629.
- (33) S. L. Bud’ko, N. Ni, S. Nandi, G. M. Schmiedeshoff, and P. C. Canfield, eprint cond-mat/0901.1800.
- (34) C. Lester, J.-H. Chu, J. G. Analytis, S. Capelli, A. S. Erickson, C. L. Condron, M. F. Tony, I. R. Fisher, and S. M. Hayden, eprint cond-mat/0903.3560.
- Torikachvili et al. (2008b) M. S. Torikachvili, S. L. Bud’ko, N. Ni, and P. C. Canfield, Phys. Rev. B 78, 104527 (2008b).
- Takahashi et al. (2008) H. Takahashi, K. Igawa, K. Arii, Y. Kamihara, M. Hirano, and H. Hosono, Nature 453, 376 (2008).
- Imai et al. (1994) T. Imai, C. P. Slichter, K. Yoshimura, K. Katoh, and K. Kosuge, Physica B 197, 601 (1994).
- Sokol and Pines (1993) A. Sokol and D. Pines, Phy. Rev. Lett. 71, 2813 (1993).
- Saxena et al. (2000) S. S. Saxena, P. Agarwal, K. Ahilan, F. M. Grosche, R. K. W. Haselwimmer, M. J. Steiner, E. Puge, I. R. Walker, S. R. Julian, P. Monthoux, et al., Nature 406, 587 (2000).
- Mathur et al. (1998) N. D. Mathur, F. M. Grosche, S. R. Julian, I. R. Walker, I. R. Freye, R. K. W. Haselwimmer, and G. G. Lonzarich, Nature 394, 39 (1998).
- Mizuguchi et al. (2008) Y. Mizuguchi, F. Tomioka, S. Tsuda, T. Yamaguchi, and Y. Takano, Appl. Phys. Lett 93, 152505 (2008).
- (42) S. Medvedev, T. M. McQueen, I. Trojan, T. Palasyuk, M. I. Eremets, R. J. Cava, S. Naghavi, F. Casper, V. Ksenofontov, G. Wortmann, et al., eprint cond-mat/0903.2143.
- (43) S. Margadonna, Y. Takabayashi, Y. Ohishi, Y. Mizuguchi, Y. Takano, T. Kagayama, T. Nakagawa, M. Takata, and K. Prassides, eprint cond-mat/0903.2204.
- (44) T. Imai, K. Ahilan, F. L. Ning, T. M. McQueen, and R. J. Cava, eprint Phys. Rev. Lett. (in press), cond-mat/0902.3832.