Subsurface Circulations within Active Regions111Submitted to the Astrophysical Journal ,222Uploaded to arXiv.org on 4/8/09
Abstract
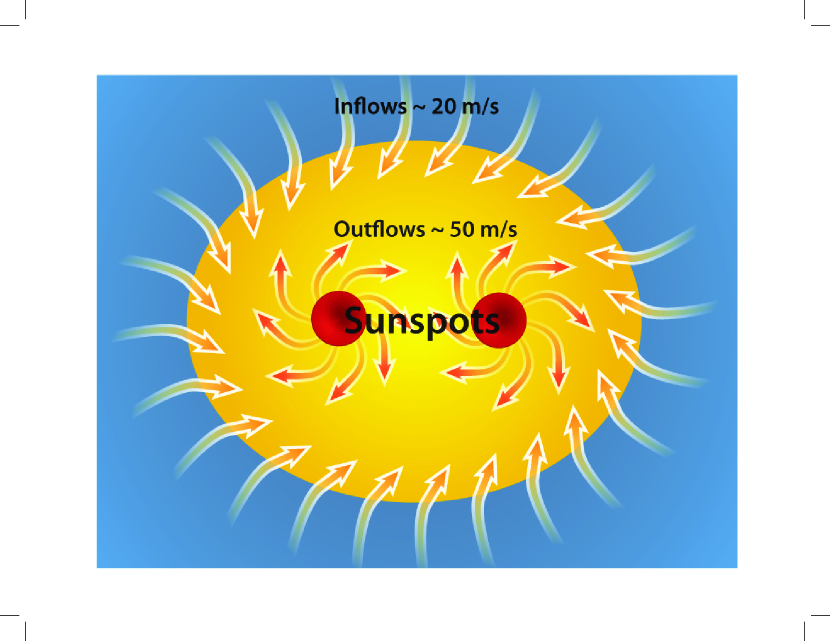
Using high-resolution ring analysis (HRRA) we deduce subsurface flows within magnetic active regions and within quiet sun. With this procedure we are capable of measuring flows with a horizontal spatial resolution of 2∘ in heliographic angle (or roughly 20 Mm). From the resulting flow fields we deduce mean inflow rates into active regions, mean circulation speeds around active regions, and probability density functions (PDFs) of properties of the flow field. These analyses indicate that active regions have a zonal velocity that exceeds that of quiet sun at the same latitude by 20 m s-1, yet active regions advect poleward at the same rate as quiet sun. We also find that almost all active regions possess a mean inflow (20–30 m s-1) and a cyclonic circulation ( 5 m s-1) at their peripheries, whereas their cores, where the sunspots are located, are zones of strong anticyclonic outflow ( 50 m s-1). From the PDFs, we find that active regions modify the structure of convection with a scale greater than that of supergranulation. Instead of possessing an asymmetry between inflows and outflows (with a larger percentage of the surface occupied by outflows), as is seen in quiet sun, active regions possess symmetric distributions.
1 Introduction
The first measurements of the Sun’s rotation rate were obtained by careful tracking of the location of sunspots. In fact, in 1611, shortly after the invention of the telescope, independent observations of the motion of sunspots across the solar disk by Galileo Galilei and Christopher Scheiner proved unequivocally that the Sun rotated. We now know that magnetic features are not purely passive tracers. Detailed tracking of sunspots and other magnetic features—such as pores and plages—has revealed that magnetized regions rotate more quickly than the surrounding field-free plasma (e.g., Howard & Harvey, 1970; Golub & Vaiana, 1978; Komm et al., 1993). Furthermore, the larger the flux concentration the more rapid the rotation rate (Ward, 1966; Howard et al., 1984; Howard, 1992). Recent helioseismic analyses have shown that the plasma within active regions as a whole also rotates more quickly (e.g., Braun et al., 2004). This superrotation extends to depths as great as 16 Mm (Komm et al., 2009) and there is evidence that the leading polarity might rotate more rapidly than the trailing polarity (Zhao et al., 2004; Švanda et al., 2008b). As in the earlier studies involving the tracking of sunspots and plage, the helioseismic studies find that the prograde rotation speed increases with increasing magnetic flux density.
The tracking of magnetic features has produced less clear results for meridional motions. We know from direct Doppler velocity measurements (e.g., LaBonte & Howard, 1982; Hathaway et al., 1996) and from helioseismic techniques (e.g., Giles et al., 1997; Braun & Fan, 1998; Basu et al., 1999; Haber et al., 2002; Zhao & Kosovichev, 2004) that within the surface layers, the meridional circulation is poleward with roughly a speed of 20 m s-1. Outside of active regions, correlation tracking has found that magnetic flux advects towards the pole at roughly the same speed, acting like a passive tracer (Švanda et al., 2007). However, sunspots do not appear to follow the same rules. While individual sunspots may move substantially in latitude over their lifetime, sunspots as a group lack systematic poleward motion. Instead, on average, sunspots appear to slowly drift ( m s-1) away from the center of the active latitude belts (Wöhl & Brajša, 2001; Wöhl, 2002).
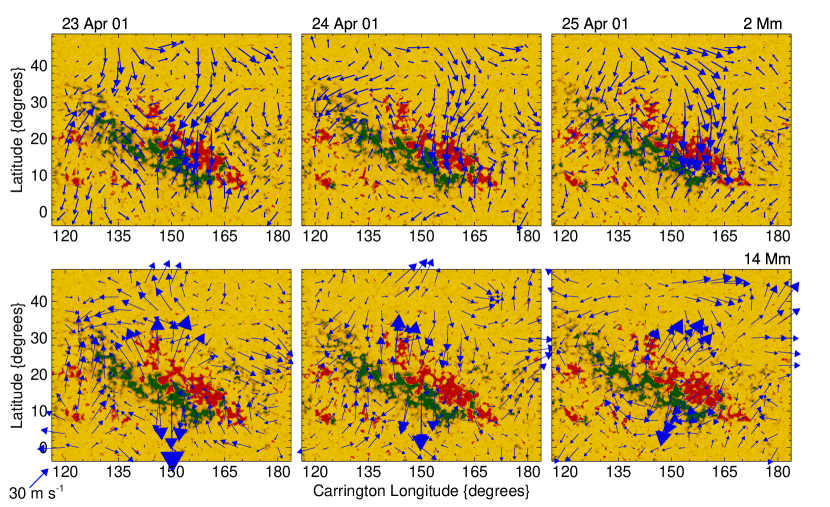
In addition to their bulk motion, active regions have internal circulations. As first revealed through the local helioseismic techniques of ring analysis and time-distance helioseismology, within the surface layers there are large-scale flows that stream into active regions. These flows typically occupy a layer 7 Mm deep below the photosphere and have amplitudes of 20–30 m s-1 (Haber et al., 2001; Gizon et al., 2001). These same techniques have also demonstrated that in deeper layers many, but not all, active regions possess strong outflows with speeds reaching 50 m s-1 (Haber et al., 2004; Zhao & Kosovichev, 2004). The largest magnetic complexes inevitably evince these deep outflows, but many of the smaller complexes fail to exhibit such behavior. Figure 1 shows examples of these organized flows around a large active complex.
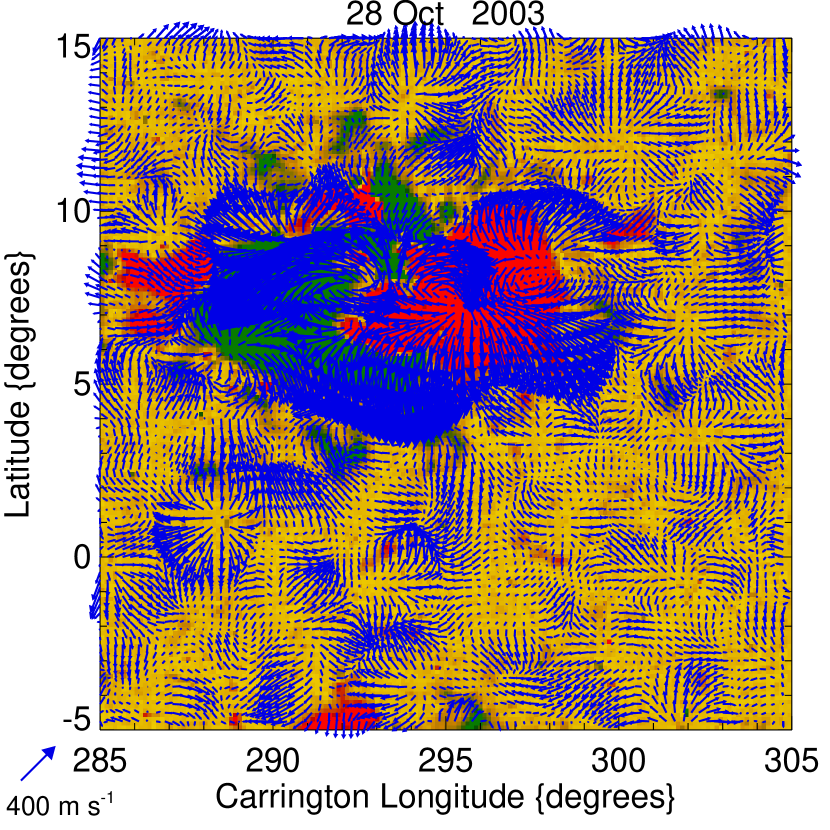
This simple circulation pattern (inflows at the surface, coupled to outflows at depth) becomes more complicated when we consider the flows that are observed around sunspots. The tracking of “moving magnetic features” (MMFs) has revealed an annular collar of outflow surrounding sunspots (for a review see Hagenaar & Shine, 2005). This “moat” of flow has also been observed helioseismically (Lindsey et al., 1996; Gizon et al., 2000; Braun & Lindsey, 2003). Related outflows have also been observed surrounding newly emerged active regions that have yet to fray and form a region of extended plage (Hindman et al., 2006b; Komm et al., 2008; Kosovichev & Duvall, 2008). Figure 2 shows the flows around an active region that emerged just two days prior. The flow field during this young stage in the active region’s life is dominated by strong outflows from the sunspots.
In this paper we perform detailed measurements of the flows in quiet sun and in active regions using the local helioseismic technique of ring analysis to detect flows within the upper 2 Mm of the solar convection zone. Our goal is to understand the circulations that are typically established within active regions and to assess how properties of the flow field—such as its divergence and vorticity—differ between magnetized and nonmagnetized regions. In §2 we discuss the ring analysis procedure in detail. In §3 we present two different schemes for analyzing the measured flow fields. In §4 we provide a comprehensive discussion of our findings, and in §5 expound our conclusions.
2 High-Resolution Ring Analysis (HRRA)
Ring analysis assesses the speed and direction of subsurface horizontal flows by measuring the advection of ambient waves by the flow field. In the presence of a flow, waves traveling in opposite directions have their frequencies split by the Doppler effect, providing a direct measure of the flow velocity in those layers where the waves have significant amplitude. For this particular study, we have utilized only surface gravity waves ( modes); therefore, we are able to probe a layer several Mm thick lying directly below the photosphere. The frequency perturbation introduced by the flow is , where is the horizontal wavenumber and is the integral over depth of the horizontal flow velocity weighted by a kernel which is approximately the kinetic energy density of the surface gravity wave.
The frequency splittings produced by flows are measured in the Fourier domain. For a single analysis, a power spectrum is obtained of the wave field in a localized region on the solar surface by Fourier transforms (two in space, one in time) of a sequence of tracked, remapped, and apodized Dopplergrams (Bogart et al., 1995; Haber et al., 1998). The mode power in the spectrum is distributed along curved surfaces, which when cut at constant frequency appear as a set of concentric rings, each corresponding to a mode of different radial order. These rings are nearly circular in shape with centers displaced slightly from the origin due to the splitting of the mode frequencies. The frequency splittings are obtained as a function of wavenumber by carefully fitting the modes in such power spectra with Lorentzian profiles (e.g., Haber et al., 2000, 2001).
A single ring analysis is performed within a small region, or tile, on the solar surface. The resulting flow is an average measure of the flow within that tile (Hindman et al., 2005). We map the flow field over the entire visible disk by performing many such ring analyses on a mosaic of different locations on the solar surface. Each day the analyses are repeated to obtain a sequence of daily flow maps.
For this study we have used Dynamics Program data from MDI (Scherrer et al., 1995) on the SOHO spacecraft. We use the same tiling and tracking scheme discussed at length in Hindman et al. (2006a). This scheme, known as high-resolution ring analysis (HRRA), produces a daily map of the flow field formed from the analysis of over tiles that are 2∘ in heliographic angle on a side. The tiles overlap and their centers are separated by in longitude and latitude. In order to reduce the amount of image tracking and remapping that is required, in practice, instead of tracking each of these tiles separately, we track 189 larger regions that span 16∘ in angle on a side (Haber et al., 2002). The smaller 2∘ tiles are then extracted from these larger tracked regions. Each of the larger tiles, is tracked for 27.7 hours at the surface rotation rate appropriate for the center of the tile (Snodgrass, 1984). The large tiles overlap each other and their centers are separated in longitude and latitude by 7.5∘.
Since the large tiles overlap, for any given location in the mosaic of 2∘ tiles, there exists multiple realizations of that tile each extracted from a different neighboring large tile. In general, any given location will have 4 separate tiles and the flow determinations from these different realizations are averaged together. Since, not all of the neighboring large tiles are tracked at the same rotation rate, before averaging we must convert each of the flow realizations to a common rotation rate. This is accomplished by subtracting from the zonal velocity a longitudinal and temporal mean obtained from the small tiles from a given year. Therefore, the reported zonal flows are measured relative to the differential rotation rate obtained from the data itself.
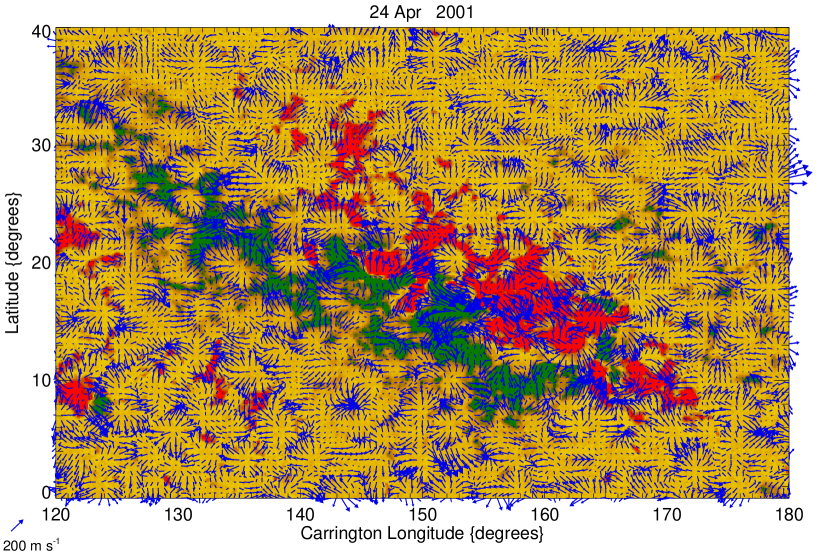
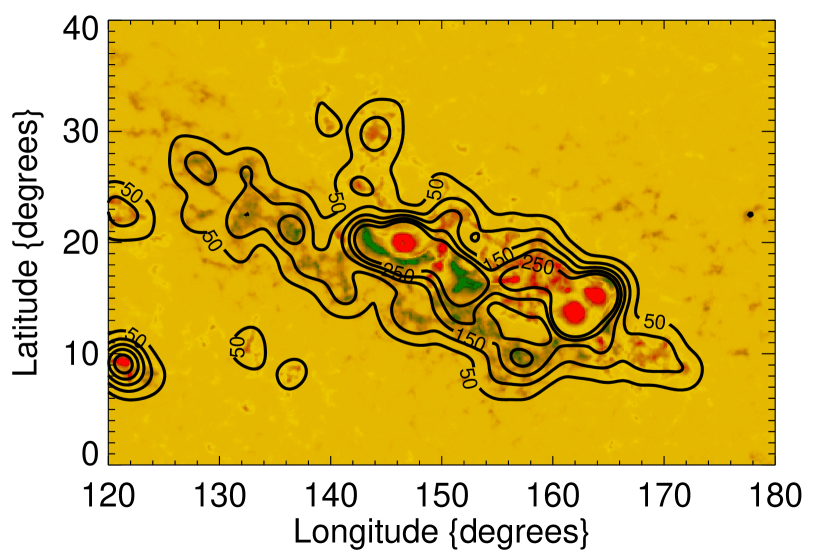
As in Hindman et al. (2006a), the results for waves of different horizontal wavenumber are averaged together to increase the ratio of signal to noise. A typical daily flow map, comprised of roughly 104 measurements, is generated from separate flow determinations. Assuming that the errors are uncorrelated, this averaging procedure produces a fractional uncertainty of roughly 20% for any single flow speed measurement in the daily map. Figures 2 and 3 show flow maps obtained by this technique. Figure 2 shows the flows around a newly emerged active region where the dominant flow structure is an outflow from the sunspots. Figure 3 shows the flows near a large, mature active complex, which has persisted for several solar rotations and undergone multiple flux emergence events.
The spatial resolution achieved by this technique is largely determined by the size of the analysis tiles—which determines the wavelength of the waves that are sampled; however, the shape of the apodization function, the details of the fitting procedure and the damping length of the waves may also play a role (Hindman et al., 2005; Birch et al., 2007). For the tiles used in this study, we expect that the shape of the averaging kernel is essentially the product of a vertical profile and a horizontal planform. The vertical profile is provided by the standard -mode eigenfunction and the horizontal planform is a singly-humped function that vanishes at the edge of the tile and peaks at the tile center (Birch et al., 2007). Since the modes are surface gravity waves, they are confined to a narrow layer just below the solar surface. The exact depth to which the eigenfunction extends is proportional to the horizontal wavelength. However, the small tiles used in this study permit only a relatively narrow band of wavelengths to be measured. Thus, the vertical eigenfunctions of the measured modes are rather similar and the flow measurements are essentially a mean over a layer spanning the first 2 Mm below the photosphere.
3 Flows within Active Regions
We have generated daily flow maps using MDI Dynamics Program data for three periods of time in three subsequent years: 1 March to 26 May 2001, 11 January to 21 May 2002 and 12 September to 15 November 2003. In total, due to gaps in some of these periods, we have produced flow maps for 201 days of data. We have analyzed the measured flow maps with two distinct procedures. The first is the calculation of probability density functions (PDFs) for a variety of flow parameters within both quiet sun and within regions of magnetism. From these PDFs we examine how the mean properties of the flow vary with magnetic activity as well as how the shapes of the distributions change. The second analysis involves identifying active regions, measuring spatially structured flows within those regions and computing average active region flow structures.
3.1 Probability Density Functions for Flow Properties
We compute distribution functions for the zonal and meridional components of the flow field as well as for the divergence and vorticity of the flow. Since our HRRA procedure only produces estimates of the horizontal flow, the divergence that we compute is only the horizontal divergence and the vorticity is only the vertical component of the vorticity. Since we are interested in the differences in the flow field between magnetized regions and quiet sun, we need to analyze active pixels separately from quiet pixels. This requires that we produce colocal flow maps and magnetograms with the same pixel spacing. We achieve this by using MDI magnetograms and interpolating our HRRA flow maps to the same spatial sampling via splines. Simultaneously, we compute the spatial derivatives necessary for the divergence and the vorticity by utilizing the same spline coefficients. PDFs are computed for quiet sun through the selection of flow measurements from only those pixels with a field strength less than 50 G. Separately, PDFs for magnetized regions are calculated using pixels with a field strength greater than 50 G. Furthermore, since we expect that many of the flow properties may be functions of latitude, we compute separate PDFs for different latitudinal bands. There are 11 bands in total, each wide, with centers separated by 10∘ and evenly distributed about the equator. Each quiet sun PDF is constructed of over 105 independent flow measurements, whereas, due to their low filling factor, the PDFs for active regions are composed of roughly 104 distinct measurements. As a test, we have varied the width and number of latitudal bands, finding little difference in the results except for the expected changes in error estimates due to the number of data points in each band. For simplicity, we have chosen to show only the results for the 10∘ bands.
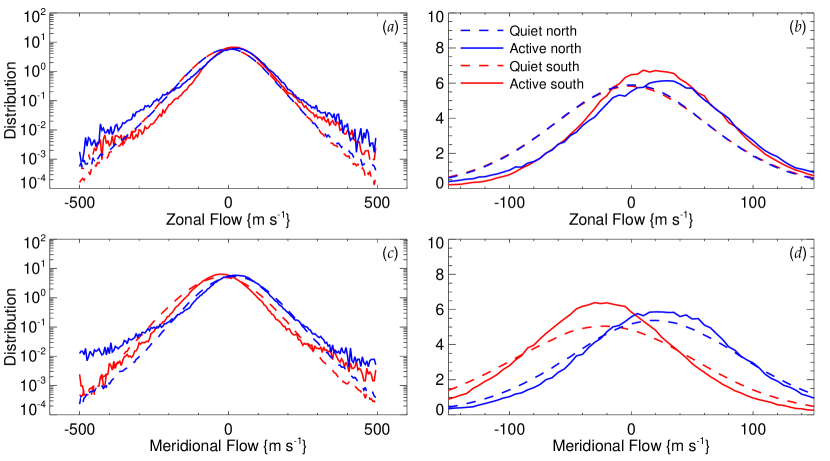
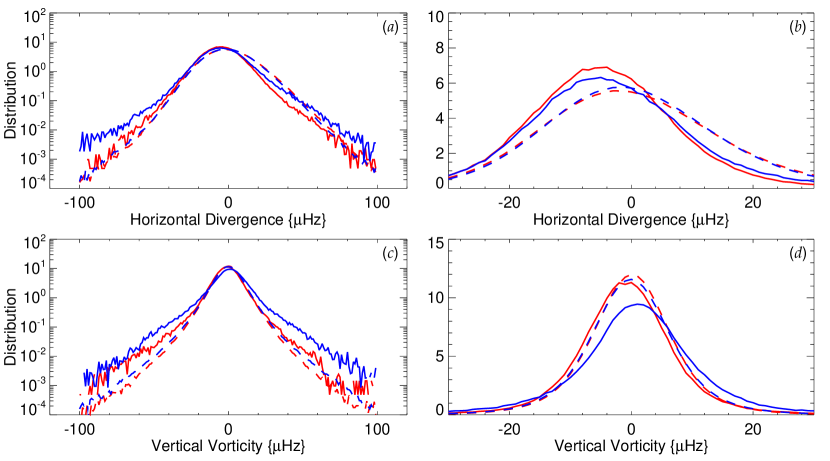
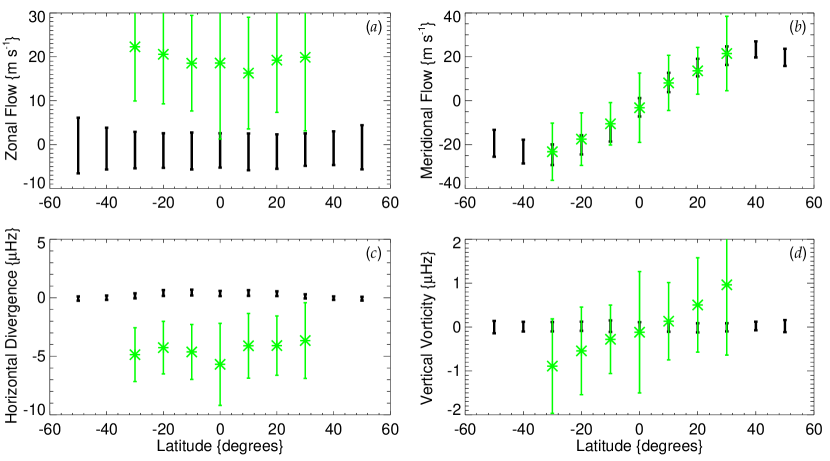
Figures 4 and 5 present the distribution functions for active and quiet regions. For clarity, we have only shown the distributions for the latitudinal bands centered at north and south of the equator. Figure 6 shows the mean values of these distributions as a function of latitude. From this set of figures one can clearly see that, on average, magnetized regions rotate across the solar disk more rapidly than quiet regions (by roughly 20 m s-1), yet magnetized regions appear to move poleward at the same rate as quiet regions. Furthermore, the meridional circulation is poleward, with a nearly sinusoidal shape as a function of latitude. We see no evidence for residual circulations in the active bands as seen by some helioseismic studies Zhao & Kosovichev (2004); González Hernández et al. (2008). this may be the result of averaging the flows over three separate years and the relatively small size of these residual circulations ( 5 m s-1). The distributions of the divergence reveal that active regions appear as zones of converging flow, while quiet sun is on average slightly divergent. Finally, magnetized regions possess cyclonic vortical motions that increase linearly with latitude. These findings will be discussed in more detail in §4.
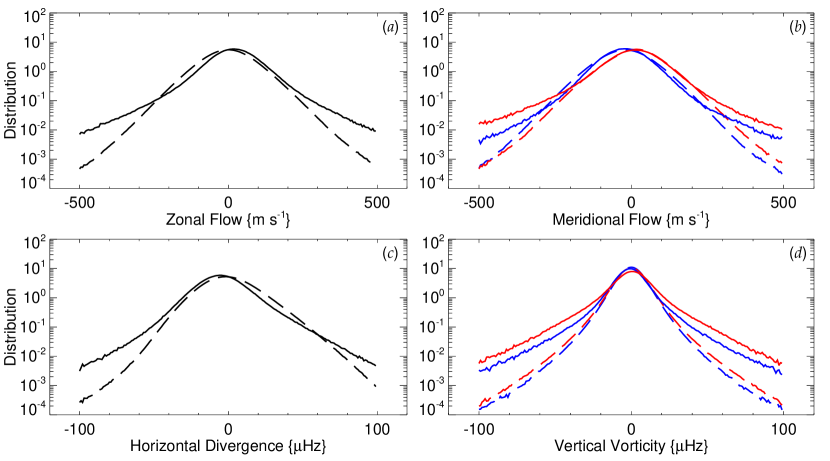
In order to examine the shape of the distributions with a better signal-to-noise ratio, we average the distributions over latitude. Since the PDFs for the zonal flow and divergence are largely independent of latitude, we average these over all latitudes. The meridional flow and the vorticity are antisymmetric with latitude; therefore, we average those separately over each hemisphere. The results are shown in Figure 7. The mean shifts between magnetized and quiet regions are obvious in these figures. However, it is now also clear that the shape of the distributions change within active regions. In particular, the distributions of all flow quantities within active and quiet regions have similar cores, but those in active regions possess extended wings, indicating that a wider range of speeds is present. Furthermore, in the divergence distributions, the flows in the quiet sun are notably asymmetric, with more area occupied by diverging flows than converging flows. On the other hand, in active regions, the flows are quite symmetric. Typical widths for the zonal and meridional flow distributions are 80 m s-1, while the divergence and vorticity have widths on the order of 20 Hz and 10 Hz, respectively.
TABLE 1
Moments of the Distributions
| Quiet Regions | Magnetized Regions | ||||
| Flow Property | Hemisphere | Mean1 | Variance1 | Mean1 | Variance1 |
| Zonal Flow | Both | -1.1 | 81.6 | 19.0 | 87.8 |
| Meridional Flow | North | 14.0 | 82.0 | 10.0 | 94.6 |
| Meridional Flow | South | -20.4 | 82.0 | -19.8 | 79.2 |
| Divergence | Both | 0.2 | 17.0 | -4.4 | 17.1 |
| Curl | North | 0.005 | 9.6 | 0.4 | 15.7 |
| Curl | South | 0.01 | 8.9 | -0.7 | 12.1 |
| 1The means and variances for the zonal and meridional flow are measured in | |||||
| units of m s-1. The divergence and vorticity are measured in units of Hz. | |||||
| The variance is defined, as usual, as the second central moment of the distribution. | |||||
3.2 Flow Structures within Active Regions
In order to assess the importance of organized flow structures within active regions, we have chosen to average flow properties over different zones within an active region. These zones are identified by various contour levels in smoothed maps of the unsigned magnetic flux. Figure 8 shows an MDI magnetogram of NOAA AR9433 (the same active region shown in Figure 3). The overlying contours were obtained by smoothing the modulus of the magnetogram with a Gaussian filter with a width of in heliographic angle—the same spatial resolution as the helioseismic flow measurements. Any region with magnetic field strength greater than 50 G was labeled active. Only regions within of disk center were considered since the helioseismic measurements have a similar coverage. Figure 9 shows distributions of the area and total magnetic flux of the resulting set of flux concentrations. We further winnowed our sample of flux concentrations by selecting only the subset with areas greater than Mm2. Over the course of the 201 days of data, over 100 independent flux concentrations meeting these criteria were identified.
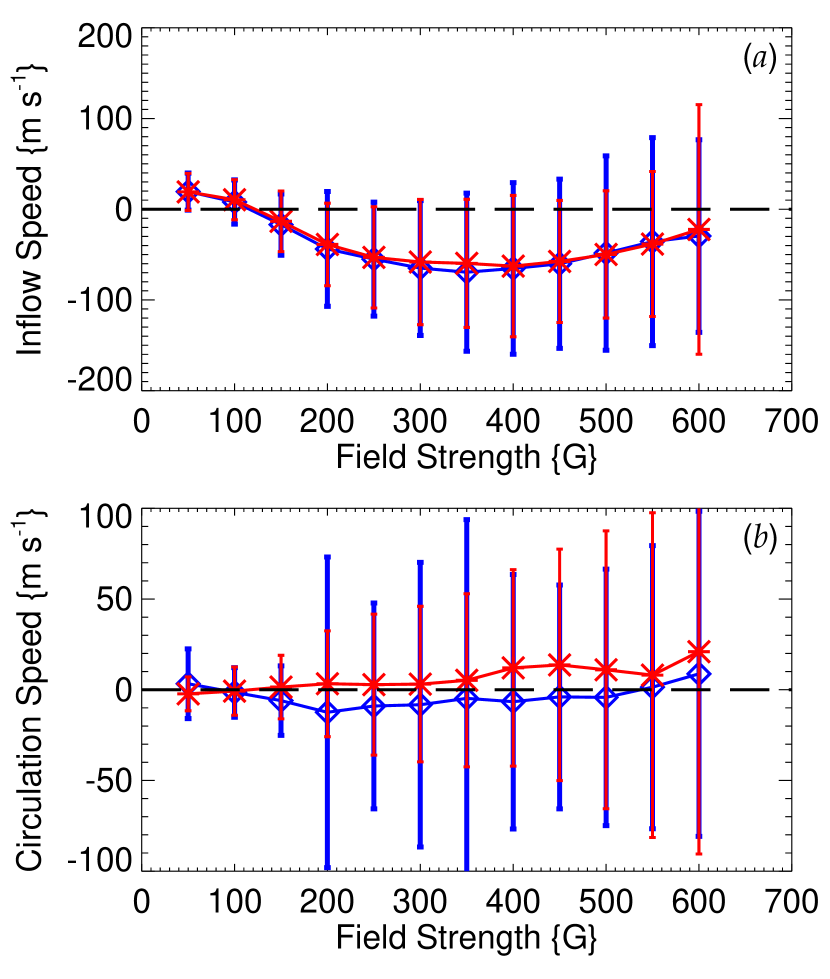
The flows coincident with each of the magnetic contours within each of these active regions are decomposed into an inflow component (perpendicular to the contour and pointed inwards) and a circulation component (parallel to the contour and pointed counterclockwise). For each active region, a line integral was performed around each contour to compute the mean inflow speed and the mean circulation speed. The results for each strength of magnetic contour were then averaged over all active regions in the sample to form mean inflow and circulation speeds as a function of the magnetic field strength .
| (3.1) | |||||
| (3.2) | |||||
In the expressions above, the integrals are contour integrals around the magnetic contour with magnetic flux density of the th active region in our sample. The unit vectors and are, respectively, normal and tangential to the magnetic contour, with the normal pointing inward toward higher field strength and the tangent pointing counterclockwise around the contour. Each integral is divided by the length of the contour to generate an average speed and the summation is a weighted average over all active regions, with the weights, , proportional to the length of the contour.
The above averaging process was performed separately for active regions whose flux weighted centers lie in the northern hemisphere and those in the southern. The results are shown in Figure 10. The periphery of active regions possess positive inflows with an amplitude of 20–30 m s-1 and have a weak tendency for cyclonic circulation with a speed of 5 m s-1. As the field strength increases towards the interior of active regions, this inflow turns into an outflow, presumably forming a downflow where the two flows meet. The very core of active regions, formed by sunspots, are zones of strong outflow ( m s-1) and anticyclonic motion with a rotational speed of approximately 10 m s-1.
4 Discussion
Using HRRA we have estimated the horizontal flow field within the upper 2 Mm of the solar convection zone by measuring the Doppler shifts of modes. Flow maps for 201 days of data with a horizontal resolution of 2∘ have been produced and two separate analysis procedures applied. Firstly, from these flow maps we have calculated PDFs of the zonal flow, the meridional flow, the flow’s divergence and it’s vorticity. Secondly, we have computed mean inflow rates and circulation speeds at various magnetic field strength levels within active regions. From these analyses we deduce the following, and will expand upon these findings in the subsequent subsections.
-
•
Magnetized regions rotate more rapidly across the solar disk than nonmagnetized regions (by roughly 20 m s-1).
-
•
Magnetized regions are advected poleward by the meridional circulation at the same rate as quiet regions.
-
•
On average, magnetized regions possess convergent cyclonic vortical motions, whereas the flows in quiet sun are weakly divergent without a measurable vortical preference.
-
•
The flows within active regions span a wider range of flow speeds than those seen in quiet sun.
-
•
The divergence distribution in quiet sun peaks at zero, but is asymmetric about this peak value, with more of the solar surface covered by outflows than inflows. The divergence distribution in magnetized regions peaks at a negative value (converging flows), and is symmetric about its peak.
-
•
The periphery of an active region is a zone of inflow (20–30 m s-1) as well as a zone of cyclonic circulation ( m s-1).
-
•
The moat flows streaming from sunspots form anticylones with a mean rotational speed of roughly 10 m s-1.
4.1 Bulk Motion of Active Regions
We find that active regions, on average, rotate across the solar surface with a speed that is roughly 20 m s-1 faster than quiet sun at the same latitude. Our observation that active regions are zones of superrotation is consistent with the previous findings obtained through feature tracking, direct Doppler velocity measurement and helioseismology. The rate of superrotation (20 m s-1) also agrees with previous findings if one takes into consideration the spatial resolution of the various measurement schemes. Surface tracking of magnetic features (for a review see Howard, 1996) and high-resolution helioseismic measurements (Braun et al., 2004; Zhao et al., 2004) indicate that sunspots rotate at a rate that is roughly 50 m s-1 greater than quiet sun, whereas the rotation rate of plages is markedly less. The low-resolution ring-analysis procedure employed by Komm et al. (2008) finds that active regions as a whole superrotate at a rate of 4 m s-1. This low-resolution procedure has a spatial resolution of 15∘, and is thus incapable of resolving sunspots. In fact, a single flow measurement averages over sunspots, surrounding plage and even a significant portion of quiet sun. Therefore, one would expect a dilution of the superrotation rate. To a lesser degree the same averaging effect occurs here. Our horizontal spatial resolution is 2∘, which is sufficient to resolve an active region, but still incapable of resolving sunspots. Therefore, we would expect that our superrotation rate should lie between that for sunspots and that for plage.
The meridional component of the flow field within active regions behaves rather differently than the zonal component. Instead of moving at a rate that differs from quiet sun, we find that the fluid within active regions advects poleward at exactly the same speed as quiet sun. While this result confirms previous surface measurements (e.g., Švanda et al., 2007), this is the first time that such a result has been reported for helioseismic measurements. It is not entirely clear how this evident poleward advection of the bulk of the active region can be reconciled with the observation that sunspots lack systematic poleward motion (e.g., Wöhl & Brajša, 2001; Wöhl, 2002).
When a rising flux rope first emerges through the solar surface, we expect that the magnetized region will be marked by an upwelling that swells horizontally—due to the decreasing gas pressure with height in the solar atmosphere. At this point in the active region’s evolution, the magnetic field is dynamically important both at the surface and below. Thus, the field at the solar surface is influenced by the flows all along the flux rope. This may explain why magnetic regions rotate more quickly than the quiet sun. The Sun’s rotation rate increases with depth throughout the upper 30 Mm of the convection zone and the magnetic field in the sunspot might be grabbed and dragged by the fast moving subsurface layers (e.g., Gilman & Foukal, 1979; Hiremath, 2002; Sivaraman et al., 2003). However, if similar arguments are made for meridional advection of magnetic elements a contradiction arises. Plage within active regions and small magnetic elements outside of active regions are observed to passively advect with the meridional circulation. This observation is consistent with the helioseismic determinations of the meridional flow, since those measurements indicate that the flow remains roughly constant with depth in the upper 20 Mm of the convection zone (Haber et al., 2002; Zhao & Kosovichev, 2004). However, the lack of systematic meridional motion by sunspots, by the same arguments, would appear to indicate that the sunspots must be rooted very deeply, within the supposed return flow in the meridional circulation. This is clearly in contradiction with the helioseismic observations that fail to find such a return flow within the near-surface shear layer, which is where we have presumed that the sunspots are anchored in order to explain their superrotation.
This conundrum becomes even more complicated if we consider what might happen as an active region ages. Fan et al. (1994) have suggested that the connection between the field at the surface and its underlying roots may be broken through a dynamical disassociation process. Their original suggestion involved the establishment of hydrostatic equilibrium throughout the length of the tube once it emerges. Due to differences in entropy stratification between the fluid within the tube and the external field-free gas, at a layer roughly 10 Mm below the solar surface, the internal and external gas pressure match. Therefore, lateral pressure balance requires that the magnetic pressure vanish, the tube herniates and turbulent convection shreds the tube because the magnetic field becomes dynamically insignificant. The field above the herniation layer becomes disconnected from the field below, thus enabling the surface field to be advected and dispersed by near-surface flows, a process that is presently well-modelled by surface transport models (e.g., Wang et al., 1989; van Ballegooijen et al., 1998; Schrijver, 2001; Baumann et al., 2004).
Schüssler & Rempel (2005) have pointed out that the establishment of hydrostatic equilibrium along the entire length of the flux rope is much too slow a process. Observations of the changing dynamics of magnetic structures in the photosphere indicate that the field begins to disconnect a couple of days after emergence. Schüssler & Rempel (2005) have refined the dynamical disconnection model by demonstrating that surface cooling in regions of intense magnetism can drive downflows that both concentrate the field at the surface (through evacuation and collapse) and enhance the dynamical disconnection at depth by increasing the subsurface pressure where the deep upflow along the flux rope and the surface driven downflow meet. This process operates quickly, on a time scale of several days after emergence, and recent helioseismic studies indicate that the flows within active complexes change from upflows to downflows over such a period of time (Komm et al., 2008). The mechanism may explain the observation that young sunspots rotate more rapidly than old sunspots (e.g., Balthasar et al., 1982; Švanda et al., 2008a). Initially, the sunspot is dragged by rapidly rotating subsurface layers, but after disconnection the sunspot slows due to viscous or turbulent drag. Similarly, the observed advection of plage and weak field both inside and outside active regions is well-explained. Dynamical disconnection allows the magnetic flux to advect like a passive tracer since its roots have been severed. We once again find that the sticking point is the lack of systematic meridional motion by sunspots. If sunspots become disconnected from their roots in a matter of 2 or 3 days, we would expect that the meridional circulation would exert its influence and begin to advect the sunspots poleward.
4.2 Steady Flows Established around Mature Active Regions
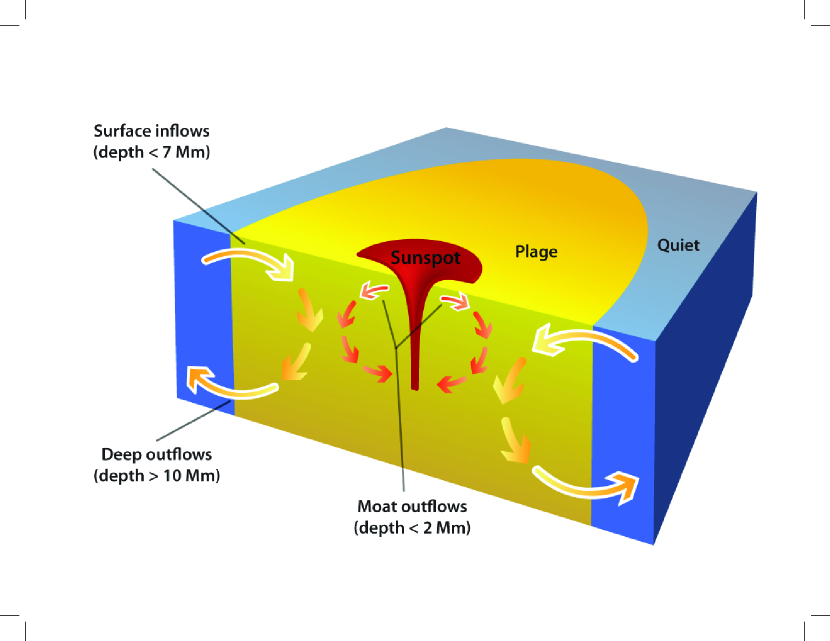
In addition to the bulk motions of active regions, we have measured internal flow structures. Two separate but related measurements (the mean divergence and the mean inflow speed) show that within the surface layers, active regions are zones of convergence. From the PDFs of the divergence we see that on average, magnetized regions possess a negative divergence (see Figures 6 and 7). Note however, that the variance about this mean value for the divergence is much larger than the mean itself (see Table 1). Equivalently, our measurements of the mean inflow speeds within the surface layers of active regions show that almost all active regions possess a net inflow of 20–30 m s-1 at their periphery. Conversely, the cores of active regions, formed by the presence of sunspots, possess strong outflows. These outflows arise from the moat flows that extend 10–20 Mm beyond the penumbra (e.g., Sheeley, 1972; Harvey & Harvey, 1973; Gizon et al., 2000; Hagenaar & Shine, 2005). The presence of inflows at the periphery and outflows from sunspots dictates that somewhere within the active region’s plage, the two flows meet and downflow must occur. Presumably, the downflow within the plage connects to the deep outflows that are seen to emerge from active regions at depths greater than 10 Mm in low-resolution helioseismic flow measurements (Haber et al., 2003, 2004). This downflow may also partially supply the return flow needed for the moat flow observed at the surface, although as of yet helioseismology has not been able to tell us how deeply this return flow may be rooted. Figure 11 shows a cartoon sketch of the inferred circulations. The flows indicated with the arrows outlined in white have been directly observed through helioseismic techniques (e.g., Gizon et al., 2000; Braun & Lindsey, 2003; Haber et al., 2003; Gizon & Birch, 2005) as well as through direct Dopper velocity measurements (e.g., Sheeley, 1972) and magnetic feature tracking (e.g., Brickhouse & Labonte, 1988). The remaining flows are a logical means of connecting the observed components of the flow field; however, without direct helioseismic measurement of the vertical component of the flow—which still remains elusive, the topology of this circulation remains speculative.
We also find systematic circulations around active regions. From the PDFs of the vertical component of the vorticity (see Figures 6 and 7) we deduce that magnetized regions have a tendency to possess cyclonic vorticity. Consistently, we also measure a mean cyclonic circulation speed of roughly 5 m s-1 around the peripheries of active regions. Just as the inflows transition to outflows as we move from the edge of an active region toward the sunspots, the circulations transition from cyclonic flows around the boundary to anticyclones at the location of the sunspots.
4.3 Source of the Inflows and Circulations
One possible mechanism for the generation of the surface inflows into active regions has already been mentioned. Plage and faculae are bright and, therefore, locations of radiative cooling (e.g., Fontenla et al., 2006). Radiative cooling in magnetized surface layers will generate downflows as cool, dense material looses buoyancy and plunges into the solar interior. Such downflows draw fluid from the surrounding surface layers, generating inflows into magnetized regions. The effect of enhanced surface cooling may be further augmented by a reduction in the convective energy flux within regions of magnetism, arising from the systematic suppression and modification of granulation.
One consequence of such a model is that the inflow speed may well be a function of the area occupied by the active region’s plage. The radiative cooling and hence the mass downflow rate should be proportional to the area of the plage, whereas the mass flux into the active region is proportional to the inflow speed and the circumference of the active region. If the mass supply rate from the inflow is to equal the subduction rate, the inflow speed must increase as the square root of the area of the plage. Furthermore, the inflow should extend for some distance into the quiet sun around the active region. To date, no attempt has been made to detect correlations between inflow speed and active region size nor has the inflow been systematically measured in quiet sun in the vicinity of active complexes. We plan to pursue such studies in the near future.
If the surface cooling mechanism is correct, the moat flows that stream from sunspots would seem to indicate that sunspots do not participate in the same radiative cooling, or perhaps the surface cooling within sunspots is significantly weaker than it is in plage. However, the facts that moat flows do not appear isotropically around all sunspots, and that the presence of moat flows appears to be connected to the existence of penumbra (Vargas Domínguez et al., 2007, 2008), provide evidence that another mechanism may be at work. Depending on the mechanism, the depth of the return flow is likely to be very different. Using time-distance helioseismology with modes (as opposed to modes), Zhao et al. (2001) have reported the observation of a returning inflow around a sunspot that spans a depth range of 1.5–5 Mm. However, the connection that these inflows may have to the moat flows is difficult to assess, since the moat flows themselves are not detected within that study.
The circulations that are established around active regions seem to be well correlated spatially with the observed inflows and outflows. In the region where we observe inflows into active regions, we measure cyclonic motion rotating around the active region. In those regions with outflows, we also measure anticyclones. We suspect that this correlation is not accidental. A likely explanation is that the circulations are caused by the deflection of the inflows and outflows by the Coriolis force. Therefore, the ultimate source of the circulations is the same mechanism that drives the inflows at the periphery and the mechanism that produces the moat flow around sunspots. If we assume that the flows are steady, and that the inflows are driven by a pressure gradient, we may estimate the size of the circulation speed from the momentum equation in a rotating coordinate system,
| (4.1) |
where we have explicitly dropped the partial derivative with respect to time in the advective derivative because the flows are steady. The component of this equation tangential to the pressure gradient is a balance purely between the advective derivative and the Coriolis force. For simplicity, we employ an -plane approximation and consider an active region that is circular in shape. In polar coordinates with the origin at the active region’s center, the circulation speed, , is given by the angular component of equation (4.1)
| (4.2) |
If we assume that the flow extends over a radial distance , then the circulation speed may be estimated by
| (4.3) |
If we assume that equals the radius of a typical active region, 100 Mm, and we use the Carrington rotation rate, nHz, we estimate a circulation speed of 46 m s-1 at a latitude of 30∘. Clearly, this estimate depends critically on , the distance over which the inflow extends into quiet sun. But for reasonable values, the Coriolis force is strong enough to generate circulation speeds on the order of 5 m s-1. Furthermore, the effect should increase with latitude and should be antisymmetric about the equator, as is reproduced in Figure 6.
A similar mechanism was suggested by Spruit (2003) as the source of the torsional oscillations. In his model, radiative cooling is enhanced in the active region belts by reduced opacity within the small-scale magnetic fibrils forming the plage (e.g., Spruit, 1977). This induces a slight decrease in temperature and pressure within the active latitudes. Coriolis forces generate steady geostrophic flows around these low pressure regions and the torsional oscillations are simply the resulting thermal wind. One possible extension of Spruit’s model would be to argue that geostrophic balance is established around each active region separately as the radiative cooling is localized to the plage. A longitudinal average of these geostrophic circulations would result in a zone of faster rotation at the low-latitude edge of the active region belt and a slow down at the high-latitude edge.
In our case, we measure circulations around each active region that possess the same handedness as the geostrophic flows in Spruit’s model and the measured circulation speed ( m s-1) is comparable to the amplitude of the torsional oscillations, it is reasonable to ask if our circulations are the source of the torsional oscillations. If this were so, the amplitude of the torsional oscillation should be the mean active region circulation speed multiplied by the fraction of longitudes occupied by magnetic activity. Since the circulation speed measured here is only 5 m s-1, a dilution by a longitudinal filling factor would result in torsional oscillations with an amplitude that is only a fraction of the observed value. Of course the extent to which the flows protrude into quiet sun will reduce the dilution factor. We should also point out that the torsional oscillation pattern extends to high latitude during the quiet phase of the solar cycle when active regions are largely absent (Schou, 1999; Basu & Antia, 2003; Howe et al., 2005, 2006). This property suggests that another mechanism is at work either in isolation or in conjunction with active region circulations.
4.4 Convective Motions of Active Regions
It has long been known that granulation is modified and perhaps suppressed within regions of intense magnetism. Whether this suppression applies to larger scales of convection is not as clear. We find here that for scales of motion larger than supergranulation, the flows appear to be less organized within magnetic active regions; they lack the regular tiling of convection cells that is apparent within quiet sun (see Figure 3). Despite the disruption of the cellular pattern, the flows speeds within active regions are generally larger than in quiet sun. This increase in speeds isn’t caused by a general broadening of the distribution. Instead the PDFs evince elevated tails for flow speeds in excess of 200 m s-1.
Another noticeable difference between the PDFs in active and quiet regions is the shape of the divergence distribution. In quiet sun, the distribution is asymmetric with an enhanced wing corresponding to positive values of the divergence. Therefore, a larger percentage of the solar surface is occupied by divergent outflows than convergent inflows. This property is consistent with the asymmetric nature of solar convection that is seen in numerical simulations of solar convection, where the convection is composed of zones of broad, upwelling outflows in the center of convection cells and the narrow, inflowing downflows at the cell boundaries (e.g., Stein & Nordlund, 1989, 1998; Cattaneo et al., 1991; Brummell et al., 1996). This asymmetry arises from the gravitational stratification. Upflows expand as they rise because of the decreasing gas pressure. Downflows contract into plumes as they descend for the same reason. Note that the measured PDFs for the divergence do not exhibit the bimodal structure seen in large-scale global numerical simulations (Miesch et al., 2008). We suspect that this arises because the observations under-resolve the narrow downflow lanes. Interestingly, the PDFs do not exhibit the same asymmetry within magnetized regions. In fact, the divergence distribution is rather symmetric, showing no preference for either convergence or divergence. The magnetic activity has changed the fundamental nature of the convection. Perhaps magnetoconvection does not result in the same organized cellular structure that is so apparent in both observations and simulations of quiet sun. This is certainly the impression one receives when one examines our flow maps in regions of activity; however, we have yet to quantitize this property in a meaningful way.
4.5 Production of Magnetic Shear
We measure cyclonic rotation about the active region at the periphery of the active region and anticyclonic motion within the cores of active regions. Clearly such differential motion results in shear that imparts twist to the magnetic field within active regions. Let us first consider the cyclonic inflow. In an active region with a diameter of 300 Mm, a flow of 5 m s-1 around the periphery results in a circumnavigation time for a fluid parcel of roughly 2000 days. This is clearly a very slow windup that is unlikely to result in significant magnetic shear over the lifetime of the active region. The anticylonic moat flows from sunspots, on the other hand, are more significant. Assuming that the moat flow extends out to a radius of 20 Mm with a rotational speed of 10 m s-1 (see Figure 10), a complete winding of the field would occur in 145 days. Thus over the course of a single Carrington rotation, significant shear can be introduced into an otherwise stable magnetic configuration. Of course shear of this nature may aid in the destabilization of the magnetic field, leading to flares and coronal mass ejections. We suspect that the correlations between flaring activity and the vorticity measured in low-resolution helioseismic measurements (Mason et al., 2006) may result from the large-scale shearing motions observed here.
We note that the measurement of systematic trends in the behavior of the flow vorticity is difficult since the trends are weak; averaging over a substantial number of active regions is required. The inflows and outflows, on the other hand, are quite robust signatures that are easily observed even within a single active region. This difference arises primarily because the circulations have an amplitude 4–5 times smaller than the inflows and outflows. Since we suspect that the systematic cyclonic and anticyclonic motions that produce magnetic shear are caused by Coriolis deflection of the inflows and outflows, there is a strong possibility that the inflows and outflows may be a better predictor of flare activity, simply because of their greater amplitude.
4.6 Surface Inflows and Flux Confinement
The surface inflows may play a very dramatic role in the evolution of active regions. Hurlburt & DeRosa (2008) have suggested that the observed surface inflows may inhibit the diffusion of magnetic flux out of active regions, thereby prolonging the lifetime of an active region before it breaks up and disperses. By their estimates, the advection of field due to an inflow with a speed between 10 and 100 m s-1 should be sufficient to balance the outward transport of magnetic field by turbulent diffusion. This is exactly the range in which our measured inflows fall. Therefore, flows on all scales may be crucial in the decay of active complexes. Turbulent diffusion of the field by supergranulation and smaller-scale flows works to disperse the field, but is counteracted, at least partially, by coalescence of field arising from inward advection by flows with spatial scales larger than supergranulation. This argument is predicated on the assumption that the magnetic field is not structured on the scale of the larger-scale flows. If, for example, the magnetic flux is concentrated at the boundaries of giant cells, as it is for granules and supergranules, spatial correlations between the magnetic flux and large-scale flows would prevent the mean magnetic advection rate from simply being the product of the mean inflow speed and the mean flux density. However, we have tested this possibility and found it not to be the case. We compute the mean field advection rate by the relation
| (4.4) | |||||
| (4.5) |
where is the magnetic flux density and is the mean field strength along a contour. Note that is the magnetic field strength associated with the contour, which is derived from the smoothed magnetograms; whereas is the field strength within the full-resolution magnetograms. We find that, within the observational errors, is identical to the mean inflow rate shown in Figure 10. Thus, the transport of the magnetic field is dominated by advection by the large-scale flow component. The consolidation of the field within active regions is therefore an important mechanism that impedes the dissolution of active regions through turbulent diffusion. In fact, the inward advection may be sufficiently strong that flux sequestration becomes a difficulty for models of the evolution of the sun’s global magnetic field, which rely on the steady diffusion of flux from active regions (DeRosa & Schrijver, 2006). However, before we declare that the surface inflows problematically inhibit the dispersal of magnetic flux from active regions, an additional question must be answered. We must ascertain whether the surface inflows vary over the lifespan of an active region. It is likely that young active regions possess strong inflows and hold onto their magnetic flux rather tightly; whereas older regions have weakened inflows, thus enabling the escape of large amounts of magnetic flux. To date such studies have yet to be performed.
5 Conclusions
Using ring analysis, we have measured the flow field within the upper 2 Mm of the solar convection zone with a spatial resolution of 2∘. From these measurements we have found that solar active regions have a bulk motion with respect to quiet sun as well as large-scale circulation cells associated with their presence. The bulk motion consists of a 20 m s-1 prograde motion relative to quiet sun at the same latitude, with simultaneous meridional advection that moves in lock step with the surrounding field-free plasma.
The large-scale circulations that are established resemble, in many ways, an inverted hurricane (see the schematic diagrams shown as Figures 11 and 12). In a hurricane, evaporation from a warm sea surface drives an upflow and a concomitant inflow to feed the upwelling. The upflow eventually spreads high above the surface forming an outflow. Coriolis forces act upon the surface inflows and spin up the storm until a quasigeostrophic balance is achieved. For active regions, surface cooling by enhanced radiative losses in plage plays the role of a warm sea surface. However, instead of causing a warm upwelling, this cooling causes a descending downdraft. This downdraft pulls in fluid from the surroundings causing an inflow and the attendent cyclonic motion.
The existence of sunspots modifies this picture somewhat. It may be that the surface cooling is weaker within sunspots and that sunspots represent a hole in the downdraft caused by plage. The outflow from the sunspots could simply be drawn to feed the annular downdraft. However, a more likely explanation is that the outflows result from a different mechanism entirely, one that depends crucially on the orientation of the penumbral filaments. Whatever the source, Coriolis forces acting on these outflows produce a measurable flow deflection, resulting in a net anticyclonic rotation about the sunspot. While this rotation is fairly weak, over the lifetime of an active region, the rotation should produce significant shear, perhaps playing a role in destabilizing the coronal magnetic field overlying the active region.
Superimposed on these circulations are convective flows. We find that quiet sun exhibits a notable asymmetry where a larger percentage of the solar surface is covered with outflows than inflows. For the spatial scales that our helioseismic technique samples, we find that within active regions this asymmetry disappears, and parity between convergence and divergence is attained. Why this occurs isn’t obvious; however, it may have something to do with the disruption or segmentation of the larger convective scales by the presence of magnetism. Our measurement technique is only capable of measuring flows with a spatial scale larger than 2∘ in heliographic angle ( 24 Mm). Therefore, we sample flows larger than supergranulation. It would be quite useful to perform a similar study with finer resolution where supergranules are explicitly resolved.
References
- Balthasar et al. (1982) Balthasar, H., Schüssler, M., & Wöhl, H. 1982, Sol. Phys., 76, 21
- Basu et al. (1999) Basu, S., Antia, H. M., & Tripathy, S. C. 1999, ApJ, 512, 458
- Basu & Antia (2003) Basu, S., & Antia, H. M. 2003, ApJ, 585, 553
- Baumann et al. (2004) Baumann, I., Schmitt, D., Schüssler, M., & Solanki, S. K. 2004, A&A, 426, 1075
- Birch et al. (2007) Birch, A. C., Gizon, L., Hindman, B. W., & Haber D. 2007, ApJ, 662, 730
- Bogart et al. (1995) Bogart, R. S., Sá, L. A. D., Duvall, T. L., Jr., Haber, D. A., Toomre, J., & Hill, F. 1995, in Proc. 4th SOHO Workshop, Helioseismology, ed. J. T. Hoeksema et al., (ESA SP-376; Noordwijk: ESA), 147
- Braun & Fan (1998) Braun, D. C., & Fan, Y. 1998, ApJ, 508, L105
- Braun & Lindsey (2003) Braun, D. C., & Lindsey, C. 2003, in Proc. of SOHO 12 / GONG+ 2002, Local and Global Helioseismology: The Present and Future, ed. H. Sawaya-Lacoste, (ESA SP-517; Noordkwijk: ESA), 15
- Braun et al. (2004) Braun, D. C., Birch, A. C., & Lindsey, C. 2004, in Proc. of the SOHO 14 / GONG 2004 Workshop, Helio- and Asteroseismology: Towards a Golden Future, ed. D. Danesy, (ESA SP-559; Noordwijk: ESA), 337
- Brickhouse & Labonte (1988) Brickhouse, N. S., & LaBonte, B. J., 1988, Sol. Phys., 115, 43
- Brummell et al. (1996) Brummell, N. H., Hurlburt, N. E., & Toomre, J. 1996, ApJ, 473, 494
- Cattaneo et al. (1991) Cattaneo, F., Brummell, N. H., Toomre, J., Malagoli, A., & Hurlburt, N. E. 1991, ApJ, 370, 282
- DeRosa & Schrijver (2006) DeRosa, M. L., & Schrijver, C. J. 2006, in Proc. of SOHO 18 / GONG 2006, Beyond the Spherical Sun, ed. K. Fletcher, (ESA SP-624; Noordkwijk: ESA), 12.1
- Fan et al. (1994) Fan, Y., Fisher, G. H., & McClymont, A. N. 1994, ApJ, 436, 907
- Fontenla et al. (2006) Fontenla, J. M., Avrett, E., Thuillier, G., & Harder, J. 2006, ApJ, 639, 441
- Giles et al. (1997) Giles, P. M., Duvall, T. L., Jr., Scherrer, P. H., & Bogart, R. S. 1997, Nature, 390, 52
- Gilman & Foukal (1979) Gilman, P. A., & Foukal, P. V. 1979, ApJ, 229, 1179
- Gizon et al. (2000) Gizon, L., Duvall, T. L., Jr., & Larsen, R. M. 2000, J. Astrophys. Astron., 21, 339
- Gizon et al. (2001) Gizon, L., Duvall, T. L., Jr., & Larsen, R. M. 2001, in Proc. IAU Symposium 203, ed. P. Brekke, B. Fleck & J. B. Gurman, (San Francisco: ASP), 189
- Gizon & Birch (2005) Gizon, L., & Birch, A. C. 2005, Living Reviews in Solar Physics, 2, 6
- Golub & Vaiana (1978) Golub, L., & Vaiana, G. S. 1978, ApJ, 219, L55
- González Hernández et al. (2008) González Hernández, I., Kholikov, S., Hill, F., Howe, R., & Komm, R. 2008, Sol. Phys., 252, 235
- Haber et al. (1998) Haber, D. A., Hindman, B. W., Toomre, J., Bogart, R. S., Schou, J., & Hill, F. 1998, in Structure and Dynamics of the Interior of the Sun and Sun-like Stars, ed. S. G. Korzennik & A. Wilson, (ESA SP-418; Noordwijk: ESA), 791
- Haber et al. (2000) Haber, D. A., Hindman, B. W., Toomre, J., Bogart, R. S., Thompson, M. J., & Hill, F. 2000, Sol. Phys., 192, 335
- Haber et al. (2001) Haber, D. A., Hindman, B. W., Toomre, J., Bogart, R. S., & Hill, F. 2001, in Helio- and Astero-seismology at the Dawn on the Millenium, ed. A. Wilson, (ESA SP-464; Noordwijk: ESA), 209
- Haber et al. (2002) Haber, D. A., Hindman, B. W., Toomre, J., Bogart, R. S., & Larsen, R. M. 2002, ApJ, 570, 855
- Haber et al. (2003) Haber, D. A., Hindman, B. W., & Toomre, J. 2003, in Proc. of SOHO 12 / GONG+ 2002, Local and Global Helioseismology: The Present and Future, ed. H. Sawaya-Lacoste, (ESA SP-517; Noordkwijk: ESA), 103
- Haber et al. (2004) Haber, D. A., Hindman, B. W., & Toomre, J. 2004, Sol. Phys., 220, 371
- Hagenaar & Shine (2005) Hagenaar, H. J., & Shine, R. A. 2005, ApJ, 635, 659
- Harvey & Harvey (1973) Harvey, K., & Harvey, J. 1973, Sol. Phys., 28, 61
- Hathaway et al. (1996) Hathaway, D. H., et al. 1996, Science, 282, 1306
- Hindman et al. (2005) Hindman, B. W., Gough, D., Thompson, M. J., & Toomre, J. 2005, ApJ, 621, 512
- Hindman et al. (2006a) Hindman, B. W., Haber, D. A., & Toomre, J. 2006a, ApJ, 653, 725
- Hindman et al. (2006b) Hindman, B. W., Haber, D. A., & Toomre, J. 2006b, in Proc. of SOHO 18 / GONG 2006, Beyond the Spherical Sun, ed. K. Fletcher, (ESA SP-624; Noordkwijk: ESA), 11.1
- Hiremath (2002) Hiremath, K. M. 2002, A&A, 386, 674
- Howard & Harvey (1970) Howard, R. F., & Harvey, J. W. 1970, Sol. Phys., 12, 23
- Howard et al. (1984) Howard, R., Gilman, P. A., & Gilman, P. I. 1984, ApJ, 283, 373
- Howard (1992) Howard, R. F. 1992, Sol. Phys., 142, 233
- Howard (1996) Howard, R. F. 1996, ARA&A, 34, 75
- Howe et al. (2005) Howe, R., Christensen-Dalsgaard, J., Hill, F., Komm, R., Schou, J., & Thompson, M. J. 2005, ApJ, 634, 1405
- Howe et al. (2006) Howe, R., Rempel, M., Christensen-Dalsgaard, J., Hill, F., Komm, R., Larsen, R. M., Schou, J., & Thompson, M. J. 2006, ApJ, 649, 1155
- Hurlburt & DeRosa (2008) Hurlburt, N. & DeRosa, M. 2008, ApJ, 684, L123
- Komm et al. (1993) Komm, R. W., Howard, R. F., & Harvey, J. W. 1993, Sol. Phys., 145, 1
- Komm et al. (2008) Komm, R., Morita, S., Howe, R., & Hill, F. 2008, ApJ, 672, 1254
- Komm et al. (2009) Komm, R., Howe, R., Hill, F., & González Hernández, I. 2009, Sol. Phys., 254, 1
- Kosovichev & Duvall (2008) Kosovichev, A. G. & Duvall, T. L., Jr. 2008, in Subsurface and Atmospheric Influences on Solar Activity, eds. R. Howe, R. W. Komm, K. S. Balasubramaniam, and G. J. D. Petrie (ASP Conference Series 383; San Francisco: ASP), 59
- LaBonte & Howard (1982) LaBonte, B. J., & Howard, R. 1982, Sol. Phys., 80, 361
- Lindsey et al. (1996) Lindsey, C., Brau, D. C., Jefferies, S. M., Woodard, M. F., Fan, Y., Gu, Y., & Redfield, S. 1996, ApJ, 470, 636
- Mason et al. (2006) Mason, D., Komm, R. W., Hill, F., Howe, R., Haber, D. A., & Hindman, B. W. 2006, ApJ, 645, 1543
- Miesch et al. (2008) Miesch, M. S., Brun, A. S., DeRosa, M. L., & Toomre, J. 2008, ApJ, 673, 557
- Scherrer et al. (1995) Scherrer, P. H., Bogart, R. S., Bush, R. I., et al. 1995, Sol. Phys., 162, 129
- Schou (1999) Schou, J. 1999, ApJ, 543, L181
- Schrijver (2001) Schrijver, C. J. 2001, ApJ, 547, 475
- Schüssler & Rempel (2005) Schüssler, M. & Rempel, M. 2005, A&A, 441, 337
- Sheeley (1972) Sheeley, N. R. 1972, Sol. Phys., 25, 98
- Sivaraman et al. (2003) Sivaraman, K. R., Sivaraman, H., Gupta, S. S., & Howard, R. F. 2003, Sol. Phys., 214, 65
- Snodgrass (1984) Snodgrass, H. B. 1984, Sol. Phys., 94, 13
- Spruit (1977) Spruit, H. C. 1977, Sol. Phys., 55, 3
- Spruit (2003) Spruit, H. C. 2003, Sol. Phys., 213, 1
- Stein & Nordlund (1989) Stein, R. F., & Nordlund, A. 1989, ApJ, 342, L95
- Stein & Nordlund (1998) Stein, R. F., & Nordlund, A. 1998, ApJ, 499, 914
- Švanda et al. (2007) Švanda, M., Kosovichev, A. G., & Zhao, J. 2007, ApJ, 670, L69
- Švanda et al. (2008a) Švanda, M., Klvaňa, M., Sobotka, M., & Bumba, V. 2008a, A&A, 477, 285
- Švanda et al. (2008b) Švanda, M., Kosovichev, A. G., & Zhao, J. 2008b, ApJ, 680, L121
- van Ballegooijen et al. (1998) van Ballegooijen, A. A., Cartledge, N. P., & Priest, E. R. 1998, ApJ, 501, 866
- Vargas Domínguez et al. (2007) Vargas Domínguez, S., Bonet, J. A., Martínez Pillet, V., Katsukawa, Y., Kitakoshi, Y., & Rouppe van der Voort, L. 2007, ApJ, 660, L165
- Vargas Domínguez et al. (2008) Vargas Domínguez, S., Rouppe van der Voort, L., Bonet, J. A., Martínez Pillet, V., Van Noort, M., & Katsukawa, Y. 2008, ApJ, 679, 900
- Wang et al. (1989) Wang, Y. -M., Nash, A. G., & Sheeley, N. R. 1989, ApJ, 347, 529
- Ward (1966) Ward, F. 1966, ApJ, 145, 416
- Wöhl (2002) Wöhl, H. 2002, Astron. Nachr., 323, 329
- Wöhl & Brajša (2001) Wöhl, H. & Brajša, R. 2001, Sol. Phys., 198, 57
- Zhao et al. (2001) Zhao, J., Kosovichev, A. G., Duvall, T. L., Jr. 2001, ApJ, 557, 384
- Zhao & Kosovichev (2004) Zhao, J. & Kosovichev, A. G. 2004, ApJ, 603, 776
- Zhao et al. (2004) Zhao, J., Kosovichev, A. G., Duvall, T. L., Jr. 2004, ApJ, 607, L135