A HR-like diagram for galaxies: the versus relation
Abstract
We show that the relation between the mass of supermassive black holes located in the center of the host galaxies and the kinetic energy of random motions of the corresponding bulges is a useful tool to study the evolution of galaxies. In the form , the best-fitting results for a sample of 64 galaxies of various morphological types are the slope and the normalization . We note that, in analogy with the Hertzsprung -Russell diagram for stars, each morphological type of galaxy generally occupies a different area in the plane. In particular, we find elliptical galaxies in the upper part of the line of best fit, the lenticular galaxies in the middle part, and the late-type galaxies in the lower part, the mass of the central black hole giving an estimate of the age, whereas the kinetic energy of the stellar bulges is directly connected with the temperature of each galactic system. Finally, the values of the linear correlation coefficient, the intrinsic scatter, and the obtained by using the relation are better than the corresponding ones obtained from the or the relation.
1 Introduction
Today the fact that many galaxies, of different morphological types, host a supermassive black hole (SMBH) at their center has been established on quite solid grounds. The studies of the kinematics of galaxies and the combination of multi-band observations have played a major role in this scientific process. At the same time, the idea that the mass of a central SMBH is correlated with the evolutionary state of its host galaxy is being consolidated among the scientific community. In order to qualify this correlation, many relationships have been proposed between the mass of the SMBHs and almost all the possible parameters of the host galaxy bulges: the velocity dispersion (Ferrarese & Merritt, 2000; Gebhardt et al., 2000; Tremaine et al., 2002), the bulge luminosity or mass (Kormendy & Richstone, 1995; van der Marel, 1999; Richstone et al., 1998; Magorrian et al., 1998; Marconi et al., 2001; Merritt & Ferrarese, 2001; Laor, 2001; Wandel, 2002; Gebhardt et al., 2003; Marconi & Hunt, 2003; Häring & Rix, 2004; Gultekin et al., 2009b), the galaxy light concentration (Graham et al., 2001), the X-ray power density spectra (Czerny et al., 2001), the dark matter halo (Ferrarese, 2002), the radio core length (Cao & Jiang, 2002), the effective radius (Marconi & Hunt, 2003), the Sersic index (Graham & Driver, 2001, 2007), the inner core radius (Lauer et al., 2007), the gravitational binding energy and gravitational potential (Aller & Richstone, 2007), the metal abundance (Kisaka et al., 2008), the core mass deficit (Kormendy & Bender, 2009), combination of bulge velocity dispersion, effective radius and/or intensity (Aller & Richstone, 2007), and, very recently, the X-ray luminosity, the radioluminosity (Gultekin et al., 2009c), and active galactic nucleus jets (Soker, 2009). An alternative approach has been proposed by Feoli & Mele (2005), who suggested a relation between the black hole (BH) mass and the kinetic energy of elliptical galaxies. Then, these authors extended the study of the relation versus also to lenticular and spiral galaxies (Feoli & Mele, 2007), enlarging their sample to a total of 29 galaxies, and finding that it has a scatter smaller than the most famous relation. Here, is the bulge mass of the galaxies, where bulge as usual refers to either the hot, spheroidal component (no dark halo or disk contribution) of a spiral/lenticular galaxy or to a full elliptical galaxy (Aller & Richstone, 2007; Cattaneo et al., 2009). In particular, for late-type galaxies, is the mass enclosed within a sphere of radius fixed from the surface-brightness profile. As an example, Aller & Richstone (2007) consider that is “the best substitute for the bulge mass”, with being the effective radius of a galaxy.
Actually, the main problem is that almost all the above-quoted relations are very tight, so it is very difficult to find, by studying the scatter of each one of them, the “most fundamental one” (Tremaine et al., 2002; Novak et al., 2006; Gultekin et al., 2009b). Without definitely solving this hard problem, the attention of an increasing number of scientists is now focused on the law in order to study the behavior of some peculiar subsets of galaxies. This led to discover that the line of the best fit of that relationship is different for barred galaxies with respect to the barless ones (Graham, 2008). The same occurs for bulges and pseudo-bulges (Hu, 2008; Gadotti & Kauffmann, 2009), core or coreless (Hu, 2008), active or quiescent (Barth et al., 2005; Wyithe, 2006a, b; Zhang et al., 2008; Greene & Ho, 2006).
At the same time, from the theoretical point of view, a lot of interesting (analytical and semianalytical) models were constructed to explain the experimental results (see, for example, Haehnelt & Kauffmann (2000); Burkert & Silk (2001); Wyithe & Loeb (2002, 2003); Dokuchaev & Eroshenko (2003); Volonteri et al. (2003); Miller et al. (2006); Croton et al. (2006); De Lucia & Baizot (2007)). It is well known that a useful method to obtain theoretical predictions, which can be compared with the correlations derived from experimental data, is based on numerical simulations. Hopkins et al. (2007) examined the origin and the evolution of the correlations between the properties of SMBHs and their host galaxies using hydrodynamical simulations of major galaxy mergers, including the effects of gas dissipation, cooling, star formation, and BH accretion and feedback. Their simulations suggest the existence of a SMBH fundamental plane, analogous to the fundamental plane of elliptical galaxies. The best relation that they found (the one with the lowest scatter) is
| (1) |
where is the galaxy stellar mass in units , and is the bulge velocity dispersion in units of km sec-1. These authors also show the main role played by the kinetic energy of random motions first proposed by Feoli & Mele (2005). In particular, they say: “we therefore naively expect that the BH mass should scale with ”, and declare that the correlation between the BH mass and the “is in some sense more basic then the correlation between the BH mass and or ”. In other words, their fundamental plane in BH mass can be well represented as a “tilted” correlation between BH mass and the kinetic energy of the random motions in the host galaxies (see Figure 10 of Hopkins et al. (2007)). Another clue is the ratio between the coefficients in Equation (1) multiplying the and which is very close to 0.5. This is also remarked by Marulli et al. (2008), who modeled the cosmological co-evolution of galaxies and their central SMBHs within a semianalytical framework. Their model matches well enough the SMBH fundamental plane relation derived by Hopkins et al. (2007), and their conclusion is identical: the SMBH mass does not simply scale with the star formation (stellar mass) or the velocity dispersion of the host galaxy.
The results of Hopkins et al. (2007) and Marulli et al. (2008) give a strong evidence that galaxy spheroids and SMBHs do not form and evolve independently and support the approach of Feoli & Mele (2005, 2007), who pointed to the relationship between the masses of the SMBHs and the kinetic energy of random motions in their host galaxies. The consequences for the theoretical models of SMBH growth and evolution are non-trivial.
In the present paper we want to extend the previous analysis of Feoli & Mele (2005, 2007) (hereafter, Paper I and Paper II) to a new set of 64 galaxies, almost all extracted by the catalogue of Graham (2008). The main aim is to probe if the relation is really a helpful instrument to study the evolution of the galaxies, that is if it can play the same role as the Hertzsprung -Russell (H -R) diagram in the description of the evolution phases of stars. We will see that different morphological types of galaxies occupy different positions in the plane, reflecting their age and intrinsic features. Finally, we want to confirm that the linear correlation coefficient, the intrinsic scatter, and the of our relationship are better than the corresponding values for the or the law. Our paper is structured as follows. In § 2 we define the samples used in our statistics. In § 3 we explain our results and, finally, in § 4 we draw our conclusions.
2 The samples
In order to have a homogeneous set of data, we have considered as the main reference for the masses of SMBHs and the velocity dispersions of the galaxies the catalogue published by Graham (2008). Alternative values (almost compatible within uncertainties) can be found for instance in Hu (2008) or in the more recent paper of Gultekin et al. (2009b). Our choice involves the values of the central velocity dispersions , in contrast with our two previous papers where we used the effective dispersion velocity . However, as already noted by Novak et al. (2006), the two ways of measuring the velocity dispersion does not generate profound differences. This is also supported by the study of Hu (2008), who compared the effective dispersion with the central one , finding that the differences are much smaller than their measurement errors. Also Gultekin et al. (2009b) compared to finding no systematic bias to high or low values. We also remark the fact that in our previous papers the data were extracted only by single sources: in Paper I all the values of the galaxies masses have been taken from Curir et al. (1993), the velocity dispersions from Busarello et al. (1992), and the SMBH masses from Tremaine et al. (2002); in Paper II the three sets of data have been taken from Häring & Rix (2004). Here, due to the enlargement of the sample, a homogeneous choice is no more possible and we are forced to build up a sample of data from various catalogues – essentially those of Graham (2008), Häring & Rix (2004) and Cappellari et al. (2006) – and single papers. A clear limit of a collection of data of this kind is, of course, related to the many different techniques utilized to estimate the masses of the bulges (dynamical or virial masses, Schwarzschild models, Jeans equation, etc.; see Appendix B for a more comprehensive discussion), and of the SMBHs (gas or stellar kinematics, water maser, proper motions, etc.).
In this paper, we consider two samples of galaxies. The first sample (sample A) is composed by 49 galaxies included in the table 1 of Graham (2008). Actually, his catalogue is formed by 50 galaxies that are considered to have reasonable measurements of their SMBH masses. We exclude the galaxy IC2560, since a reliable value for its bulge mass is not available (Ishihara et al., 2001; Schulz & Henkel, 2003). In several cases we would have liked to substitute some data of the Graham catalogue with other measures which are less uncertain or simply more recent (like that of Gultekin et al. 2009b), but we did not do so in order to avoid the risk that the tightness of our relation might depend on a suitable choice of the data. For example, we have used for the mass of SMBH in the Milky Way the value cited by Graham even if we know that an update value is now available (Gillessen et al., 2009), and we have included in the sample also the elliptical NGC221, which we would have liked to exclude from the fit as already done in Papers I and II. Starting from the Graham’s catalogue we have fixed the total number and the names of galaxies, their velocity dispersions, the SMBH masses, and morphological types. In this way, only the galaxy mass remains as a free parameter but our choice was anyway restricted by using the data published by Häring & Rix (2004) and Cappellari et al. (2006).
The second sample (sample B) is composed by the galaxies of sample A plus other 15 galaxies whose parameters have been taken from table 2 of Graham (2008) and from other papers. Of course, this enlarged sample does not have the aim to include all the galaxies with a measured BH mass or with an upper limit on its value. Sixty-four galaxies are listed in Table A HR-like diagram for galaxies: the versus relation and compose sample B, whereas only the first 49 galaxies are included in sample A.
Concerning the errors in the measures, we adopt the same strategy as in Paper II. Following Häring & Rix (2004), we consider that the error for the bulge mass is 0.18 dex in for all the galaxies, while the relative error on the velocity dispersions is .
3 Results
The relation between the mass of the SMBHs and the kinetic energy of random motions of the corresponding host galaxies has been presented in Papers I and II in the form
| (2) |
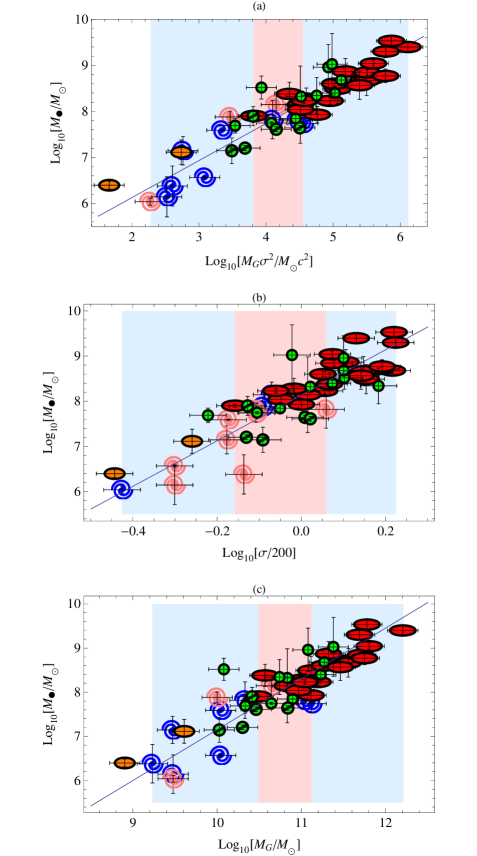
Thus, this relation can be used to predict the values of in other galaxies once we know their mass and velocity dispersion. In order to minimize the scatter in the quantity to be predicted, we have to perform an ordinary least-squares regression of on for the galaxies in Table A HR-like diagram for galaxies: the versus relation, of which we already know both the quantities. In Table 2, we compare the fits of our relationship for the two samples and the corresponding fits for and laws. As in Paper II (see also Graham & Driver (2007)), these fits were obtained taking into account the error bars in both variables and using the routine FITEXY (Press et al., 1992) for a relation , by minimizing the (see Appendix A). Comparing the results of the three laws, we notice that the , the intrinsic dispersion (i.e., dispersion due to the galaxies themselves rather than to measurement errors), and the Pearson linear correlation coefficient of our relationship are better than the other ones (Table 2). This is also evident by the comparison of Figure 1a, 1b and 1c, where the three relations are reported in log-log plots (we associated a particular marker to each galaxy according with its morphological type). It is visually clear that the galaxies (especially the spirals) are more spread in the case of the or the relations, than in the law. This result is also supported by the analysis of Gadotti & Kauffmann (2009) who found that elliptical, classical bulges and pseudo-bulges follow different relations between their stellar masses and velocity dispersions.
Comparing the results in Table 2 with the corresponding ones in table 3 of Paper II, we observe that, by enlarging the sample, the correlation coefficient of our relationship increases, showing the robustness of our idea. Actually, if the existence of the correlation is not a novelty, since it has already been found by Feoli & Mele (2005), the increase of the correlation coefficients with the enlarging of the sample is a result that had not at all been taken for granted.
As already observed by Novak et al. (2006), the question “which relation is better than the others?” is extremely sensitive to inaccurate estimates of the measurement errors. So, the result that our is better than the and the laws can be caused by an overestimation of the error on the galaxy masses. In order to avoid a similar misleading result, we have checked what happens using a standard least squared fitting, assuming that errors in the kinetic energy are zero and that errors in the are the same for each galaxy. The results are reported in Table 3 and show that the scatter of our relation is better than the and the laws even in this extreme case. Furthermore, the slope of the line of best fit is the same, inside the errors, as the one of Hopkins et al. (2007) in Equation (1).
We note also that the slope of the law depends on the errors and on the fitting methods used, more than the other relations do. While the values in Table 3 are close to the estimates of Tremaine et al. (2002) and Gultekin et al. (2009b) (even if they have been obtained with a different sample), the values in Table 2 are closer to the ones obtained by Graham (2008) (he found and ) with the same sample but with the Akritas & Bershadi (1996) method.
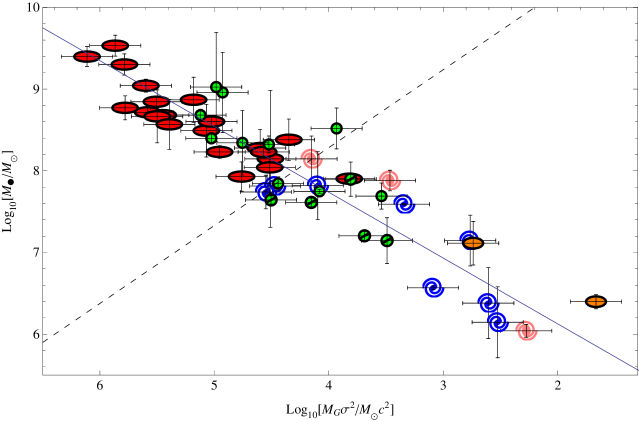
A surprising result is shown in Figure 2, where we performed a log-log plot of the energy stored by the SMBH, , as a function of the bulge kinetic energy of random motions, both normalized by the rest energy of the Sun, . Given the line of best fit (solid line) and a sort of border line (dashed line) that divides the diagram in two parts, it is evident that:
-
1.
almost all the elliptical galaxies (except NGC3377) are in the higher part of the diagram (over the dashed line),
-
2.
the lenticular galaxies are located in the middle-upper part of the diagram,
-
3.
the barred lenticular galaxies are located in the middle part of the diagram (but under the dashed line),
-
4.
all the spirals are in the middle-lower and in the lower parts of the diagram (under the dashed line),
-
5.
in the lower part of the diagram we find also two dwarf elliptical galaxies: NGC221 and NGC4486A.
In analogy with the H-R diagram for stars, each morphological type of galaxy occupies a different area in the plane. This effect is in part due to the well known fact that and (also , even if with a lot of exceptions) generally increase with the morphological type, but it is remarkable and not granted that they simultaneously increase just in the right way to produce the effect and a law with a minimal scatter. Compared with the other two relations, this clear trend can be lightly recognized also in Figure 1c, but it is not clear in Figure 1b. For example, the ellipticals in Figure 1a are more separated from the spirals with respect to Figures 1b or 1c. This can be quantified calculating the width of the transition area (light red colored), in which the elliptical and the spiral galaxies are mixed together, with respect to the entire area (light blue colored) occupied by all galaxies (we exclude the dwarf ellipticals). In Figure 1a, the red zone is only the of blue area, whereas it is and in Figure 1b and 1c, respectively.
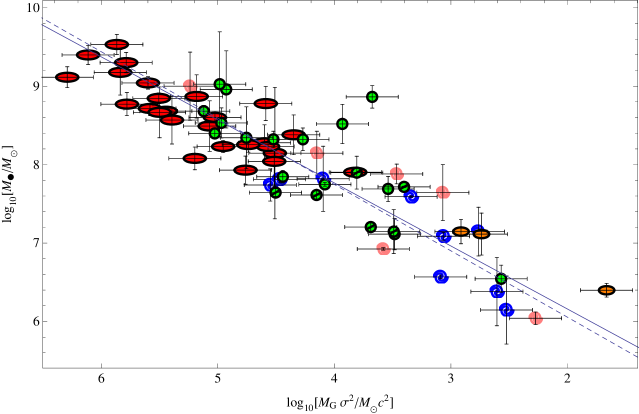
The general trend observed in Figure 2 is respected in Figure 3 for the galaxies of sample B, even if two lenticular galaxies appear in the lower part of the diagram and a spiral galaxy in the upper part. The latter is the famous Sombrero galaxy (NGC4594), one of the largest galaxies in the nearby Virgo Cluster, classified as a lenticular by Magorrian et al. (1998). It is well known that it has a bright nucleus and an unusually large classical bulge, testified by a relatively large number of globular clusters. We know that the classical bulges are believed to be generated by mergers and are common in early type galaxies but become progressively rare toward later types. They share some structural, dynamical, and population properties with the lower-luminosity ellipticals (Freeman, 2007). Actually, NGC4594 is surrounded by a halo of stars, dust, and gas that indicate it may actually be described as an elliptical galaxy that contains a more robust interior configuration. Therefore, its presence in the upper part of the diagram is not so improper. Later type galaxies like the Milky Way mostly have small boxy bulges and are all in the lower part of the diagram. On the other hand, both a classical bulge and an inner boxy bulge are present in NGC224 (Andromeda galaxy, M31) (Athanassoula & Beaton, 2006; Beaton et al., 2007), which is located just in the middle region.
Both in Figure 2 and 3, the elliptical galaxies are all clustered very near the line of best fit. Conversely, the galaxies of the other morphological types look slightly more scattered. This is particularly true for the lenticular galaxies in the middle-upper part of the diagram. Among them, the galaxy NGC4342 is located quite far from the best-fitting line. As already noted by Cretton & van den Bosch (1999), NGC4342 is one of the galaxies with the highest SMBH mass to bulge mass ratio. The consequent hypothesis that we are in the presence of a galaxy in a particular evolutionary state is also supported by the presence of both an outer disk and a stellar nuclear disk (van den Bosch & Jaffe, 1997). Instead, the position of the lenticular galaxy NGC7457 in the lower zone of the diagram is due to its SMBH which is one of the least-massive BHs yet detected in the core of a galaxy, roughly the same mass as the BH at the center of our Galaxy. Equally, the boxy-bulge lenticular NGC7332 is located in the middle-lower region of Figure 2. Going on, the peculiar galaxy NGC5128 (Centaurus A) appears in the middle of the diagram, but still quite far from the other lenticulars. The strange morphology of Centaurus A is generally recognized as the result of a merger of two smaller galaxies. In this way, it is possible to explain a bulge comprised mainly of evolved red stars and a dusty disk, which has been the site of recent star formation (Israel, 1998).
Finally, we note the presence of the intermediate-size elliptical NGC3377 in the center of the graphic in Figure 2, and three dwarf elliptical galaxies in the lower part. Two of them are NGC4742 and NGC4486A, both belonging to the Virgo Cluster of Galaxies, whereas the small NGC221 (M32) is a satellite of M31. Continuing the analogies with the H-R diagram, we can look at this area as reserved to the dwarf ellipticals, in the same manner as the region occupied by the white dwarfs in a classical color-magnitude diagram. If the three dwarf ellipticals do not really belong to the “principal sequence”, we can exclude them from the fit. In this case, the slope and the normalization in our relationship for the reduced sample of 61 galaxies are and , respectively (the dashed line in Figure 3). Furthermore, comparing again the and the of our relation with for instance the corresponding and for the law, we find an increase of the gap between the two relations.
Also remarkable is the fact that all the barred galaxies (lenticulars and spirals) are located only in the lower/middle-lower part of the diagram (under the dashed line of Figure 2).
We also study a possible correlation between the activity (Seyfert, Liner, etc.) of each galaxy with its position on the diagram, but we did not note any particular trend.
4 Discussion
In this paper, we have investigated the relation between the mass of the SMBHs and the kinetic energy of the random motion of the corresponding galaxies. This relation has been tested on a homogeneous sample of 49 galaxies and then on a more enlarged sample of 64 ones. As shown in Table 2, the statistical analysis confirms the result of our two previous papers, that is the proposed relation works well and better than the most common law or the one. Furthermore, the main result that we report consists in the particular positions of the galaxies in the plane, which resembles the H-R diagram for the stars. Other analogies also exist between the two diagrams. The H-R diagram connects the energy radiated (per unit time) by the nucleus of a star with its surface temperature. In the same way, our diagram connects a property of the inner nucleus of a galaxy, the energy stored by the SMBH, , with a property of the external surface of its bulge, i.e., the kinetic energy of random motions. This energy is related just with the temperature of the stellar system. In fact, let us consider a spherically symmetric distribution of stars with density , whose dynamical state is described by a distribution function of the form
| (3) |
where is the binding energy, and is the relative gravitational potential (Binney & Tremaine, 1987). Now, it is well known that the structure of a collisionless system of stars, whose density in the phase space is given by Equation (3), is identical to the structure of an isothermal self-gravitating sphere of gas, if we set
| (4) |
with being the total mass of the system, the number of objects contained in the system, the Boltzmann’s constant, and the temperature of the system. Since a stellar bulge can be considered, with a good approximation, similar to a spherically symmetric system, its kinetic energy of the random motions gives an indication of the temperature of the galaxy bulge.
On the other hand, since the SMBH at the center of galaxies can only increase its mass, the stored energy is directly connected with the initial density of the system and its evolutionary state. So, the stored energy of central SMBH will guide the galaxy along the evolutionary process, and, in that sense, an accretion of the SMBH, bound up with the flow of time, will imply a migration of the galaxy position from the lower-right part of the diagram to the upper left. This migration does not involve a brutal transformation of a spiral galaxy in an elliptical one but, since we consider just the mass of the bulge in our relation, we suppose that the spheroidal components of the spirals increase their size becoming similar to ellipticals, as it happened for the Sombrero galaxy discussed in the previous section.
Appendix A Appendix
The formula used in this paper to estimate the maximal errors in the functions F of the parameters is
| (A1) |
The reduced , used in Table 2, is defined as
| (A2) |
for a relation of the form , where is the number of galaxies in the sample. The internal scatter in Table 2 is calculated for fixed values of and imposing that
| (A3) |
Following Tremaine et al. (2002), the internal scatter can be computed also replacing the error with before the fitting procedure, and then adjusting and refitting until the is equal to 1. This approach affects the values of the slope and the normalization of the best-fitting relations. We reported them in Table 4 together with the values of for the galaxies of sample A.
Furthermore, the used in Table 3, is defined as
| (A4) |
Finally, the Pearson linear correlation coefficient is
| (A5) |
Appendix B Appendix
There are several methods to estimate the mass of a galaxy. Some of them are based on the virial theorem, other on the Jeans equation or on self-consistent models. When we are interested in the mass of a whole galaxy, then it is possible to use the virial theorem in its scalar form and, knowing the rotation velocity and velocity dispersion, the corresponding virial mass can be derived (Busarello et al., 1990). This approach often reduces to calculate the dynamical mass
| (B1) |
Instead, the Jeans equation is particularly useful to calculate the mass of late type galaxies, where we must take into account only the spheroidal component. If one wants to study only the part of a galaxy inside a radius , the system is not completely isolated and the effect of the matter at a radius has to be considered as an unknown external pressure (Chandrasekhar, 1969) (this term and the rotation velocity are often neglected in the case of elliptical galaxies). In order to overcome this problem, it is convenient to compute the masses of galaxies starting from the Jeans equation that describes the equilibrium of a spheroidally symmetric system having eccentricity and an isotropic velocity dispersion tensor:
| (B2) |
where is the radius in the equatorial () plane, is the (unknown) spatial density, and are the one–dimensional velocity dispersion and rotation velocity respectively (Binney & Tremaine, 1987). The solution of Equation (B2) can be written in the form , where is the luminosity density. For elliptical galaxies the approach followed for example by Busarello & Longo (1992) is to assume that the luminosity distribution corresponds to the spatial deprojection of the law. A simple analytical approximation for the deprojection of the law has been derived by Mellier & Mathez (1987):
| (B3) |
where and . Substituting this solution together with and (deprojected from the experimental data) in Equation (B2), an expression of as a function of can be obtained. Computing the value of for each object in the considered sample of galaxies at 10 different radii, the residuals with respect to its mean value turn out to be very small (and will be used to estimate the error ), and show no systematic trend with the radius, thus supporting the hypothesis that at least in the inner regions (Busarello & Longo, 1992). So, the final result for the mass density is . Changing the luminosity distribution, this method can be applied also to late type galaxies. A similar approach was followed and well explained in their paper by Häring & Rix (2004).
When the galaxy sample is very large and various, it is very difficult that all the masses of the galaxies are calculated in the same manner. For the sample in Table A HR-like diagram for galaxies: the versus relation, the masses of most of the galaxies have been estimated with the procedure of Häring & Rix (2004), a small part with the Schwarzschild model (Cappellari et al., 2006), and only in a few cases using the dynamical mass formula.
References
- Aller & Richstone (2007) Aller, M. C., & Richstone, D. O. 2007, ApJ, 665, 120
- Akritas & Bershadi (1996) Akritas, M. G., & Bershadi, M. A. 1996, ApJ, 470, 706
- Athanassoula & Beaton (2006) Athanassoula, E., & Beaton, R. L. 2006, MNRAS, 370, 1499
- Atkinson et al. (2005) Atkinson, J.H., Kazeminejad, B., Gaborit, V., et al. MNRAS, 359, 504
- Bacon et al. (1985) Bacon, R., Monnet, G., & Simien, F. 1985, A&A, 152, 315
- Barth et al. (2005) Barth, A. J., Greene, J. E., & Ho, L. C. 2005, ApJ, 619, L151
- Batcheldor et al. (2005) Batcheldor, D., Axon, D., Merritt, D., et al. 2005, ApJS, 160, 76
- Beaton et al. (2007) Beaton, R., Majewski, S., Patterson, R., et al. 2007, ApJ, 658, L91
- Bekki et al. (2003) Bekki, K., Harris, W. E., & Harris, G. L. H., et al. 2003, MNRAS, 338, 587
- Binney & Tremaine (1987) Binney, J., & Tremaine, S. 1987, Galactic Dynamics (Princeton NJ, Princeton Univ. Press)
- Burkert & Silk (2001) Burkert, A. & Silk, J. 2001, ApJ, 554, L151
- Busarello et al. (1990) Busarello, G., Longo, G., & Feoli, A. 1990, Nuovo Cimento B, 105, 1069
- Busarello et al. (1992) Busarello, G., Longo, G. & Feoli, A. 1992, A&A, 262, 52
- Busarello & Longo (1992) Busarello, G., & Longo, G. 1992, in Morphological and Physical Classification of Galaxies, ed. G.Longo et al. (Kluwer Academic Publishers), 423
- Cappellari et al. (2006) Cappellari, M., Bacon, R., Bureau, M., et al. 2006, MNRAS, 366, 1126
- Cappellari (2009) Cappellari, M. 2009, private communication
- Cao & Jiang (2002) Cao, X. & Jiang, D. R. 2002, MNRAS, 331, 111
- Cattaneo et al. (2009) Cattaneo, A., Faber, S. M., Binney, J., et al. 2009, Nature, 460, 213
- Chandrasekhar (1969) Chandrasekhar, S. 1969, Ellipsoidal Figures of Equilibrium (New Haven, CT: Yale Univ. Press)
- Cretton & van den Bosch (1999) Cretton, N., van den Bosch, F. C. 1999, in ASP Conf. Ser. 182, Evidence for a Massive Black Hole in the S0 Galaxy NGC 4342, ed. by D. R. Merritt, D. R., Valluri, M., & Sellwood, J. A. (San Francisco, CA: ASP), 41
- Croton et al. (2006) Croton, D. J., Springel, V., White, S. D. M., et al. 2006, MNRAS, 365, 11
- Curir et al. (1993) Curir, A., De Felice, F., Busarello, G., & Longo, G. 1993, Astrophys. Lett. Commun., 28, 323
- Czerny et al. (2001) Czerny, B., Nikołajuk, M., Piasecki, M., & Kuraszkiewicz, J. 2001, MNRAS, 325, 865
- Dalla Bontà et al. (2007) Dalla Bontà, E., Ferrarese, L., Corsini, E. M., et al. 2007, Mem. Soc. Astron. Ital., 78, 745
- De Francesco et al. (2006) De Francesco, G., Capetti, A., & Marconi, A. 2006, A&A, 460, 439
- De Francesco et al. (2008) De Francesco, G., Capetti, A., & Marconi, A. 2008, A&A, 479, 355
- De Lucia & Baizot (2007) De Lucia, G., & Blaizot, J. 2007, MNRAS, 375, 2
- Dokuchaev & Eroshenko (2003) Dokuchaev, V. I. & Eroshenko, Yu. N. 2003, Astron. Astrophys. Trans.,, 22, 727
- Feoli & Mele (2005) Feoli, A. & Mele, D. 2005, Int. J. Mod. Phys. D, 14, 1861
- Feoli & Mele (2007) Feoli, A. & Mele, D. 2007, Int. J. Mod. Phys. D, 16, 1261
- Ferrarese & Merritt (2000) Ferrarese, L., & Merritt, D. 2000, ApJ, 539, L9
- Ferrarese (2002) Ferrarese, L. 2002, ApJ, 578, 90
- Freeman (2007) Freeman, K. C. 2007, in IAU Symp. 245, Formation and Evolution of Galaxy Bulges, ed. M. Bureau, E. Athanassoula, B. & Barbuy (Cambridge: Cambridge Univ. Press), 3
- Gadotti & Kauffmann (2009) Gadotti, D. A., & Kauffmann, G. 2009, MNRAS, in press (arXiv:0811.1219)
- Gebhardt et al. (2000) Gebhardt, K., Bender, R., Bower, G., et al. 2000, ApJ, 539, 13
- Gebhardt et al. (2003) Gebhardt, K., Richstone, D., Tremaine, S., et al. 2003, ApJ, 583, 92
- Gillessen et al. (2009) Gillessen, S., Eisenhauer, F., Trippe, S., et al. 2009, ApJ, 692, 1075
- Genzel et al. (1995) Genzel, R., Weitzel, L., Tacconi-Garman, L. E., et al. 1995, ApJ, 444, 129
- Graham et al. (2001) Graham, A.W., Erwin, P., Caon, N., & Trujillo, I. 2001, ApJ, 563, L11
- Graham & Driver (2001) Graham, A.W., & Driver, S. P. 2005, PASA, 22(2), 118
- Graham & Driver (2007) Graham, A. W., & Driver, S. P. 2007, ApJ, 655, 77
- Graham (2008) Graham, A. W. 2008, PASA, 25, 167
- Greene & Ho (2006) Greene, J. E. & Ho, L. C. 2006, ApJ, 641, L21
- Gultekin et al. (2009a) Gultekin, K., Richstone, D. O., Gebhardt, K., et al. 2009a, ApJ, 695, 1577
- Gultekin et al. (2009b) Gultekin, K., Richstone, D. O., Gebhardt, K., et al. 2009b, ApJ, 698, 198
- Gultekin et al. (2009c) Gultekin, K., Cackette, E. M., Miller, J. M., et al. 2009c, ApJ, submitted (arXiv0906.3285)
- Haehnelt & Kauffmann (2000) Haehnelt, M. G. & Kauffmann, G. 2000, MNRAS, 318, L35
- Häring & Rix (2004) Häring, N., & Rix, H. 2004, ApJ, 604, L89
- Hicks & Malkan (2008) Hicks, E. K. S., & Malkan, M. A. 2008, ApJS, 174, 31
- Hitschfeld et al. (2008) Hitschfeld, M., Aravena, M., Kramer, C., et al. 2008, A&A, 479, 75
- Houghton et al. (2006) Houghton, R. C. W., Magorrian, J., Sarzi, M., et al. 2006, MNRAS, 367, 2
- Hopkins et al. (2007) Hopkins, P. F., Hernquist, L., Cox, T. J., et al. 2007, ApJ, 669, 45
- Hu (2008) Hu, J. 2008, MNRAS, 386, 2242
- Ishihara et al. (2001) Ishihara, Y., Nakai, N., Iyomoto, N., et al. 2001, PASJ, 53, 215
- Israel (2009) Israel, F. P. 2009, A&A, 493, 525
- Israel (1998) Israel, F. P. 1998, A&ARv, 8, 237
- Kisaka et al. (2008) Kisaka, S., Kojima, Y., & Otani, Y. 2008, MNRAS, 390, 814
- Koda et al. (2002) Koda, J., Sofue, Y., Kohno, K., et al. 2002, ApJ, 573, 105
- Kormendy & Richstone (1995) Kormendy, J., & Richstone, D. 1995, ARA&A, 33, 581
- Kormendy & Bender (2009) Kormendy, J., & Bender, R. 2009, ApJ, 691, L142
- Laor (2001) Laor, A., 2001, ApJ, 553, 677
- Lauer et al. (2007) Lauer, T. R., Faber, S. M., & Richstone, D. 2007, ApJ, 662, 808
- Magorrian et al. (1998) Magorrian, J., Tremaine, S., Richstone, D., et al. 1998, AJ, 115, 2285
- Marconi et al. (2001) Marconi, A., Axon, D., Atkinson, J., et al. 2001, in Proc. IAU Symp. 205, Galaxies and their Constituents at the Highest Angular Resolutions, ed. R. T. Schilizzi, S. N. Vogel, F. Paresce, & M. S. Elvis, (San Francisco, CA: ASP), 58
- Marconi & Hunt (2003) Marconi, A., & Hunt, L. K. 2003, ApJ, 589, L21
- Marulli et al. (2008) Marulli, F., Bonoli, S., & Branchini, E. 2008, MNRAS, 385, 1846
- Mellier & Mathez (1987) Mellier, Y., & Mathez, G. 1987, A&A, 175, 1
- Merritt & Ferrarese (2001) Merritt, D., & Ferrarese, L. 2001, in ASP Conf. Proc. 249, The Central Kiloparsec of Starbursts and AGN: The La Palma Connection, ed. J. H. Knapen, J. E. Beckman, I. Shlosman, & T. J. Mahoney, (San Francisco, CA: ASP), 335
- Miller et al. (2006) Miller, L., Percival, W. J., Croom, S. M., Babić, A. 2006, A&A, 459, 43
- Novak et al. (2006) Novak, G. S., Faber, S. M. & Dekel, A. 2006, ApJ, 637, 96
- Nowak et al. (2007) Nowak, N., Saglia, R. P., Thomas, J., et al., MNRAS, 379, 909 (2007)
- Peterson et al. (2004) Peterson, B. M., Ferrarese, L., Gilbert, K. M., et al. 2004, ApJ, 613, 682
- Press et al. (1992) Press, W. H., Teukolsky, S. A., Vetterling, W. T. & Flannery, B. P. 1992, Numerical Recipes (2nd ed.; Cambridge: Cambridge Univ. Press)
- Richstone et al. (1998) Richstone, D., Ajhar, E. A., Bender, R., et al. 1998, Nature, 395, A14
- Riffeser et al. (2008) Riffeser, A., Seitz, S., & Bender, R. 2008, ApJ, 684, 1093
- Sarzi et al. (2001) Sarzi, M., Rix., H.-W., Shields, J. C., et al. 2001, ApJ, 550, 65
- Soker (2009) Soker, N. 2009, MNRAS, 398, L41
- Schulz & Henkel (2003) Schulz, H., & Henkel, C. 2003, A&A, 400, 41
- Sofue (1998) Sofue, Y. 1998, PASJ, 50, 227
- Tremaine et al. (2002) Tremaine, S., Gebhardt, K., Bender, R., et al. 2002, ApJ, 574, 740
- van den Bosch & Jaffe (1997) van den Bosch, F. C., & Jaffe, W. 1997, in ASP Conf. Ser. 116, The Nature of Elliptical Galaxies, ed. M. Arnaboldi, G. S. Da Costa, P. & Saha, (San Francisco, CA: ASP), 142
- van der Marel (1999) van der Marel, R. P. 1999, in IAU Symp. 186, Galaxy Interactions at Low and High Redshift, ed. Sanders, D. B., & Barnes, J. (Dordrecht: Kluwer Academic Publishers), 333
- Volonteri et al. (2003) Volonteri, M., Haardt, F., & Madau, P. 2003, ApJ, 582, 559
- Wandel (1999) Wandel, A. 1999, ApJ, 519, L39
- Wandel (2002) Wandel, A. 2002, ApJ, 565, 762
- Wold et al. (2006) Wold, M., Lacy, M., Käufl, H. U., et al. 2006, A&A, 460, 449
- Wyithe & Loeb (2002) Wyithe, J. S. B., & Loeb, A. 2002, ApJ, 581, 886
- Wyithe & Loeb (2003) Wyithe, J. S. B., & Loeb, A. 2003, ApJ, 595, 614
- Wyithe (2006a) Wyithe, J. S. B. 2006a, MNRAS, 365, 1082
- Wyithe (2006b) Wyithe, J. S. B. 2006b, MNRAS, 371, 1536
- Zhang et al. (2008) Zhang, S.-Y., Bian, W.-H., Huang, K.-L. 2008, A&A, 488, 113
| Galaxy | Typeb | References | References | References | ||||
|---|---|---|---|---|---|---|---|---|
| (km/s) | () | () | () | |||||
| CygnusA | E | 270 | 1 | 1 | 2 | |||
| NGC221 | E2 | 72 | 1 | 1 | 3 | |||
| NGC821 | E6 | 200 | 1 | 1 | 3 | |||
| NGC1399 | E1 | 329 | 1 | 1 | 4 | |||
| NGC2974 | E4 | 227 | 1 | 1 | 5 | |||
| NGC3377 | E5 | 139 | 1 | 1 | 5 | |||
| NGC3379 | E1 | 207 | 1 | 1 | 3 | |||
| NGC3608 | E2 | 192 | 1 | 1 | 3 | |||
| NGC4261 | E2 | 309 | 1 | 1 | 3 | |||
| NGC4291 | E2 | 285 | 1 | 1 | 3 | |||
| NGC4374 | E1 | 281 | 1 | 1 | 3 | |||
| NGC4473 | E5 | 179 | 1 | 1 | 3 | |||
| NGC4486 | E0 | 332 | 1 | 1 | 3 | |||
| NGC4486A | E2 | 110 | 1 | 1 | 6 | |||
| NGC4621 | E5 | 225 | 1 | 1 | 5 | |||
| NGC4649 | E1 | 335 | 1 | 1 | 3 | |||
| NGC4697 | E4 | 174 | 1 | 1 | 3 | |||
| NGC5077 | E3 | 255 | 1 | 1 | 7 | |||
| NGC5813 | E1 | 239 | 1 | 1 | 5 | |||
| NGC5845 | E3 | 233 | 1 | 1 | 3 | |||
| NGC5846 | E0 | 237 | 1 | 1 | 5 | |||
| NGC6251 | E2 | 311 | 1 | 1 | 3 | |||
| NGC7052 | E4 | 277 | 1 | 1 | 3 | |||
| NGC3115 | S0 | 252 | 1 | 1 | 3 | |||
| NGC3245 | S0 | 210 | 1 | 1 | 3 | |||
| NGC3414 | S0 | 237 | 1 | 1 | 5 | |||
| NGC3998 | S0 | 305 | 1 | 1 | 8 | |||
| NGC4342 | S0 | 253 | 1 | 1 | 3 | |||
| NGC4459 | S0 | 178 | 1 | 1 | 5 | |||
| NGC4552 | S0 | 252 | 1 | 1 | 5 | |||
| NGC4564 | S0 | 157 | 1 | 1 | 3 | |||
| NGC5128 | S0 | 120 | 1 | 1 | 9 | |||
| NGC5252 | S0 | 190 | 1 | 1 | 2 | |||
| NGC1023 | SB0 | 204 | 1 | 1 | 3 | |||
| NGC2778 | SB0 | 162 | 1 | 1 | 10 | |||
| NGC2787 | SB0 | 210 | 1 | 1 | 11 | |||
| NGC3384 | SB0 | 148 | 1 | 1 | 3 | |||
| NGC4596 | SB0 | 149 | 1 | 1 | 2 | |||
| Circinus | S | 75 | 1 | 1 | 12 | |||
| NGC224 | SA | 170 | 1 | 1 | 13 | |||
| NGC3031 | SA | 162 | 1 | 1 | 14 | |||
| MW | SB | 100 | 1 | 1 | 3 | |||
| NGC1300 | SB | 229 | 1 | 1 | 15 | |||
| NGC3079 | SB | 146 | 1 | 1 | 16 | |||
| NGC3227 | SAB | 133 | 1 | 1 | 17 | |||
| NGC4151 | SAB | 156 | 1 | 1 | 18 | |||
| NGC4258 | SAB | 134 | 1 | 1 | 2 | |||
| NGC4945 | SB | 100 | 1 | 1 | 12 | |||
| NGC7582 | SB | 156 | 1 | 1 | 19 | |||
| IC1459 | E3 | 306 | 1 | 2 | 2 | |||
| IC4296 | E | 336 | 1 | 1 | 20 | |||
| NGC3607c | E | 229 | 21 | 21 | 21 | |||
| NGC4486B | E0 | 169 | 1 | 1 | 22 | |||
| NGC4742 | E4 | 109 | 1 | 1 | 3 | |||
| NGC5576c | E3 | 183 | 21 | 21 | 21 | |||
| NGC3585c | S0 | 213 | 21 | 21 | 21 | |||
| NGC4026c | S0 | 180 | 21 | 21 | 21 | |||
| NGC7332 | S0 | 135 | 1 | 1 | 3 | |||
| NGC7457 | S0 | 69 | 1 | 1 | 3 | |||
| NGC4203 | SB0 | 124 | 11 | 11 | 11 | |||
| NGC1068 | SA | 151 | 1 | 1 | 23 | |||
| NGC2748 | SA | 79 | 24 | 15 | 15 | |||
| NGC4594 | SA | 240 | 1 | 3 | 3 | |||
| NGC7469 | SAB | 152 | 25 | 25 | 26 |
References. — (1) Graham (2008); (2) Marconi & Hunt (2003); (3) Häring & Rix (2004); (4) Houghton et al. (2006); (5) Cappellari et al. (2006), Cappellari (2009); (6) Nowak et al. (2007); (7) De Francesco et al. (2008); (8) De Francesco et al. (2006); (9) Bekki et al. (2003); (10) Aller & Richstone (2007); (11) Sarzi et al. (2001); (12) Hitschfeld et al. (2008); (13) Riffeser et al. (2008); (14) Sofue (1998); (15) Atkinson et al. (2005); (16) Koda et al. (2002); (17) Wandel (2002); (18) Wandel (1999); (19) Wold et al. (2006); (20) Dalla Bontà et al. (2007); (21) Gultekin et al. (2009a); (22) Bacon et al. (1985); (23) Israel (2009); (24) Batcheldor et al. (2005); (25) Hicks & Malkan (2008); (26) Genzel et al. (1995).
Note. — aAdopting the same strategy as in Paper II, we consider that the error for the bulge mass is 0.18 dex in for all the galaxies, while the relative error on the velocity dispersions is . bGalaxy types are taken from Graham (2008) with the following exceptions: IC4296, NGC221, NGC821, NGC1399, NGC2974, NGC3379, NGC3607, NGC4374, NGC4486A, NGC4486B, NGC4621, NGC5077, NGC5813, NGC5846, NGC6251, which are taken from the NASA/IPAC Extragalactic database. cEffective dispersion is given rather than the central .
| Relation | Sample | ||||||
|---|---|---|---|---|---|---|---|
| (1) | (2) | (3) | (4) | (5) | (6) | (7) | (8) |
| A | 49 | 1.74 | 0.19 | 0.92 | |||
| A | 49 | 1.85 | 0.25 | 0.87 | |||
| A | 49 | 2.10 | 0.27 | 0.89 | |||
| B | 64 | 1.92 | 0.21 | 0.92 | |||
| B | 64 | 2.34 | 0.32 | 0.85 | |||
| B | 64 | 2.77 | 0.26 | 0.90 |
Note. — We report the used relation in Column 1, the sample in Column 2, and the corresponding number of galaxies in Column 3. By using the routine FITEXY, we find the best fit of the relationship . The results for and are in Columns 4 and 5 and the corresponding reduced in Column 6. The internal (intrinsic) scatter (Column 7) is estimated as that which yields a with respect to the given best-fitting relation (see also Appendix A). Finally, the linear correlation coefficient is shown in Column 8.
| Relation | Sample | ||||
|---|---|---|---|---|---|
| (1) | (2) | (3) | (4) | (5) | (6) |
| A | 49 | 0.10 | |||
| A | 49 | 0.16 | |||
| A | 49 | 0.15 | |||
| B | 64 | 0.11 | |||
| B | 64 | 0.19 | |||
| B | 64 | 0.14 |
Note. — We report the used relation in Column 1, the sample in Column 2, and the corresponding number of galaxies in Column 3. By using a standard least squared fitting and assuming that errors in the galaxy mass and velocity dispersion are zero and that errors in the are the same for each galaxy, we find the best fit of the relationship . The results for and are in Columns 4 and 5, respectively. The values of the are in Column 6.
| Relation | Sample | ||||
|---|---|---|---|---|---|
| (1) | (2) | (3) | (4) | (5) | (6) |
| A | 49 | 0.110 | |||
| A | 49 | 0.230 | |||
| A | 49 | 0.165 |
Note. — We report the used relation in Column 1, the sample in Column 2, and the corresponding number of galaxies in Column 3. The values of the internal scatter in Column 4 are calculated with the procedure explained in Appendix A. The corresponding values for the slope and the normalization are reported in Columns 5 and 6, respectively.