Radio and mid-infrared identification of BLAST source counterparts in the Chandra Deep Field South
Abstract
We have identified radio and/or mid-infrared counterparts to 198 out of 350 sources detected at over deg2 centered on the Chandra Deep Field South (CDFS) by the Balloon-borne Large Aperture Submillimeter Telescope (BLAST) at 250, 350 and 500 m. We have matched 114 of these counterparts to optical sources with previously derived photometric redshifts and fitted SEDs to the BLAST fluxes and fluxes at 70 and 160 m acquired with the Spitzer Space Telescope. In this way, we have constrained dust temperatures, total far-infrared/sub-millimeter luminosities and star formation rates for each source. Our findings show that on average, the BLAST sources lie at significantly lower redshifts and have significantly lower rest-frame dust temperatures compared to submm sources detected in surveys conducted at 850 m. We demonstrate that an apparent increase in dust temperature with redshift in our sample arises as a result of selection effects. Finally, we provide the full multi-wavelength catalog of BLAST sources contained within the complete deg2 survey area.
Subject headings:
Submillimeter - surveys - cosmology: observations - galaxies: high-redshift - infrared: galaxies1. Introduction
Excluding the cosmic microwave background, approximately half of the entire extragalactic background radiation is emitted at far infra-red (IR) and sub-millimeter (submm) wavelengths (e.g., Fixsen et al., 1998; Hauser & Dwek, 2001) peaking around m. However, relatively little is known about the sources responsible compared to the well explored optical Universe where studies have enjoyed a head-start of several decades. Combining this with significant recent advances in submm instrumentation, it is therefore not surprising that galaxy surveys are now turning to the submm in the search for a more complete understanding of the formation of structure in the Universe.
The first deep submm surveys (e.g. Smail et al., 1997; Hughes et al., 1998; Barger et al., 1998) revealed a population of highly energetic dust obscured sources. Several clues suggested links between these systems and local ellipticals such as their similar volume densities (Scott et al., 2002; Dunne, Eales & Edmunds, 2003) and clustering properties (e.g., Almaini et al., 2003; Blain et al., 2004) and their ability to rapidly form large stellar populations. Despite these early advances towards understanding the nature of the submm population, the small areal coverage common to the early surveys yielded a low number of sources, resulting in the usual limitations due to small number statistics and sampling variance. This motivated the largest and last of the surveys conducted using the Submillimeter Common User Bolometer Array (SCUBA; Holland et al., 1999), the SCUBA HAlf Degree Extragalactic Survey (SHADES; Mortier et al., 2005). SHADES detected a total of sources (down to ) at 850 m over an area of arcmin2 (Coppin et al., 2006).
Although the large homogeneous sample of submm sources detected by SHADES significantly enhanced previous samples, the survey still has three main deficits: 1) The areal coverage is small and therefore highly susceptible to sampling variance compared with optical surveys, 2) The SCUBA population appears to only represent a small fraction of the Universe’s obscured star formation (see for example Chapman et al., 2005; Coppin et al., 2006; Dye et al., 2007). This is perhaps not surprising given that the energy of the far-IR/submm background at 850 m is times less than at m where it peaks. 3) The SCUBA population seems to reside almost exclusively at redshifts , preventing proper investigation of the link between distant dusty galaxies and the local population.
This paper is concerned with a large new submm survey centered on the Chandra Deep Field South (CDFS) recently carried out by the Balloon-borne Large Aperture Submillimeter Telescope (BLAST; Devlin et al., 2004; Pascale et al., 2008; Devlin et al., 2009). The survey covers at each of the three BLAST wavelengths of 250, 350 and 500 m. This is a leap of nearly two orders of magnitude in area compared with SHADES and energetically much nearer the peak of the far-IR/submm background.
BLAST bridges the gap between the longest wavelength channels available to the Spitzer Space Telescope (Spitzer) at 24, 70 and 160 m and SCUBA at 850 m. As we show in this paper, BLAST is substantially more sensitive to galaxies at where SCUBA found very few sources yet maintains an overlap with SCUBA’s sensitivity to moderate redshifts. For example, a 10 mJy 850 m source at with a dust temperature of 30 K has a typical flux of 80 mJy at 350 m, well within the sensitivity levels reached by BLAST.
In order to derive scientific conclusions from the data in the same vein as for previous submm surveys, the first step is to identify counterparts to the sources detected by BLAST. Like all single dish submm observations made to date, the large beam size of BLAST precludes direct association with sources at optical to mid-IR wavelengths. A well proven procedure is to identify counterparts to submm sources using radio interferometry. At radio wavelengths, submm sources out to a redshift of can be readily detected. The typically low surface number density of radio detections results in a very low rate of chance alignments. In addition to radio counterparts, sources detected at 24 m by Spitzer also prove useful for this purpose for the same reasons, albeit with typically lower positional accuracy (e.g. Ivison et al., 2007; Dye et al., 2008).
The main objective of this paper is to provide radio and 24 m identifications of counterparts to the sources detected by BLAST in the CDFS. We have fitted spectral energy distributions (SEDs) to the three BLAST fluxes at 250, 350 and 500 m and fluxes obtained by Spitzer at 70 and 160 m. In this way, we have obtained best fit rest-frame dust temperatures, bolometric luminosities and star formation rates (SFRs). In Section 2 we describe the BLAST observations and the supporting multi-wavelength data used in our analyses. Section 3 outlines our methodology, in particular the procedure used for identifying counterparts in the radio and at 24 m. The results are presented in Section 4. Finally, Section 5 summarizes our findings and briefly discusses the implications of our results.
The multi-wavelength catalog of BLAST sources is given in the appendix in Table 5 and contains 350 sources.
Throughout this work, we have assumed the following cosmology: , , H70 km s-1.
2. Data
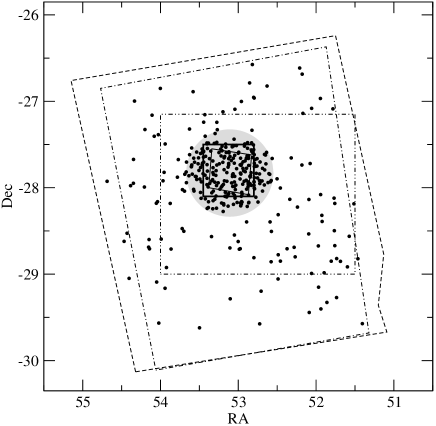
Figure 1 plots the geometry of the various datasets used in this paper. This section gives details of those datasets and a brief description of the BLAST dataset itself. We refer the reader to Pascale et al. (2008) for a more detailed description of the primary characteristics of BLAST and Truch et al. (2008, 2009) for information on calibration and data reduction.
2.1. BLAST Data
The 250, 350 and 500 m observations analyzed in this paper were acquired during the BLAST 2006 flight launched on the 21st of December from McMurdo Station, Antarctica (BLAST06). The data encompass the CDFS and cover 8.7 deg2 centered on (, ) with mean sensitivities of 180, 150 and 100 mJy/beam at 250, 350 and 500 m respectively. A deep region of 0.8 deg2 is located within this 8.7 deg2, centered on the southern field of the Great Observatories Origins Deep Survey (GOODS; Dickinson et al., 2003) at (, ). This deeper region, referred to hereafter as ’BLAST GOODS South Deep’ (BGS-Deep), reach mean sensitivities of 55, 45 and 30 mJy/beam at 250, 350 and 500 m respectively (Devlin et al., 2009). The area surrounding BGS-Deep is referred to hereafter as BGS-Wide.
The BLAST time series data in each of the three bands were reduced using a custom-made pipeline (Pascale et al., 2008). Periodic observations of VY CMa conducted throughout the flight provide an absolute calibration for the telescope gain with uncertainties of 10%, 12% and 13% at 250, 350 and 500 m respectively (although the calibration is highly correlated – see Truch et al., 2008). Signal and variance maps with pixels were generated using the maximum-likelihood map-making algorithm SANEPIC (Patanchon et al., 2008). In order to suppress residual large-scale noise, the SANEPIC maps were spatially filtered to whiten structure on scales larger than the telescope field of view (). A catalog of point sources with a significance of for each band was compiled using a source-finding algorithm which selects the peaks in a smoothed map produced by the inverse variance weighted convolution of the image with the telescope point spread function (Devlin et al., 2009).
The source lists were synthesized into a common catalog using a procedure which accounts for the significance and positional uncertainty of the counterparts in each band. The radius of the positional error circle, , for a submm galaxy in a catalog with signal to noise which has not been corrected for Eddington bias can be expressed as
| (1) |
for power-law counts of the form , where is the full width at half maximum (FWHM) of the telescope beam (Ivison et al., 2007). The BLAST06 telescope beam is best fit by Gaussians with a FWHM of 36 arcsec, 42 arcsec and 60 arcsec at 250, 350 and 500 m respectively (Pascale et al., 2008). Using this formula, error circles were calculated for each source in the individual catalogs assuming the slope of measured by Devlin et al. (2009). A minimum error circle of was imposed, equal to the pointing uncertainty of the maps.
The combined catalog is comprised of all sources with a significance in at least one band. Sources from the other bands were considered counterparts if they were located within twice the radius of their respective error circles added in quadrature. Positions of sources in the resulting combined catalog were computed by averaging all the positions, weighted by .
The catalog contains 350 sources in total as listed111The BLAST data used in this paper (including maps) are also available for download at http://blastexperiment.info in Table 5. The number of sources detected at by band is 178, 145 and 168 at 250, 350 and 500 m respectively. 235 of the sources are located within BGS-Deep. Out of these, the sources detected at by band is 121, 113 and 124 at 250, 350 and 500 m respectively.
2.2. Radio Data
We have used two different catalogs for our radio counterparts. The first contains sources detected in the 1.4GHz map observed by Miller et al. (2008) using the Very Large Array (VLA). The map covers an area of 0.33 deg2 centered on the GOODS region to an average rms sensitivity of Jy per beam. The published source catalog takes a very conservative detection threshold of . We therefore carried out our own source extraction on the map down to a lower detection threshold of . This results in a larger source surface number density of arcmin-2 compared to arcmin-2 in the originally published catalog. Although this increases the risk of introducing spurious sources, our Monte Carlo method of associating counterparts to the BLAST sources takes this into account.
For the second radio catalog, we used the shallower but wider 1.4GHz survey of (Norris et al., 2006) acquired using the Australia Telescope Compact Array. This survey covers a deg2 area () centered on (,). The rms sensitivity of the survey is 40 Jy per beam giving rise to a source number density of 0.05 arcmin-2.
We carried out our identification of radio counterparts to the submm sources separately on each catalog. When matching to sources in the wider Norris et al. catalog, we excluded the region covered by the deeper VLA data. We verified that all of the Norris et al. sources in this region were contained within the VLA data.
2.3. 24 m Data
Similar to the radio data, our list of 24 m Spitzer counterparts comprises two separate catalogs. The first is taken from Magnelli et al. (2009) as part of the Far-Infrared Deep Extragalactic Legacy Survey (FIDEL; Dickinson et al., 2007). The data cover 0.23 deg2 () centered on the GOODS region. The point source sensitivity of FIDEL is Jy giving a source surface number density of 12 arcmin-2.
The second 24 m Spitzer catalog was taken from the Spitzer Wide-area InfraRed Extragalactic survey (SWIRE; Lonsdale et al., 2004) third data release222See http://irsa.ipac.caltech.edu/data/SPITZER/SWIRE. The 24 m SWIRE data in the CDFS cover deg2 () centered on (,). The average point source sensitivity is Jy although only 24 m sources detected at are included in the catalog.
In the same manner as our identification of radio counterparts, we identified 24 m sources separately for both 24 m catalogs excluding the deeper FIDEL region when searching for SWIRE counterparts. We verified that all 24 m SWIRE sources are contained within the FIDEL data.
2.4. 70 & 160 m Spitzer Maps
In addition to the three BLAST fluxes, we also extracted flux from the SWIRE 70 and 160 m Spitzer maps to improve constraints on our SED fitting. Both maps cover a rectangular area of centered on the 24 m catalog (,). All bar five of the BLAST sources with identified radio and/or 24 m counterparts are located within these maps.
2.5. Photometric redshifts
For the purpose of fitting SEDs to the BLAST and Spitzer photometry, we matched identified counterparts to optical sources with previously estimated photometric redshifts. We used the two main photometric redshift catalogs publicly available in CDFS:
-
•
The photometric redshift catalog of Wolf et al. (2004) from COMBO-17 (Classifying Objects by Medium-Band Observations in 17 filters) covers an area of 0.25 deg2 () centered on GOODS. Redshifts are derived from optical photometry in five broad bands (, , , , ) and 12 interspersed medium bands. The surface number density of sources is 67 arcmin-2. Redshifts extend up to and have a median of .
-
•
The photometric redshift catalog of Rowan-Robinson et al. (2008) covers a total area of deg2 ( but with gaps) centered on (,). The surface number density of sources is arcmin-2. Redshifts are estimated from SWIRE photometry: The five broad optical bands u, g, r, i and z and the two IRAC channels 3.6 and 4.5 m. The median redshift is with 10% of galaxies at and 4% at .
3. Methodology
3.1. Identification procedure
To identify radio and 24 m counterparts, we applied the frequentist technique of Lilly et al. (1999) based on the method of Downes et al. (1986). The method searches for objects close to the submm source and estimates the probability of each object being a chance alignment using a Monte Carlo approach. We applied the approach to the BLAST multi-wavelength source list described in Section 2.1 in the following way:
-
1)
Select a random position within the area common to the BLAST and radio catalogs.
-
2)
Find the minimum of the quantity for each radio source within a separation cutoff of of the random position (see below for justification of this cutoff). Here, is the radial separation between the radio source and the random position and is the surface number density of radio sources brighter than the radio source.
-
3)
Repeat steps 1) and 2) for realizations to determine the distribution of for the radio sources.
-
4)
Repeat steps 1) - 3) with the 24 m catalog to determine the distribution of for the 24 m sources.
The distribution of , , then allows the probability to be computed from a value of a real potential counterpart :
| (2) |
Note that, in general, up to a critical surface number density, since a certain fraction of the randomly chosen positions will not contain any radio (or 24 m) sources within . Figure 2 shows the distributions obtained for radio and 24 m counterparts in the FIDEL region.
The most likely counterpart is that with the lowest value of . Introducing a threshold in gives a criterion for establishing BLAST sources without counterparts. In the analysis that follows later in this paper, we have only included counterparts with . Sources with radio and 24 m counterparts were included if either or both counterparts satisfy . Although not included in any analysis, we have also listed counterparts in the area outside the FIDEL region with . As we discuss in Section 4.1, this is justified on the basis that relaxing the threshold to 0.1 results in another 29 counterparts at the mere cost of including an expected two additional false counterparts.

3.1.1 Determination of the separation cutoff
Selection of the separation cutoff depends on several factors. Clearly a smaller cutoff gives rise to fewer counterparts, increasing the likelihood of missing a true counterpart. Conversely, a larger cutoff increases the risk of associating a very bright but unrelated counterpart (i.e., is small since is small even though is large). An added complication is that larger cutoffs increase the probability of overlapping positional error circles thereby complicating the matching process.
The separation cutoff should be a compromise between these factors. We have therefore selected our cutoff as the radius where the expected number of excluded true counterparts is equal to the expected number of false counterparts. The procedure we used to determine this is as follows:
-
•
Using a large separation cutoff (e.g., ), perform an initial ID analysis as outlined above to compute values of for all counterparts within the cutoff. Form the distribution of radial offsets of the primary counterparts (i.e., those counterparts with the lowest per BLAST source).
-
•
Compute the number of expected false IDs by summing over all primary counterparts. Repeat the ID analysis with decreasing values of the separation cutoff, computing the expected number of false IDs each time. This gives the false ID rate, i.e., the number of false IDs per interval separation as a function of the separation cutoff.
-
•
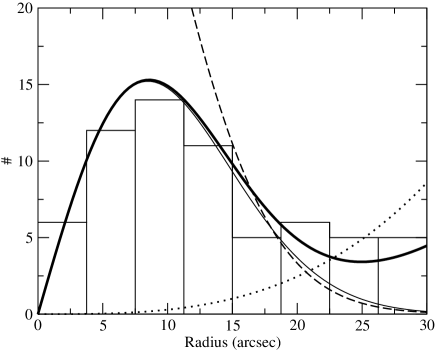
Subtract the false ID rate from the distribution of radial offsets determined in the first step. The result is the expected distribution of true counterparts which should have the form (e.g., Ivison et al., 2007). Fit this to derive and hence determine the number of true counterparts that would be excluded as a function of separation cutoff.
Figure 3 shows the distribution of radial offsets of the primary radio counterparts within of each BLAST source in the FIDEL region. The figure shows that the expected number of false counterparts is equal to the expected number of excluded true counterparts at a separation cutoff of . Repeating this analysis for the 24 m counterparts in the FIDEL region, we found an optimal separation cutoff of . Similarly, the procedure returns optimal separation cutoffs of and for the radio and 24 m counterparts in the region outside of FIDEL respectively. With this in mind, we chose a value of as the separation cutoff for the FIDEL region and for the region outside FIDEL. Whilst this is slightly conservative for the outer-FIDEL region, the fraction of real counterparts we would expect to exclude is low. Similarly, although this cutoff is slightly larger than the optimal value for the 24 m counterparts within the FIDEL region, the false ID rate is sufficiently low around to make a negligible increase in the number of expected false 24 m counterparts. Section 4.1 quantifies the resulting expected number of false IDs for each counterpart catalog and region.
Note that the distribution of radial offsets in Figure 3 indicates that 68% of radio counterparts are within an offset of . The position error of a BLAST source detected at 250 m from equation 1 is . These values are consistent once positional uncertainties in the radio catalog and pointing errors on both the BLAST and radio catalogs are accounted for.
3.2. Matching to the photometric catalogs
Prior to matching to the photometric redshift catalogs, the identified radio counterparts were position-matched to the 24 m counterparts. We used a separation tolerance of for this matching based on the 24 m data point spread function (PSF) of FWHM and the average radio data PSF of FWHM . In cases where a BLAST source has a radio and a 24 m counterpart that both satisfy the selection criteria but are separated from each other by more than , we selected the counterpart with the lowest value of .
All identified BLAST source counterparts were then position-matched to the photometric redshift catalogs. For BLAST sources with a radio and a 24 m counterpart, the average of the radio and 24 m co-ordinates were used in the matching (since the radio and 24 m PSFs are similar). We used the same positional tolerance of in matching up with the redshift catalogs. We found that in all cases where a counterpart is matched by both a COMBO-17 and SWIRE redshift (i.e., they are both within of the counterpart), the COMBO-17 and SWIRE sources are within of each other.
3.3. SED fitting
We determined 250, 350 and 500 m BLAST fluxes and the 70 and 160 m Spitzer fluxes for the BLAST sources with identified photometric redshifts by reading off the flux in the beam-convolved maps at the position of the radio/24 m counterpart. These fluxes were then fitted with a modified black body SED of the form , where is a normalization constant, B is the Planck function and was fixed333Allowing to vary in the minimization generally results in an improvement in of less than 1, implying that the data do not support the introduction of an extra parameter. This was also found to be true when a secondary dust component was added. at the value of 1.5.
In fitting the SEDs, we assumed a uniform prior for the temperature over 10 K50 K and fixed the redshift at the photometric redshift of the optical counterpart. In cases where a redshift exists from both COMBO-17 and the catalog of Rowan-Robinson et al. (2008), we selected the redshift that minimizes which was computed allowing for the BLAST data covariance (see Truch et al., 2008):
| (3) | |||||
where the subscripts and span the three BLAST bands and the subscript spans the 70 and 160 m Spitzer bands. In this equation, is the inverse of the BLAST data covariance matrix, is the error on the th Spitzer flux, is the flux measured in the th band and is the corresponding model flux computed by integrating the trial SED over the th band response function. The total far-IR/submm luminosities quoted in the results that follow were computed by integrating the best fit SED over the wavelength range 10 - 2000 m.
We have ignored the effects of flux boosting on the properties derived from the SED fits. In reality, since the BLAST differential source count density falls very rapidly with flux (approximately following – see Patanchon et al., 2009), the effects of Eddington bias and source confusion mean that the fluxes in our source catalog are slightly boosted. However, by restricting our analysis to a relatively bright subset of the BLAST source catalog and also extracting flux densities at the radio or MIPS source positions, we expect any boosting to be manageable. In fact, repeating our analysis on a preliminary de-boosted dataset indicates a small flux bias which results in a small scatter with negligible bias to the derived far-IR luminosities and a slight bias of approximately K to the dust temperatures. A full treatment of flux boosting in the BLAST data will be explored in future work.
4. Results
Several of the results presented in this section, where stated, are limited to a robust sample of sources. We have defined this robust sample based on the results of the SED fitting discussed below. The robust sample is therefore a subset of those sources with photometric redshifts.
A source is considered robust if its best fit rest-frame dust temperature is not at the extremes of our uniform temperature prior (i.e., if ) and if its SED can be fit with , where is the number of degrees of freedom of the fit. For normally distributed errors, this threshold in corresponds to excluding the worst fit 10% of SEDs. For almost all of our sources, since we have five flux measurements and two SED parameters (normalization and ). With these criteria, our robust sample contains 74 BLAST sources.
Defining the robust sample in terms of the SED fitting is motivated by the fact that source redshifts are fixed at the value of the photometric redshift estimated for the counterpart. If the assumed redshift is incorrect, either because the photometric redshift is intrinsically unreliable or because the BLAST source has been spuriously identified with the counterpart, then this will manifest itself either with a poor SED fit or by requiring an extreme temperature to obtain an acceptable fit.
4.1. Identifications
Table 1 lists the BLAST sources within the FIDEL region with identified radio and/or 24 m counterparts. Table 2 lists the radio and 24 m counterparts to the BLAST sources located outside the FIDEL region.
Within the FIDEL region the 24 m identification rate () is 23/78 compared with the radio identification rate of the VLA data of 29/78. The overall identification rate, i.e., a BLAST source being identified with by either a radio or 24 m source is 39/78 in the FIDEL area. Splitting this by band, the overall rates (as a fraction of sources detected at at each wavelength) are 31/42 at 250 m, 26/45 at 350 m and 16/48 at 500 m. In the area outside the FIDEL region, the 24 m identification rate of the SWIRE data is 131/268 compared with the rate of the Norris et al. data (and the outer part of the VLA data) of 74/220.
Figure 6 plots the overall identification rate as a function of 250 and 500 m flux for sources detected at at each wavelength. The figure shows a small decline in the identification rate of BLAST sources towards fainter 250 m fluxes and a stronger decline towards fainter 500 m fluxes. Over the full area common to the radio and 24 m data, this decline corresponds to 37 out of 150 of the 250 m sources not being identified and 94 out of 146 of the 500 m sources not being identified. Despite benefitting from a negative K-correction (which is quite weak at 250 m), lower flux BLAST sources are more likely to reside at higher redshifts. The measured decrease in identification rate at lower fluxes therefore implies firstly that the unidentified sources lie at higher redshifts than the identified sources on average and secondly that there is a larger fraction of unidentified high redshift 500 m sources. Section 4.2.1 discusses this further.
By summing the values of determined in the identification process, the number of expected false counterparts in the sample can be estimated. Out of all 103 radio counterparts identified with , of these is expected to be false. Similarly, out of all 154 24 m sources with , counterparts would be expected to be false. Limiting this to our robust sample of counterparts, the expected number of false identifications is out of 46 in the radio and out of 56 at 24 m.
Relaxing the threshold on to 0.1 in the area outside the FIDEL region results in an additional 29 counterparts. Summing over these 29 counterparts indicates that two of them would be expected to be chance alignments. On this basis, we have included counterparts up to in Table 2. However, these additional sources are only listed in the table and are not included in any analysis in this paper.
| ID | (radio) | (radio) | (24 m) | (24 m) | zRR | z17 | |||||||||
|---|---|---|---|---|---|---|---|---|---|---|---|---|---|---|---|
| 4 | 53.14622 | -27.92569 | 0.06 | 0.0082 | 1.9 | 53.14611 | -27.92573 | 5.150 | 0.0006 | 2.0 | 0.06 | 0.04 | 23.3 | 1.47 | 13.6 |
| 6 | 53.12452 | -27.74028 | 0.34 | 0.0242 | 10.4 | 53.12444 | -27.74005 | 6.930 | 0.0022 | 9.5 | 0.05 | 0.07 | 25.8 | 2.58 | 1.99 |
| 7 | 53.20818 | -27.57581 | 0.31 | 0.0361 | 12.7 | - | - | - | - | - | - | 0.23 | 26.2 | 20.8 | 12.9 |
| 17 | 53.20553 | -27.97914 | 0.21 | 0.0177 | 6.5 | 53.20553 | -27.97916 | 0.333 | 0.1036 | 6.6 | - | 1.23 | 34.6 | 399. | 4.79 |
| 22 | 52.96724 | -27.65742 | 0.99 | 0.0158 | 11.0 | 52.96697 | -27.65738 | 0.424 | 0.1808 | 11.9 | - | 0.39 | 16.1 | 16.0 | 3.68 |
| 23 | 53.24674 | -27.72369 | 0.16 | 0.0479 | 11.1 | 53.24668 | -27.72363 | 0.324 | 0.2288 | 10.9 | - | 1.12 | 29.8 | 241. | 1.70 |
| 24 | 52.87452 | -27.95632 | 0.15 | 0.0196 | 5.9 | 52.87456 | -27.95623 | 0.275 | 0.1184 | 5.9 | - | - | - | - | - |
| 26 | 53.19183 | -27.96262 | 0.07 | 0.0083 | 2.1 | 53.19150 | -27.96259 | 2.420 | 0.0012 | 2.0 | - | 0.11 | 23.3 | 2.47 | 0.56 |
| 34 | 52.95710 | -27.72408 | 0.15 | 0.0332 | 8.5 | 52.95720 | -27.72392 | 1.040 | 0.0357 | 9.0 | 0.47 | 0.56 | 22.1 | 41.3 | 2.16 |
| 35 | 53.07106 | -27.97958 | 3.04 | 0.0228 | 19.0 | 53.07101 | -27.97958 | 0.064 | 0.8407 | 19.0 | - | 1.17 | 32.2 | 256. | 3.93 |
| 36 | 53.32402 | -27.76846 | 0.11 | 0.0081 | 2.9 | 53.32407 | -27.76831 | 0.471 | 0.0152 | 2.9 | - | 1.56 | 29.4 | 461. | 1.39 |
| 42 | 52.93913 | -27.77780 | 0.06 | 0.0387 | 5.0 | 52.93900 | -27.77783 | 0.308 | 0.0811 | 5.3 | - | 0.95 | 33.0 | 127. | 11.1 |
| 43 | 53.29048 | -27.80045 | 0.34 | 0.0628 | 19.7 | 53.29046 | -27.80044 | 2.590 | 0.0497 | 19.6 | - | 0.16 | 28.2 | 5.82 | 13.2 |
| 54 | - | - | - | - | - | 52.96448 | -27.74109 | 0.081 | 0.0414 | 1.4 | - | 0.94 | 24.1 | 127. | 1.15 |
| 55 | 52.87458 | -27.93354 | 0.14 | 0.0094 | 3.7 | - | - | - | - | - | - | 1.83 | 47.6 | 952. | 20.1 |
| 63 | 53.31882 | -27.84430 | 0.11 | 0.0256 | 6.0 | 53.31881 | -27.84427 | 3.590 | 0.0037 | 6.1 | - | 0.11 | 27.0 | 2.51 | 7.00 |
| 66 | 53.02044 | -27.77983 | 0.09 | 0.0138 | 3.5 | 53.02031 | -27.77980 | 0.591 | 0.0186 | 3.9 | - | 1.16 | 30.2 | 229. | 3.89 |
| 68 | 52.94418 | -27.95975 | 0.41 | 0.0054 | 4.4 | 52.94399 | -27.95965 | 1.250 | 0.0056 | 3.7 | 0.26 | 0.36 | 32.6 | 40.9 | 1.74 |
| 85 | - | - | - | - | - | 52.97289 | -27.83057 | 0.032 | 0.0119 | 0.5 | 1.07 | 0.73 | 19.3 | 59.0 | 2.81 |
| 102 | 52.85398 | -27.86892 | 12.79 | 0.0040 | 10.7 | 52.85364 | -27.86877 | 0.381 | 0.1525 | 9.6 | 1.28 | 1.18 | 41.9 | 357. | 2.80 |
| 110 | 53.07441 | -27.84972 | 0.05 | 0.0725 | 7.6 | 53.07444 | -27.84973 | 1.140 | 0.0229 | 7.7 | 0.43 | 0.12 | 23.3 | 1.90 | 0.68 |
| 112 | 53.17499 | -27.63874 | 29.46 | 2.3 | - | - | - | - | - | - | 0.83 | 31.8 | 98.9 | 5.68 | |
| 125 | 53.12247 | -27.58556 | 0.08 | 0.0338 | 5.7 | - | - | - | - | - | 1.14 | 0.43 | 41.1 | 259. | 10.5 |
| 131 | 53.00352 | -27.59926 | 2.03 | 0.0139 | 13.4 | - | - | - | - | - | 0.99 | 0.92 | 25.4 | 102. | 10.0 |
| 132 | 53.10444 | -27.63972 | 0.11 | 0.0374 | 7.9 | 53.10435 | -27.63956 | 0.432 | 0.0943 | 7.8 | - | 0.62 | 22.5 | 38.9 | 0.78 |
| 136 | 53.11902 | -27.59375 | 0.09 | 0.0717 | 10.4 | 53.11897 | -27.59353 | 1.080 | 0.0462 | 11.2 | 0.56 | 0.69 | 28.6 | 74.6 | 0.20 |
| 145 | - | - | - | - | - | 53.04655 | -27.98295 | 1.380 | 0.0081 | 5.0 | 0.25 | 0.23 | 20.9 | 7.00 | 3.25 |
| 162 | 52.97921 | -27.73632 | 0.28 | 0.0356 | 11.8 | 52.97908 | -27.73624 | 0.131 | 0.5468 | 11.3 | 0.77 | 1.22 | 32.6 | 207. | 0.20 |
| 167 | 53.19950 | -27.70914 | 0.19 | 0.0427 | 11.4 | 53.19949 | -27.70913 | 1.070 | 0.0486 | 11.3 | - | 0.98 | 21.3 | 84.5 | 2.19 |
| 174 | - | - | - | - | - | 53.12323 | -27.66337 | 0.021 | 0.0248 | 0.6 | - | 0.95 | 32.2 | 65.0 | 15.1 |
| 179 | 53.24705 | -27.59286 | 0.19 | 0.0154 | 5.6 | 53.24717 | -27.59282 | 0.557 | 0.0338 | 5.3 | - | 1.12 | 30.6 | 111. | 8.22 |
| 198 | 53.06759 | -27.65860 | 0.08 | 0.0913 | 12.4 | 53.06747 | -27.65842 | 1.490 | 0.0326 | 12.0 | 0.37 | 1.34 | 22.1 | 11.9 | 3.17 |
| 218 | 52.92426 | -27.92695 | 0.10 | 0.0323 | 6.7 | 52.92403 | -27.92716 | 0.191 | 0.2590 | 7.5 | - | 0.91 | 25.4 | 86.0 | 3.07 |
| 221 | 53.04864 | -27.62401 | 4.05 | 0.0048 | 9.0 | 53.04847 | -27.62387 | 1.830 | 0.0181 | 8.7 | - | 1.55 | 24.5 | 196. | 4.32 |
| 235 | 53.26131 | -27.94520 | 0.27 | 0.0367 | 11.8 | 53.26065 | -27.94578 | 0.204 | 0.4137 | 11.7 | - | - | - | - | - |
| 240 | - | - | - | - | - | 53.27565 | -27.73757 | 0.327 | 0.0019 | 0.6 | - | 0.84 | 30.6 | 102. | 3.49 |
| 250 | 52.91480 | -27.68874 | 0.20 | 0.0319 | 9.4 | 52.91470 | -27.68874 | 1.460 | 0.0215 | 9.1 | 0.94 | 2.09 | 24.9 | 75.3 | 1.73 |
| 262 | 53.18002 | -27.92068 | 0.07 | 0.0373 | 5.9 | 53.17995 | -27.92065 | 0.539 | 0.0388 | 5.7 | - | 1.32 | 26.6 | 150. | 3.37 |
| 265 | - | - | - | - | - | 52.86584 | -27.74164 | 0.048 | 0.0096 | 0.5 | - | - | - | - | - |
Note. — (see Table 2 for the counterparts outside FIDEL). Reading from the left, columns are: radio co-ordinates, radio flux, /mJy, probability of radio counterpart being a chance alignment, , radio radial offset, arcsec, 24 m co-ordinates, 24 m flux, /mJy, probability of 24 m counterpart being a chance alignment, , 24 m radial offset, arcsec, photometric redshift from Rowan-Robinson et al., , COMBO-17 photometric redshift, , best fit temperature, /K, total far-IR/submm luminosity, and of the SED fit.
4.2. Redshifts
Figure 4 shows the distribution of redshifts for our robust sample of 74 BLAST sources. The figure also shows the redshift distribution of the SCUBA sources detected at 850 m by Chapman et al. (2005) and Aretxaga et al. (2007). The submm sources in our robust sample are clearly located at significantly lower redshifts than those detected by SCUBA. The median redshift of the sample of 73 SCUBA sources of Chapman et al. (2005) lies at with an inter-quartile range of and the sample of 120 SCUBA sources of Aretxaga et al. (2007) has a median of and inter-quartile range of . In comparison, the distribution of redshifts of our robust sample has a median of and an inter-quartile range of .
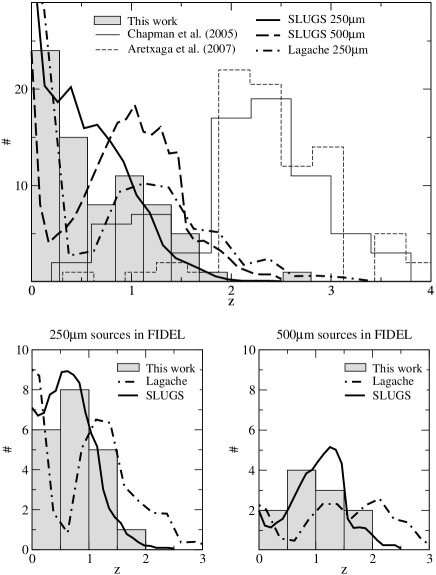
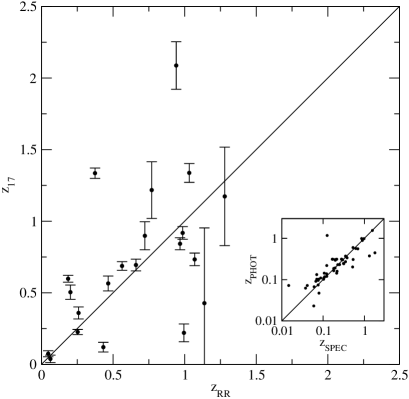
Figure 5 shows a comparison of the optical photometric redshifts for all sources that have a redshift provided by both Rowan-Robinson et al. (2008) and COMBO-17. The agreement is mediocre with a third of the 21 redshifts inconsistent at the level (although without uncertainties on the Rowan-Robinson redshifts the number of inconsistencies quoted here is an upper limit). However, in fitting the SEDs, for cases where both a Rowan-Robinson and COMBO-17 redshift exists, we took the redshift which gives the best fit to the submm/far-IR data. Furthermore, by limiting our analysis of the derived source properties to the robust sample, the majority of inaccurate photometric redshifts will be ruled out.
We also very recently obtained spectroscopic redshifts for approximately half of our radio and/or 24 m identified BLAST sources (Eales et al., 2009). Preliminary analysis has indicated excellent agreement with the photometric redshifts we have used in the current work. The inset panel in Figure 5 shows this comparison for the 53 sources in common and indicates that our method of selecting the photometric redshift that best fits the observed fluxes when two redshifts are available works well. Although we have not incorporated the spectroscopic redshifts in the analysis carried out in this paper, this excellent agreement increases the confidence in the source properties that follow from the SED fitting, since these strongly depend on the redshift assumed.
4.2.1 Comparison with model predictions
We have predicted the redshift distribution of the BLAST sources using an empirical model (Eales et al., 2009) derived from the results of the SCUBA Local Universe and Galaxy Survey (SLUGS; Dunne et al., 2000; Vlahakis et al., 2005). The model is based on the sample of 104 galaxies observed by Dunne et al. (2000) using SCUBA at 450 and 850 m. The galaxies form a statistically-complete sample above a m flux limit of 5.24 Jy and constitute the only large sample of galaxies with empirical spectral energy distributions that stretch from the far-IR to submm wavebands, which is a major advantage over existing models for submm surveys.
We can use the SLUGS sample to predict the source counts at any frequency in a straightforward way. The number of sources above a given 250 m flux density is given by
| (4) |
where is the comoving volume in which the th SLUGS source could have been detected in the original sample from which it was selected, and the integral is over comoving volume out to the redshift at which the source would be detected in the current sample. We assumed that the luminosity of the th SLUGS galaxy is given by
| (5) |
where is the empirical luminosity of the th SLUGS galaxy at the appropriate rest-frame wavelength and is an evolution function. We have implicitly assumed ‘luminosity evolution’ rather than ‘number-density evolution’, which is necessary anyway because it is impossible to fit both the cosmic background radiation and the submm source counts with number-density evolution. In practice, we have used the simple luminosity-evolution model from Rowan-Robinson et al. (2001), in which luminosity is given by
| (6) |
where is the time from the big bang and is the time at the current epoch. and are parameters of the model. We have found that values of and give acceptable fits to the spectral shape and intensity of the cosmic background radiation and to the SCUBA 850 m and Spitzer 70 m source counts. By adjusting the integral limits in equation (4), the distribution of redshifts can be computed.
The predicted redshift distribution for the BLAST galaxies detected at at 250 m and at 500 m using this approach is shown in the top panel of Figure 4. In addition, the figure shows the redshift distribution according to the galaxy evolution model of Lagache et al. (2004). The predictions apply specifically to the BLAST CDFS survey, taking into account the different areas and depths of BGS-Wide and BGS-Deep.
To allow for possible biases in our BLAST catalogue caused by flux boosting and source confusion, we have disregarded absolute model normalizations throughout this section and have instead normalized the model counts to match the BLAST counts. In this way, our aim is to compare only distribution morphologies. We refer the reader to Patanchon et al. (2009) for an account of the BLAST number counts and the subsequent implications for models.
A more direct comparison of the model redshift distributions is shown in the bottom two panels of Figure 4. Here, we have limited the comparison to the FIDEL area where the BLAST, radio and 24 m data are deepest and most uniform. The bottom left panel shows the redshift distribution of the 20 robust sources detected at 250 m. Similarly, the bottom right panel shows the redshift distribution of the 11 robust sources detected at 500 m. Both lower panels show the corresponding distributions predicted by our evolved SLUGS model and the Lagache et al. model.

The Lagache et al. and evolved SLUGS model distributions show considerable differences. In the 250 m case, the largest discrepancy occurs at . The Lagache et al. model predicts a deficit around at the division between the quiescent population at and the starbursting population at . However, according to the evolved SLUGS model, a peak is anticipated at . The measured distribution more closely resembles the SLUGS model although the large uncertainty due to Poisson noise means that the data can not be used to unambiguously validate one model over the other. In the case of the 500 m sources, there are similar discrepancies between the models. Once again, the evolved SLUGS model appears more consistent with the observed redshifts but the dominant Poisson noise precludes verification of either model.
Despite their differences, neither of the model redshift distributions in Figure 4 implies that we have failed to identify counterparts or obtain redshifts for a significant number of sources beyond where of the SCUBA population resides. Of the two models considered, the Lagache et al. model is most discrepant with our sample, implying that we may have missed a small fraction of higher redshift sources. This is indeed consistent with our expectations based on the declining identification rate of 250 m sources toward fainter fluxes (see Figure 6). However, neither the Lagache et al. model nor the SCUBA model predicts a sufficient fraction of high redshift 500 m sources required to explain the stronger decline in identification rate seen at fainter 500 m fluxes.
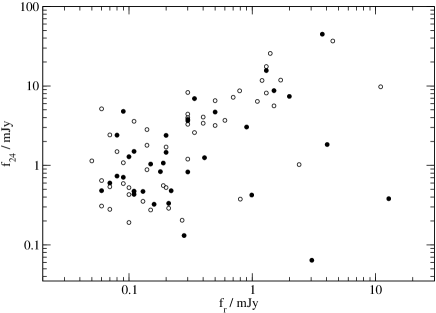
A obvious question that arises is to what degree does the fraction of sources without redshifts reconcile the differences between the SCUBA redshift distributions mentioned previously and the redshift distribution of our robust sample? Would we expect some of these sources to coincide with the SCUBA population? Unfortunately, we can only provide an upper limit. Figure 7 plots the radio flux versus the 24 m flux for all counterparts identified at both wavelengths. Sources in the robust sample (which all have photometric redshifts) are indicated by filled points. The distribution of non-robust sources (mostly without redshifts) is clearly not concentrated in any specific part of the plane, in particular at faint fluxes where more distant sources would be expected to lie. (Although not shown, the same is true when every source with a redshift is over-plotted). The rate of assignment of redshifts within the sub-sample of BLAST sources with counterparts therefore does not decline at higher redshifts at a detectable level. This in turn means that if we had been able to obtain redshifts for all 198 identified counterparts, their redshift distribution would be similar in shape to that of our robust sample except with greater normalization. Therefore, even under the extreme assumption that all 153 unidentified sources lie at high redshift (), there is still only an overlap of just under 50% with the SCUBA population.
However, we emphasize that the sources considered in this paper are at the bright end of the sources detected by BLAST within BGS-Deep/Wide. The fainter sources, generally detected with lower significance, are expected to probe higher redshifts. This does indeed seem to be borne out by the detection of a significant fraction of the extragalactic far-IR/submm background from fainter, higher redshift BLAST sources (Pascale et al., 2009; Marsden et al., 2009).
4.3. Source SEDs
Tables 1 and 2 list the best fit rest-frame dust temperatures and total far-IR/submm luminosities for the 114 sources with available photometric redshifts. The SEDs for those sources located in the FIDEL region are plotted in Appendix A.
In Figure 8 we plot the total far-IR/submm luminosity, , of the BLAST sources in the robust sample against redshift. Superimposed on this plot are curves showing the minimum a source must have in order to be detected at in one of the three BLAST bands. These thresholds were computed using the survey sensitivity in BGS-Deep (55, 45 and 30 mJy/beam at 250, 350 and 500 m respectively to 5) hence sources in the shallower region will be subjected to a set of curves shifted to slightly lower redshifts. The band in which the detection limit occurs varies as a function of redshift and dust temperature (e.g., a 10 K source meeting the requirement for a detection of in one of the three bands will only ever be met in the 500 m band). The figure shows that for a given out to a redshift of , cooler sources can be detected at greater distances. Beyond this redshift, 10 K sources begin to rapidly move out of the 500 m band and increasingly warmer sources become more readily detected. However, since the curves for hotter sources (40-50 K) become flatter at higher redshifts, a small increase in temperature of a hotter source pushes the detection limit to much lower redshifts. The net result is that there exists a modal mid-range dust temperature that slowly rises with redshift.
A complication is that the above argument assumes the sources have a uniform distribution of dust mass. In practice, a cooler source at high redshift must have substantially more dust than a hotter source to remain detected. Since sources with more dust are more rare, this greatly reduces the probability of detecting cooler sources (10-20 K) out to higher redshifts (). We return to this point below.
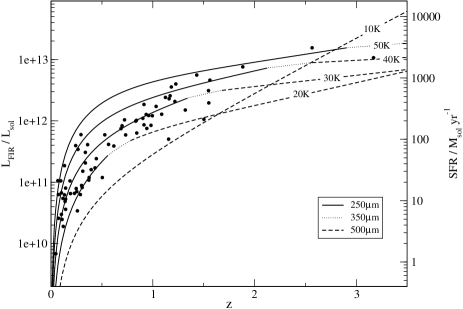
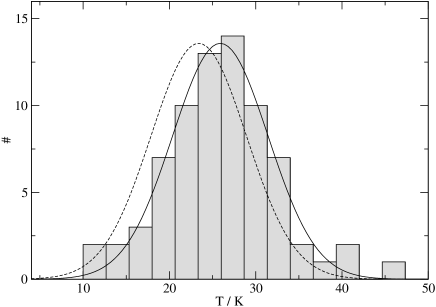
Figure 9 shows the distribution of best fit rest-frame dust temperatures in our robust sample for the assumed fixed value of . The distribution is well approximated by a Gaussian of mean 26 K and width of 5 K. This spread in temperatures is comparable to the error on the mean of 4 K determined through error propagation. Fixing instead gives a similar distribution but shifted to slightly lower temperatures with a mean of 23 K.
Comparing our dust temperatures with those derived for submm sources detected at 850 m by SCUBA, we find that the BLAST sources are significantly cooler on average. The sample of 73 SCUBA sources of Chapman et al. (2005) has a median dust temperature of K, Kovacs et al. (2006) determined a median temperature of K for their sample of 15 sources while the sample of 25 SHADES galaxies studied by Coppin et al. (2008) was found to have a median temperature of 29 K (but with a large scatter of 18 K). As we discussed in Section 4.2, the SCUBA sources lie at significantly higher redshifts on average, hence an obvious question is whether our sample of BLAST sources supports a trend for hotter sources at higher redshifts.
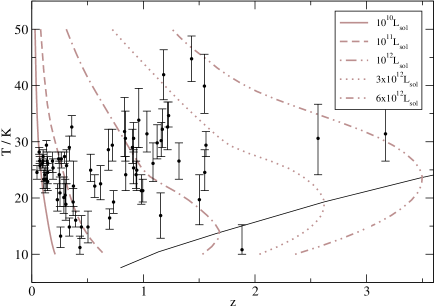
Figure 10 shows the rest-frame dust temperatures for the BLAST sources in our robust sample plotted against redshift. The scatter is large, but it is clear that hotter than average sources lie at higher redshifts. However, the selection effects discussed previously must be taken into consideration. The curves in Figure 10 are the sensitivity curves from Figure 8 transformed into the plane. For a given redshift, the curves in Figure 10 show that there is a dust temperature where the threshold in luminosity for detection is minimised. This is shown by the thin continuous line. Since lower luminosity sources are more common at a given redshift, this minimum threshold luminosity is where a population of sources with a uniform distribution of temperatures and dust masses would be expected to lie. Moving to colder or hotter temperatures away from this threshold at a fixed redshift requires a higher luminosity for detection. This is one of two dominant selection effects.
The second dominant selection effect arises from the fact that in reality, the dust mass distribution is far from uniform. Moving toward colder temperatures along a line of constant luminosity in Figure 10 requires the dust mass of a source to increase rapidly to stay within the survey sensitivity limits. For example, moving from K to K along the curve corresponding to requires an increase in dust mass from to (assuming a dust mass opacity coefficient of ). Using the dust mass function of local submm galaxies determined by Vlahakis et al. (2005), there are times as many galaxies with a dust mass of than with a dust mass of . This required dust mass at 20 K corresponds to the knee in the dust mass function, beyond which galaxies with more dust become vastly more rare. Repeating the estimate for 10 K results in an expected reduction in the number of galaxies by a factor of . Along the higher luminosity sensitivity curves, the same principles apply but since dust mass is proportional to luminosity for a fixed temperature the knee of the dust mass function and therefore the sudden rarity of galaxies applies at warmer temperatures.
This strong selection effect pushes sources away from the minimum threshold luminosity plotted in Figure 10. The observed trend of increasing rest-frame dust temperature with redshift is therefore where the strength of both selection effects are approximately balanced. Both cause an observed increase in temperature with redshift, but the luminosity effect limits the upper detectable temperature and the dust mass effect limits the lower temperature.
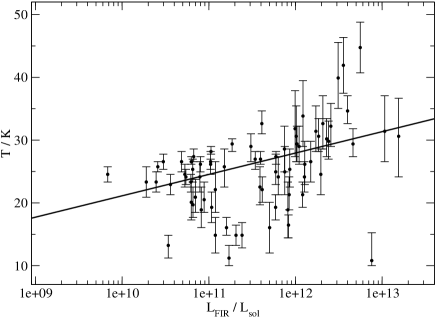
In Figure 11, we plot the dust temperature of sources in our robust sample against luminosity. The straight line fit is . The increase in temperature at higher luminosity is a reflection of the trend discussed previously. This is consistent with a known positive correlation between intrinsic dust temperature and far-IR luminosity for luminous infrared galaxies in the local Universe (Chapman et al., 2003; Chapin et al., 2009). A more complete investigation will be discussed in forthcoming work (Chapin et al., in preparation).
5. Summary and Discussion
We have identified counterparts detected at 1.4GHz and/or 24 m to 198 of the 350 BLAST sources contained within the deg2 of BGS-Wide and BGS-Deep centered on the CDFS. In the region within BGS-Deep covered by the deep 24 m FIDEL catalog where we also have deep VLA data, the identification rate is 23/78 for the 24 m sources and 29/78 for the radio sources. In the deg2 surrounding the FIDEL region, the identification rate for 24 m SWIRE sources is 131/268 compared with the rate of 74/220 using the Norris et al. radio catalog.
Of the identified counterparts, 114 have photometric redshifts previously estimated by COMBO-17 and/or Rowan-Robinson et al. (2008). Using these redshifts, we have fitted modified black body SEDs to the BLAST fluxes measured at wavelengths 250, 350 and 500 m and Spitzer fluxes at 70 and 160 m. We have defined a robust sample of 74 sources whose SEDs fit the observed fluxes with (rejecting the worse fit 10% assuming normal errors) and whose resulting best fit dust temperatures are not at the extremes of 10 K or 50 K of our uniform temperature prior.
The distribution of redshifts of our robust sample has a median of and an inter-quartile range of . The dust temperatures are approximately normally distributed with a median temperature of K (for , or K for ) and the distribution of bolometric far-IR/submm luminosity has a median of .
Comparing the submm sources detected by BLAST with those detected by SCUBA at 850 m, we find a stark contrast. It is clear from the redshift distributions alone that the BLAST sources in our robust sample are a significantly less distant population. The median redshift of submm sources detected to date in 850 m SCUBA surveys lies somewhere between (e.g., Chapman et al., 2005; Aretxaga et al., 2007; Younger et al., 2007). In comparison, 75% of the robust BLAST sources, for which we have identified counterparts in a similar manner to the SCUBA surveys (i.e., with a combination of radio and 24 m data, the same used by Ivison et al., 2007, for example), lie at .
This significant difference can not be explained by our selection of robust sources. Within the subset of BLAST sources with identified counterparts, the robust sources form a uniform random sampling of the plane spanned by radio and 24 m counterpart flux. In other words, we have not systematically failed to obtain redshifts for a more distant subset of identified BLAST sources where the radio and/or 24 m flux would be expected to be lower on average. Therefore, we would not expect the redshift distribution of the full sample of 198 identified BLAST sources to extend to much greater redshifts. However, there remains the possibility that the remaining 153 BLAST sources without identified counterparts lie at higher redshifts on average. We have measured a decrease in the identification rate towards fainter BLAST fluxes which supports this hypothesis. Around a quarter of the 250 m sources detected at remain unidentified compared to nearly two thirds of 500 m sources.
We have compared our measured redshift distributions with predictions made by the galaxy evolution model of Lagache et al. (2004) and by our own model where we evolved the local 850 m luminosity function with the empirical models of Rowan-Robinson et al. (2001). Considering sources detected at 250 m, our own model implies that we have not failed to identify a significant number of 250 m sources at higher redshift within the survey sensitivity limits. However, the Lagache model predicts that we may have failed to identify a small fraction () beyond which is compatible with our observed small decline in the identification rate at faint 250 m fluxes. Conversely, at 500 m, neither model implies a large enough fraction of high redshift sources to accommodate the strong decline in identification rate toward faint fluxes measured. This decline results in unidentified 500 m sources. Even extending the models to include sources only shows a increase in the number of sources predicted at .
Considering all of the evidence presented (and bearing in mind that the models are not absolutely normalized), the most likely explanation is that the unidentified BLAST sources do indeed lie at higher redshifts than the identified subset on average, but that they also include a significant fraction of lower redshift sources. Failure to identify a low redshift source will occur if the counterpart is too faint, either to the extent that it is not detected or that it yields a value of in the ID procedure that falls outside the threshold. To conclude our discussion of redshifts, although we cannot fully quantify the overlap of the redshift distribution of BLAST sources considered in this paper with that of the SCUBA population, we can place a strong upper limit. Under the extreme assumption that all 153 unidentified sources lie at higher redshift (say ) than the 198 identified, the overlap with the SCUBA population is still just under 50%.
We have also found that the average dust temperature of the BLAST sources is clearly different to that of sources detected in the SCUBA surveys. The BLAST sources have a significantly cooler temperature distribution compared to the higher redshift 850 m population. For example, Chapman et al. (2005) measured a median dust temperature of K. This is consistent with a trend observed in our sample of BLAST sources such that sources with higher dust temperatures are seen at higher redshifts. We have shown that this trend is the result of two strong selection effects.
This paper has addressed a small fraction of the analysis made possible by the multi-wavelength catalog of BLAST sources published herein and the identification of their radio and 24 m counterparts. Further analysis will be conducted in forthcoming BLAST papers.
An immediate priority is to increase the number of source redshifts. We have very recently obtained spectroscopic redshifts with the multi-fiber spectrometer, AAOmega, on the Anglo-Australian telescope for of the BLAST sources (Eales et al., 2009). Preliminary results show very close agreement with the subset of sources in common that have previously derived photometric redshifts, although the spectroscopic sample extends the total number significantly. The multi-wavelength catalog (in combination with the Spitzer photometry at 70 and 160 m) allows submm photometric redshifts to be estimated for those sources without counterparts. With a larger sample of redshifts, more stringent limits can be placed on galaxy evolution models and the redshift distributions they predict. These redshifts also enable investigation of the evolution of the submm luminosity function (Chapin et al., in preparation) and more rigorous investigation of the far-IR/radio correlation (Ivison et al., in preparation). Another possibility brought about by the spectra is measurement of equivalent line widths to provide a direct estimate of unobscured star formation rates. Combining spectra with optical/near-IR morphology will give new insight into the types of systems that BLAST, and hence Herschel (see below), is sensitive to. Determination of the dominant processes at play will greatly assist our understanding of the link between these systems and the local population of galaxies.
The photometry upon which the submm source properties derived in this paper have been based, the three BLAST bands at 250, 350 and 500 m and the two Spitzer channels at 70 and 160 m, is almost identical to what the Herschel Space Observatory is expected to deliver with SPIRE and PACS. Although the 9 deg2 BLAST survey analyzed here represents a significant leap forward in terms of areal coverage of submm surveys, a subsequent leap is imminent with the anticipated several hundred square degree surveys to be conducted with Herschel.
Appendix A Submm SEDs
Figure 12 shows the best fit SEDs to the BLAST and Splitzer 70 and 160 m data for the BLAST sources in the FIDEL region.


Appendix B Counterparts outside the FIDEL region
Table 2 lists the radio and/or 24 m counterparts to the BLAST sources outside the FIDEL region.
| ID | (radio) | (radio) | (24 m) | (24 m) | zRR | z17 | |||||||||
|---|---|---|---|---|---|---|---|---|---|---|---|---|---|---|---|
| 1 | 52.33788 | -28.13343 | 4.50 | 0.0005 | 3.3 | 52.33796 | -28.13353 | 36.781 | 2.9 | - | - | - | - | - | |
| 2 | 52.48567 | -28.77572 | 5.40 | 0.0004 | 3.0 | - | - | - | - | - | - | - | - | - | - |
| 3 | 51.92112 | -28.38893 | 3.70 | 0.0015 | 5.8 | 51.92133 | -28.38897 | 44.827 | 5.4 | 0.07 | - | 28.2 | 10.6 | 3.80 | |
| 5 | 52.88047 | -27.47975 | 1.70 | 0.0014 | 4.4 | 52.88068 | -27.47972 | 11.841 | 0.0002 | 4.1 | - | - | - | - | - |
| 8 | 53.95480 | -27.82182 | 11.00 | 0.0005 | 4.6 | 53.95509 | -27.82199 | 9.762 | 0.0004 | 5.3 | - | - | - | - | - |
| 9 | - | - | - | - | - | 52.31905 | -27.65615 | 13.678 | 3.2 | 0.07 | - | 26.6 | 6.28 | 4.46 | |
| 10 | - | - | - | - | - | 52.20959 | -26.61418 | 19.408 | 4.2 | - | - | - | - | - | |
| 11 | 53.60244 | -27.75840 | 0.40 | 0.0013 | 2.7 | 53.60240 | -27.75882 | 4.057 | 0.0009 | 4.1 | - | - | - | - | - |
| 12 | 52.28164 | -28.68818 | 1.30 | 0.0014 | 3.9 | 52.28206 | -28.68822 | 17.522 | 3.8 | 0.09 | - | 28.2 | 10.5 | 7.73 | |
| 13 | 52.45617 | -28.84953 | 2.00 | 0.0028 | 7.2 | 52.45636 | -28.84938 | 7.386 | 0.0009 | 6.7 | 0.10 | - | 26.2 | 10.5 | 1.04 |
| 15 | 53.42390 | -28.12707 | 0.60 | 0.0033 | 5.2 | 53.42405 | -28.12696 | 3.688 | 0.0020 | 5.7 | 0.27 | - | 27.8 | 22.2 | 17.0 |
| 16 | 52.74791 | -28.16681 | 1.20 | 0.0032 | 6.3 | 52.74809 | -28.16694 | 11.714 | 0.0004 | 7.0 | 0.10 | - | 28.2 | 7.12 | 7.10 |
| 18 | 52.84781 | -27.94960 | 0.18 | 0.0142 | 11.1 | 52.84802 | -27.94975 | 0.835 | 0.0415 | 10.3 | - | 0.91 | 30.6 | 185. | 1.42 |
| 19 | 53.57372 | -27.65888 | 0.70 | 0.0029 | 5.1 | 53.57382 | -27.65890 | 7.192 | 0.0006 | 5.3 | - | - | - | - | - |
| 20 | 53.42222 | -27.63578 | 0.79 | 0.0053 | 7.5 | 53.42229 | -27.63586 | 8.676 | 0.0009 | 7.6 | - | - | - | - | - |
| 21 | - | - | - | - | - | 52.96558 | -28.20779 | 2.551 | 0.0130 | 12.4 | 0.19 | - | 26.6 | 10.5 | 1.55 |
| 27 | - | - | - | - | - | 52.48787 | -28.31118 | 9.878 | 0.0002 | 3.5 | 0.02 | - | 25.4 | 0.268 | 10.2 |
| 28 | - | - | - | - | - | 53.32528 | -28.15234 | 1.033 | 0.0251 | 8.8 | - | - | - | - | - |
| 29 | 52.09459 | -28.53271 | 1.30 | 0.0039 | 7.4 | 52.09475 | -28.53271 | 15.632 | 0.0003 | 7.5 | 0.13 | - | 29.4 | 18.6 | 0.59 |
| 30 | - | - | - | - | - | 52.79799 | -27.97185 | 1.018 | 0.0017 | 1.8 | - | - | - | - | - |
| 31 | 53.56034 | -27.70594 | 0.50 | 0.0058 | 7.2 | 53.56038 | -27.70619 | 6.526 | 0.0015 | 7.7 | - | - | - | - | - |
| 32 | 53.38408 | -27.48811 | 0.30 | 0.0206 | 16.5 | 53.38424 | -27.48819 | 4.418 | 0.0095 | 16.8 | - | - | - | - | - |
| 37 | - | - | - | - | - | 52.17858 | -26.68290 | 13.441 | 0.0007 | 9.5 | - | - | - | - | - |
| 38 | 53.06646 | -28.06318 | 0.14 | 0.0042 | 4.7 | 53.06629 | -28.06340 | 0.883 | 0.0111 | 4.7 | 0.20 | 0.50 | 23.3 | 5.61 | 10.6 |
| 39 | 52.77753 | -27.75455 | 2.00 | 0.0044 | 9.4 | - | - | - | - | - | - | - | - | - | - |
| 40 | - | - | - | - | - | 52.08769 | -29.44216 | 12.497 | 0.0002 | 4.9 | 0.07 | - | 25.8 | 2.58 | 15.1 |
| 41 | 53.62771 | -27.32085 | 1.40 | 0.0003 | 1.7 | 53.62807 | -27.32084 | 25.644 | 2.8 | - | - | - | - | - | |
| 44 | 52.88014 | -27.54425 | 0.11 | 0.0058 | 5.6 | 52.88030 | -27.54424 | 0.475 | 0.0329 | 5.3 | - | - | - | - | - |
| 45 | - | - | - | - | - | 52.96289 | -28.18947 | 0.898 | 0.0181 | 6.4 | 0.14 | - | 22.9 | 3.61 | 3.30 |
| 46 | - | - | - | - | - | 52.79430 | -26.96136 | 4.734 | 0.0013 | 5.6 | - | - | - | - | - |
| 47 | 52.79519 | -27.93269 | 0.06 | 0.0136 | 9.6 | - | - | - | - | - | - | - | - | - | - |
| 48 | - | - | - | - | - | 52.73177 | -27.91680 | 0.718 | 0.0673 | 12.6 | - | - | - | - | - |
| 49 | 52.63681 | -27.59523 | 0.50 | 0.0170 | 15.9 | 52.63707 | -27.59490 | 4.694 | 0.0071 | 14.8 | 0.14 | - | 26.2 | 8.01 | 1.29 |
| 50 | 52.26844 | -28.79759 | 0.90 | 0.0058 | 8.5 | 52.26871 | -28.79818 | 3.039 | 0.0033 | 6.4 | 0.24 | - | 27.0 | 39.5 | 0.85 |
| 51 | 52.69279 | -27.92153 | 0.50 | 0.0031 | 4.9 | 52.69297 | -27.92202 | 3.178 | 0.0023 | 5.4 | - | - | - | - | - |
| 52 | - | - | - | - | - | 53.06131 | -28.19199 | 0.374 | 0.0145 | 2.5 | 0.53 | - | 24.9 | 59.2 | 5.19 |
| 53 | - | - | - | - | - | 53.58170 | -26.88803 | 3.059 | 0.0020 | 4.8 | - | - | - | - | - |
| 56 | - | - | - | - | - | 52.64380 | -27.72466 | 1.252 | 0.0067 | 4.7 | - | - | - | - | - |
| 57 | - | - | - | - | - | 53.63655 | -27.86255 | 0.977 | 0.0175 | 6.7 | - | - | - | - | - |
| 58 | 52.79956 | -27.99783 | 0.08 | 0.0304 | 23.9 | - | - | - | - | - | - | - | - | - | - |
| 60 | - | - | - | - | - | 53.59264 | -27.84540 | 1.913 | 0.0152 | 10.8 | - | - | - | - | - |
| 61 | 52.95233 | -28.07629 | 0.21 | 0.0141 | 11.2 | 52.95238 | -28.07612 | 0.289 | 0.1292 | 10.8 | - | - | - | - | - |
| 62 | 52.83376 | -27.97194 | 0.07 | 0.0109 | 8.2 | - | - | - | - | - | 0.72 | 0.90 | 29.4 | 104. | 1.60 |
| 64 | 53.16545 | -28.05319 | 0.13 | 0.0060 | 5.8 | 53.16539 | -28.05291 | 0.353 | 0.0565 | 6.0 | - | - | - | - | - |
| 65 | - | - | - | - | - | 52.57593 | -27.91682 | 3.977 | 0.0001 | 1.3 | 0.05 | - | 24.5 | 0.682 | 4.13 |
| 69 | - | - | - | - | - | 52.97797 | -28.17660 | 1.915 | 0.0305 | 16.9 | 0.31 | - | 25.8 | 15.1 | 2.00 |
| 70 | - | - | - | - | - | 52.79579 | -28.80925 | 3.109 | 0.0089 | 11.6 | 0.12 | - | 24.1 | 5.44 | 3.29 |
| 71 | 52.91907 | -27.49373 | 0.30 | 0.0066 | 6.9 | 52.91949 | -27.49422 | 8.273 | 0.0011 | 8.4 | - | - | - | - | - |
| 72 | 52.83482 | -27.56291 | 0.08 | 0.0041 | 4.3 | 52.83467 | -27.56283 | 2.402 | 0.0018 | 3.7 | 0.19 | - | 25.4 | 6.52 | 3.56 |
| 73 | 52.99224 | -27.58953 | 0.09 | 0.0085 | 7.2 | 52.99228 | -27.58941 | 0.709 | 0.0288 | 6.9 | 1.00 | 0.22 | 21.3 | 121. | 3.99 |
| 75 | 52.81060 | -27.65189 | 0.11 | 0.0101 | 8.3 | 52.81075 | -27.65190 | 1.501 | 0.0124 | 7.8 | 0.25 | - | 24.1 | 7.89 | 5.08 |
| 76 | 53.37103 | -27.66588 | 0.13 | 0.0098 | 8.2 | 53.37101 | -27.66590 | 0.470 | 0.0640 | 8.2 | - | 0.90 | 29.0 | 110. | 3.89 |
| 77 | 53.07986 | -27.52750 | 0.10 | 0.0088 | 7.4 | 53.07992 | -27.52744 | 1.286 | 0.0146 | 7.6 | 0.23 | - | 19.7 | 6.58 | 5.17 |
| 78 | - | - | - | - | - | 53.50673 | -27.79859 | 0.522 | 0.0342 | 5.9 | - | - | - | - | - |
| 80 | 52.99144 | -28.70857 | 0.50 | 0.0176 | 16.3 | - | - | - | - | - | - | - | - | - | - |
| 83 | - | - | - | - | - | 54.14349 | -28.70855 | 4.870 | 0.0035 | 10.1 | 0.29 | - | 27.4 | 59.6 | 1.68 |
| 84 | 53.32932 | -28.24242 | 0.30 | 0.0031 | 4.3 | 53.32923 | -28.24259 | 3.781 | 0.0008 | 3.6 | 0.10 | - | 26.6 | 2.99 | 3.87 |
| 86 | 53.69997 | -28.50265 | 1.30 | 0.0014 | 3.9 | 53.70008 | -28.50278 | 8.144 | 0.0002 | 3.5 | 0.07 | - | 27.0 | 2.64 | 11.6 |
Note. — (see Table 1 for counterparts within the FIDEL region). Reading from the left, columns are: radio co-ordinates, radio flux, /mJy, probability of radio counterpart being a chance alignment, , radio radial offset, arcsec, 24 m co-ordinates, 24 m flux, /mJy, probability of 24 m counterpart being a chance alignment, , 24 m radial offset, arcsec, photometric redshift from Rowan-Robinson et al., , COMBO-17 photometric redshift, , best fit temperature, /K, total far-IR/submm luminosity, and of the SED fit. Note that unlike Table 1, included here are counterparts with . This results in an additional 29 counterparts at the expense of an expected extra two false counterparts. None of these additional counterparts are included in any of the analysis presented in this paper but are simply listed here for reference.
| ID | (radio) | (radio) | (24 m) | (24 m) | zRR | z17 | |||||||||
|---|---|---|---|---|---|---|---|---|---|---|---|---|---|---|---|
| 87 | - | - | - | - | - | 51.94289 | -26.96452 | 4.102 | 0.0048 | 10.4 | - | - | - | - | - |
| 88 | - | - | - | - | - | 54.15564 | -28.68730 | 11.775 | 0.0007 | 8.7 | - | - | - | - | - |
| 90 | 52.07532 | -27.71906 | 1.50 | 0.0016 | 4.5 | 52.07560 | -27.71935 | 5.607 | 0.0003 | 3.2 | - | - | - | - | - |
| 92 | 53.17420 | -28.09792 | 0.30 | 0.0081 | 8.0 | 53.17420 | -28.09762 | 0.827 | 0.0330 | 8.7 | 0.30 | - | 20.5 | 8.84 | 3.26 |
| 93 | - | - | - | - | - | 53.53340 | -27.59049 | 0.830 | 0.0523 | 11.9 | - | - | - | - | - |
| 94 | 53.46999 | -27.72898 | 0.20 | 0.0284 | 22.4 | 53.46997 | -27.72978 | 1.702 | 0.0476 | 20.7 | - | - | - | - | - |
| 95 | - | - | - | - | - | 53.42970 | -27.15331 | 6.743 | 0.0008 | 6.1 | - | - | - | - | - |
| 96 | 53.40470 | -27.48562 | 0.30 | 0.0173 | 14.1 | 53.40502 | -27.48516 | 3.293 | 0.0098 | 13.1 | - | - | - | - | - |
| 97 | 53.31762 | -28.03985 | 0.07 | 0.0198 | 13.1 | 53.31769 | -28.03985 | 0.600 | 0.0870 | 12.9 | - | 0.37 | 19.3 | 10.8 | 4.11 |
| 98 | - | - | - | - | - | 53.05950 | -27.51728 | 0.509 | 0.0630 | 8.7 | - | - | - | - | - |
| 99 | - | - | - | - | - | 53.19616 | -27.11917 | 4.900 | 0.0023 | 7.9 | - | - | - | - | - |
| 100 | - | - | - | - | - | 53.01636 | -28.17114 | 0.327 | 0.0333 | 4.1 | 1.43 | - | 44.7 | 558. | 1.18 |
| 101 | - | - | - | - | - | 52.86677 | -28.16924 | 0.329 | 0.0806 | 7.5 | - | - | - | - | - |
| 103 | - | - | - | - | - | 51.78465 | -27.09038 | 5.473 | 0.0032 | 10.3 | - | - | - | - | - |
| 106 | - | - | - | - | - | 51.76851 | -28.12049 | 3.289 | 0.9 | - | - | - | - | - | |
| 109 | - | - | - | - | - | 53.53403 | -27.90217 | 1.203 | 0.0177 | 8.1 | - | - | - | - | - |
| 113 | 53.45440 | -27.64381 | 7.40 | 0.0093 | 24.0 | - | - | - | - | - | - | - | - | - | - |
| 115 | 52.86134 | -28.08199 | 0.08 | 0.0300 | 22.7 | - | - | - | - | - | - | - | - | - | - |
| 118 | 53.15833 | -27.53333 | 0.10 | 0.0135 | 10.2 | 53.15866 | -27.53345 | 0.429 | 0.0929 | 10.0 | - | - | - | - | - |
| 119 | - | - | - | - | - | 54.03130 | -27.38652 | 3.197 | 0.0070 | 10.4 | - | - | - | - | - |
| 120 | - | - | - | - | - | 51.76878 | -28.49448 | 1.216 | 0.0494 | 16.0 | - | - | - | - | - |
| 122 | 52.60704 | -27.83831 | 0.30 | 0.0026 | 3.8 | 52.60728 | -27.83817 | 3.655 | 0.0008 | 3.7 | 0.14 | - | 26.6 | 4.85 | 5.09 |
| 123 | - | - | - | - | - | 52.80170 | -26.95459 | 0.771 | 0.0009 | 1.0 | - | - | - | - | - |
| 126 | - | - | - | - | - | 53.05272 | -28.54705 | 0.854 | 0.0379 | 9.8 | 0.56 | - | 20.1 | 47.1 | 8.21 |
| 127 | - | - | - | - | - | 53.10425 | -29.28513 | 2.659 | 0.0009 | 2.9 | 0.13 | - | 23.3 | 6.22 | 3.09 |
| 128 | - | - | - | - | - | 52.75566 | -27.88870 | 0.993 | 0.0480 | 13.1 | 0.96 | - | 33.8 | 122. | 4.59 |
| 129 | - | - | - | - | - | 53.11398 | -28.69950 | 3.275 | 0.0223 | 21.5 | 0.31 | - | 29.0 | 34.6 | 6.70 |
| 130 | - | - | - | - | - | 53.76858 | -27.67370 | 0.626 | 0.0477 | 8.7 | 0.47 | - | 21.7 | 26.5 | 14.9 |
| 134 | - | - | - | - | - | 52.05436 | -27.08062 | 6.204 | 0.0019 | 8.7 | - | - | - | - | - |
| 135 | - | - | - | - | - | 52.89175 | -28.40077 | 3.010 | 0.0207 | 19.0 | 0.31 | - | 29.0 | 28.6 | 7.10 |
| 137 | 52.08969 | -28.13662 | 1.10 | 0.0056 | 8.7 | 52.08987 | -28.13661 | 6.388 | 0.0017 | 8.2 | 0.16 | - | 27.8 | 10.9 | 6.87 |
| 138 | - | - | - | - | - | 53.45399 | -27.83728 | 0.477 | 0.0208 | 3.9 | - | - | - | - | - |
| 139 | - | - | - | - | - | 54.10876 | -27.15997 | 10.366 | 0.0002 | 3.7 | - | - | - | - | - |
| 140 | - | - | - | - | - | 51.69027 | -28.84995 | 0.708 | 0.0796 | 14.0 | - | - | - | - | - |
| 143 | 52.95023 | -28.16929 | 0.20 | 0.0166 | 12.8 | 52.95030 | -28.16876 | 2.387 | 0.0116 | 11.0 | 0.34 | - | 29.0 | 30.6 | 5.53 |
| 146 | - | - | - | - | - | 52.50169 | -27.89651 | 2.905 | 0.0003 | 1.6 | 0.14 | - | 24.5 | 5.29 | 4.67 |
| 147 | - | - | - | - | - | 52.79279 | -27.71546 | 0.565 | 0.0420 | 7.3 | - | - | - | - | - |
| 148 | - | - | - | - | - | 52.76799 | -27.83581 | 0.463 | 0.0612 | 7.8 | - | - | - | - | - |
| 149 | - | - | - | - | - | 54.05851 | -28.18294 | 3.236 | 0.0190 | 19.4 | 0.31 | - | 27.4 | 30.7 | 6.88 |
| 152 | - | - | - | - | - | 54.20443 | -27.32740 | 4.858 | 0.0059 | 13.6 | - | - | - | - | - |
| 153 | - | - | - | - | - | 52.81561 | -26.57759 | 1.055 | 0.0607 | 16.2 | - | - | - | - | - |
| 154 | - | - | - | - | - | 53.92210 | -28.92295 | 3.853 | 0.0012 | 4.7 | 0.22 | - | 28.6 | 14.0 | 9.59 |
| 155 | 52.37314 | -28.70542 | 1.50 | 0.0010 | 3.4 | 52.37320 | -28.70511 | 8.731 | 0.0003 | 4.5 | 0.10 | - | 27.4 | 6.70 | 5.31 |
| 157 | - | - | - | - | - | 54.03839 | -28.16214 | 2.994 | 0.0002 | 1.4 | 0.24 | - | 27.0 | 23.3 | 6.58 |
| 158 | 53.28065 | -28.23637 | 0.30 | 0.0016 | 2.9 | 53.28098 | -28.23623 | 3.994 | 0.0009 | 4.0 | 0.04 | - | 27.0 | 0.316 | 13.8 |
| 160 | - | - | - | - | - | 52.18251 | -27.73569 | 0.459 | 0.0458 | 6.4 | - | - | - | - | - |
| 163 | 52.80927 | -27.57008 | 0.08 | 0.0091 | 7.4 | 52.80905 | -27.57013 | 0.734 | 0.0344 | 8.1 | 0.31 | - | 18.9 | 8.19 | 5.39 |
| 165 | - | - | - | - | - | 54.02465 | -29.57020 | 1.738 | 0.0333 | 16.6 | 0.29 | - | 31.0 | 12.2 | 13.6 |
| 166 | - | - | - | - | - | 52.72938 | -29.57429 | 4.336 | 0.0085 | 15.3 | 0.26 | - | 27.0 | 34.3 | 0.94 |
| 168 | 52.79785 | -27.88311 | 0.14 | 0.0183 | 13.3 | 52.79799 | -27.88293 | 2.823 | 0.0137 | 13.9 | 0.89 | - | 50.0 | 228. | 6.82 |
| 169 | - | - | - | - | - | 53.14828 | -28.10735 | 0.316 | 0.0150 | 2.4 | 1.55 | - | 39.9 | 311. | 4.88 |
| 170 | - | - | - | - | - | 52.66032 | -27.96378 | 1.433 | 0.0623 | 21.6 | 0.34 | - | 24.5 | 13.1 | 3.86 |
| 173 | - | - | - | - | - | 52.88347 | -28.21739 | 0.269 | 0.0622 | 6.0 | - | - | - | - | - |
| 175 | - | - | - | - | - | 54.08544 | -27.40627 | 11.236 | 0.0025 | 16.1 | - | - | - | - | - |
| 178 | - | - | - | - | - | 54.00227 | -26.84850 | 0.680 | 0.0389 | 8.1 | - | - | - | - | - |
| 180 | - | - | - | - | - | 53.27217 | -27.33042 | 0.531 | 0.0598 | 8.8 | - | - | - | - | - |
| 183 | - | - | - | - | - | 53.18489 | -28.18372 | 1.193 | 0.0292 | 10.9 | 0.29 | - | 20.1 | 6.28 | 4.26 |
| 184 | - | - | - | - | - | 53.45900 | -27.58877 | 0.275 | 0.0357 | 4.1 | - | - | - | - | - |
| 185 | - | - | - | - | - | 53.60793 | -27.75361 | 1.841 | 0.0232 | 13.7 | - | - | - | - | - |
| 188 | 52.79504 | -27.93130 | 0.14 | 0.0148 | 11.3 | 52.79525 | -27.93162 | 1.792 | 0.0181 | 11.4 | 0.31 | - | 23.3 | 16.5 | 12.8 |
| 196 | 53.05087 | -28.08790 | 0.07 | 0.0066 | 5.8 | 53.05111 | -28.08795 | 0.280 | 0.0697 | 6.6 | - | - | - | - | - |
| 197 | - | - | - | - | - | 53.39648 | -27.54589 | 0.850 | 0.0067 | 3.3 | - | - | - | - | - |
| 200 | 53.67066 | -27.94234 | 0.40 | 0.0105 | 10.3 | 53.67042 | -27.94180 | 3.390 | 0.0053 | 9.3 | 0.13 | - | 26.6 | 4.30 | 9.88 |
| 202 | - | - | - | - | - | 51.92740 | -28.31520 | 1.055 | 0.0677 | 17.6 | - | - | - | - | - |
| ID | (radio) | (radio) | (24 m) | (24 m) | zRR | z17 | |||||||||
|---|---|---|---|---|---|---|---|---|---|---|---|---|---|---|---|
| 203 | 53.87595 | -28.18568 | 0.80 | 0.0136 | 15.1 | 53.87598 | -28.18580 | 0.376 | 0.1716 | 15.6 | - | - | - | - | - |
| 204 | 53.40178 | -27.73207 | 0.22 | 0.0031 | 4.0 | 53.40199 | -27.73190 | 0.480 | 0.0286 | 4.8 | - | 1.09 | 26.2 | 128. | 3.02 |
| 205 | - | - | - | - | - | 51.80349 | -28.85086 | 1.303 | 0.0063 | 4.6 | - | - | - | - | - |
| 207 | 53.47462 | -27.93015 | 0.30 | 0.0070 | 7.2 | 53.47474 | -27.93006 | 1.199 | 0.0161 | 7.5 | - | - | - | - | - |
| 208 | - | - | - | - | - | 52.56557 | -27.66277 | 0.533 | 0.0354 | 6.2 | - | - | - | - | - |
| 210 | 53.39663 | -27.80555 | 0.06 | 0.0105 | 7.8 | 53.39699 | -27.80564 | 0.645 | 0.0371 | 7.5 | - | 1.16 | 27.8 | 105. | 12.4 |
| 212 | - | - | - | - | - | 52.86584 | -28.17471 | 0.932 | 0.0041 | 2.7 | 0.99 | - | 37.5 | 302. | 6.60 |
| 213 | 53.51498 | -27.65649 | 0.20 | 0.0187 | 14.2 | 53.51506 | -27.65668 | 0.526 | 0.1182 | 14.8 | - | - | - | - | - |
| 219 | - | - | - | - | - | 52.95915 | -27.00111 | 0.782 | 0.0126 | 4.5 | - | - | - | - | - |
| 220 | - | - | - | - | - | 53.66620 | -27.81678 | 0.659 | 0.0718 | 12.2 | - | - | - | - | - |
| 222 | - | - | - | - | - | 51.97130 | -28.67426 | 1.245 | 0.0051 | 4.0 | 1.13 | - | 29.0 | 446. | 8.41 |
| 223 | 53.59818 | -27.74068 | 0.50 | 0.0186 | 17.1 | - | - | - | - | - | - | - | - | - | - |
| 225 | - | - | - | - | - | 52.84398 | -27.88026 | 20.639 | 0.0009 | 17.2 | - | - | - | - | - |
| 226 | - | - | - | - | - | 54.34546 | -27.67242 | 1.093 | 0.0138 | 6.3 | 0.44 | - | 14.8 | 24.2 | 5.50 |
| 231 | 53.54147 | -27.87033 | 2.40 | 0.9 | 53.54124 | -27.86994 | 1.023 | 0.0031 | 2.5 | - | - | - | - | - | |
| 232 | - | - | - | - | - | 53.05288 | -27.43903 | 0.380 | 0.0443 | 5.3 | - | - | - | - | - |
| 236 | 53.39511 | -27.88722 | 0.06 | 0.0306 | 23.8 | - | - | - | - | - | - | 1.50 | 18.9 | 81.7 | 1.00 |
| 238 | - | - | - | - | - | 52.06044 | -28.98913 | 0.613 | 0.0769 | 11.9 | 0.44 | - | 16.1 | 42.4 | 0.74 |
| 239 | - | - | - | - | - | 52.83408 | -27.82483 | 0.462 | 0.0270 | 4.5 | 0.97 | 0.84 | 24.1 | 63.3 | 2.71 |
| 245 | - | - | - | - | - | 51.96693 | -29.15310 | 0.833 | 0.0221 | 6.8 | 0.34 | - | 14.8 | 20.6 | 1.30 |
| 246 | - | - | - | - | - | 52.72465 | -27.95224 | 0.446 | 0.0283 | 4.5 | - | - | - | - | - |
| 248 | - | - | - | - | - | 53.44989 | -27.24417 | 0.839 | 0.0909 | 18.0 | - | - | - | - | - |
| 252 | - | - | - | - | - | 53.94390 | -29.16091 | 0.638 | 0.0808 | 12.9 | 0.32 | - | 14.8 | 13.5 | 3.99 |
| 253 | - | - | - | - | - | 51.86079 | -29.32844 | 2.892 | 0.0027 | 5.4 | - | - | - | - | - |
| 254 | - | - | - | - | - | 52.91843 | -27.51704 | 0.649 | 0.0567 | 10.1 | - | - | - | - | - |
| 255 | 52.84097 | -27.85639 | 0.09 | 0.0098 | 7.9 | 52.84098 | -27.85658 | 4.784 | 0.0020 | 7.3 | 1.03 | 1.34 | 31.4 | 172. | 2.07 |
| 257 | - | - | - | - | - | 51.46241 | -28.82178 | 0.516 | 0.0038 | 1.5 | - | - | - | - | - |
| 259 | - | - | - | - | - | 52.77208 | -28.10434 | 3.131 | 0.0215 | 20.2 | 0.31 | - | 30.2 | 19.2 | 13.2 |
| 261 | - | - | - | - | - | 53.27457 | -27.47684 | 1.288 | 0.0184 | 8.8 | - | - | - | - | - |
| 264 | - | - | - | - | - | 53.27784 | -27.24149 | 0.385 | 0.0861 | 8.6 | - | - | - | - | - |
| 266 | 53.43335 | -27.85256 | 0.06 | 0.0294 | 20.6 | - | - | - | - | - | - | - | - | - | - |
| 270 | - | - | - | - | - | 53.21302 | -27.56991 | 0.398 | 0.0615 | 6.9 | - | 1.08 | 33.8 | 466. | 9.72 |
| 274 | 52.71999 | -27.91641 | 3.20 | 0.0078 | 16.0 | - | - | - | - | - | 0.89 | - | 14.8 | 50.9 | 10.2 |
| 275 | - | - | - | - | - | 52.95832 | -28.16156 | 0.404 | 0.0405 | 5.2 | 1.46 | - | 20.9 | 188. | 10.3 |
| 277 | 53.23040 | -27.55273 | 0.08 | 0.0208 | 14.2 | - | - | - | - | - | - | - | - | - | - |
| 280 | - | - | - | - | - | 53.46829 | -27.55235 | 0.497 | 0.0927 | 11.4 | - | - | - | - | - |
| 288 | - | - | - | - | - | 53.78062 | -27.88157 | 0.726 | 0.0703 | 13.1 | 0.54 | - | 17.7 | 44.8 | 0.92 |
| 289 | 52.75508 | -27.66077 | 0.20 | 0.0187 | 14.1 | - | - | - | - | - | 0.26 | - | 13.2 | 3.41 | 0.15 |
| 294 | 53.35498 | -27.57369 | 0.06 | 0.0106 | 8.0 | 53.35495 | -27.57305 | 0.481 | 0.0824 | 10.1 | - | 0.50 | 14.8 | 11.9 | 3.05 |
| 302 | 53.97283 | -27.91971 | 1.00 | 0.0129 | 15.4 | - | - | - | - | - | 1.88 | - | 10.8 | 758. | 4.86 |
| 303 | 52.84258 | -27.96543 | 0.10 | 0.0151 | 11.1 | 52.84276 | -27.96554 | 0.525 | 0.0845 | 11.2 | 0.19 | 0.60 | 26.6 | 49.4 | 12.1 |
| 304 | 53.13210 | -28.07667 | 0.10 | 0.0020 | 2.9 | - | - | - | - | - | - | - | - | - | - |
| 307 | - | - | - | - | - | 53.04573 | -27.09132 | 0.527 | 0.0532 | 8.0 | - | - | - | - | - |
| 309 | - | - | - | - | - | 52.80434 | -27.50111 | 0.596 | 0.0949 | 13.7 | - | - | - | - | - |
| 311 | - | - | - | - | - | 52.57364 | -28.50466 | 0.890 | 0.0090 | 4.2 | 2.57 | - | 30.6 | 1550. | 2.65 |
| 318 | - | - | - | - | - | 53.04041 | -28.12135 | 0.421 | 0.0725 | 8.1 | 0.75 | - | 12.8 | 20.8 | 3.25 |
| 319 | - | - | - | - | - | 52.64954 | -27.62388 | 0.481 | 0.0649 | 8.5 | - | - | - | - | - |
| 320 | - | - | - | - | - | 51.74249 | -29.27044 | 1.382 | 0.0517 | 18.4 | - | - | - | - | - |
| 322 | 53.34598 | -28.05703 | 0.07 | 0.0261 | 17.7 | - | - | - | - | - | - | 1.15 | 16.1 | 50.3 | 1.17 |
| 323 | - | - | - | - | - | 53.98524 | -28.59187 | 1.725 | 0.0420 | 19.2 | 0.28 | - | 27.8 | 15.7 | 11.7 |
| 329 | 53.39012 | -28.23444 | 2.30 | 0.0148 | 23.1 | - | - | - | - | - | 3.17 | - | 31.4 | 1067. | 2.47 |
| 332 | - | - | - | - | - | 52.66361 | -27.79376 | 0.982 | 0.0321 | 9.9 | - | - | - | - | - |
| 333 | - | - | - | - | - | 54.20814 | -27.99234 | 0.420 | 0.0180 | 3.2 | 0.70 | - | 16.5 | 83.1 | 2.01 |
| 335 | - | - | - | - | - | 54.05066 | -29.08868 | 1.403 | 0.0196 | 9.9 | 0.29 | - | 18.5 | 18.7 | 7.91 |
| 339 | - | - | - | - | - | 52.57649 | -28.85588 | 0.446 | 0.0428 | 5.9 | 0.33 | - | 19.3 | 24.4 | 6.43 |
| 341 | - | - | - | - | - | 53.69046 | -27.84443 | 0.774 | 0.0289 | 7.5 | - | - | - | - | - |
| 342 | - | - | - | - | - | 51.93830 | -29.39774 | 3.057 | 0.0165 | 16.6 | - | - | - | - | - |
| 343 | - | - | - | - | - | 53.62629 | -27.61929 | 0.359 | 0.0454 | 5.2 | - | - | - | - | - |
| 344 | - | - | - | - | - | 53.16118 | -28.09707 | 0.402 | 0.0657 | 7.3 | - | - | - | - | - |
| 346 | - | - | - | - | - | 51.76260 | -28.18012 | 0.623 | 0.0770 | 12.1 | - | - | - | - | - |
| 355 | - | - | - | - | - | 52.82410 | -27.33796 | 1.265 | 0.0226 | 9.8 | - | - | - | - | - |
| 359 | - | - | - | - | - | 53.94254 | -27.49272 | 0.720 | 0.0452 | 9.5 | - | - | - | - | - |
| 360 | - | - | - | - | - | 51.89937 | -28.98942 | 5.216 | 0.0114 | 21.3 | 0.43 | - | 11.2 | 17.1 | 0.92 |
| 368 | - | - | - | - | - | 52.48499 | -29.05382 | 0.919 | 0.0552 | 13.6 | 0.11 | - | 16.1 | 1.36 | 14.1 |
| 369 | - | - | - | - | - | 53.49599 | -29.62169 | 0.395 | 0.0767 | 8.0 | - | - | - | - | - |
| 376 | - | - | - | - | - | 52.63121 | -26.82185 | 0.498 | 0.0341 | 5.6 | - | - | - | - | - |
Appendix C Multi-wavelength BLAST catalog
Table 5 lists the 350 sources in the multi-wavelength catalog of BLAST sources in BGS-Wide and BGS-Deep centered on the CDFS. See Section 2.1 for a description of how this catalog was created. All sources are detected with a significance of in at least one of the bands.
| ID | BLAST ID | /Jy | /Jy | /Jy | /Jy | /Jy | /Jy |
|---|---|---|---|---|---|---|---|
| 1 | BLAST J032921-280803 | 0.997 | 0.033 | 0.472 | 0.026 | 0.196 | 0.018 |
| 2 | BLAST J032956-284631 | 1.056 | 0.038 | 0.536 | 0.029 | 0.227 | 0.021 |
| 3 | BLAST J032741-282325 | 0.639 | 0.036 | 0.240 | 0.029 | 0.084 | 0.019 |
| 4 | BLAST J033235-275530 | 0.177 | 0.011 | 0.075 | 0.009 | 0.034 | 0.006 |
| 5 | BLAST J033131-272842 | 0.234 | 0.015 | 0.101 | 0.013 | 0.038 | 0.009 |
| 6 | BLAST J033229-274415 | 0.157 | 0.011 | 0.079 | 0.008 | 0.043 | 0.006 |
| 7 | BLAST J033250-273420 | 0.159 | 0.011 | 0.089 | 0.009 | - | - |
| 8 | BLAST J033548-274920 | 0.478 | 0.039 | 0.198 | 0.030 | 0.114 | 0.021 |
| 9 | BLAST J032916-273919 | 0.418 | 0.034 | 0.195 | 0.026 | 0.074 | 0.018 |
| 10 | BLAST J032850-263654 | 0.490 | 0.041 | 0.225 | 0.032 | 0.120 | 0.022 |
| 11 | BLAST J033424-274527 | 0.164 | 0.014 | - | - | - | - |
| 12 | BLAST J032907-284121 | 0.417 | 0.037 | 0.214 | 0.029 | 0.065 | 0.020 |
| 13 | BLAST J032950-285058 | 0.381 | 0.037 | 0.147 | 0.029 | 0.072 | 0.021 |
| 14 | BLAST J033128-273920 | 0.105 | 0.011 | 0.079 | 0.009 | - | - |
| 15 | BLAST J033341-280742 | 0.123 | 0.013 | 0.065 | 0.010 | - | - |
| 16 | BLAST J033059-280955 | 0.207 | 0.022 | 0.086 | 0.016 | - | - |
| 17 | BLAST J033249-275838 | 0.101 | 0.011 | 0.073 | 0.009 | - | - |
| 18 | BLAST J033123-275707 | 0.096 | 0.011 | 0.062 | 0.009 | - | - |
| 19 | BLAST J033417-273927 | 0.125 | 0.014 | 0.061 | 0.011 | 0.034 | 0.008 |
| 20 | BLAST J033340-273811 | 0.098 | 0.011 | 0.071 | 0.009 | 0.029 | 0.006 |
| 21 | BLAST J033152-281235 | 0.118 | 0.014 | 0.062 | 0.011 | 0.031 | 0.008 |
| 22 | BLAST J033152-273929 | 0.093 | 0.011 | 0.066 | 0.009 | 0.054 | 0.006 |
| 23 | BLAST J033258-274324 | 0.093 | 0.011 | 0.065 | 0.009 | 0.039 | 0.006 |
| 24 | BLAST J033129-275720 | 0.092 | 0.011 | 0.055 | 0.009 | 0.049 | 0.006 |
| 25 | BLAST J033319-275423 | 0.091 | 0.011 | 0.029 | 0.008 | - | - |
| 26 | BLAST J033246-275743 | 0.090 | 0.011 | 0.047 | 0.009 | 0.020 | 0.006 |
| 27 | BLAST J032956-281843 | 0.276 | 0.034 | - | - | - | - |
| 28 | BLAST J033317-280901 | 0.095 | 0.012 | 0.073 | 0.009 | 0.055 | 0.006 |
| 29 | BLAST J032822-283205 | 0.284 | 0.035 | 0.102 | 0.027 | - | - |
| 30 | BLAST J033111-275820 | 0.093 | 0.012 | 0.063 | 0.009 | 0.034 | 0.007 |
| 31 | BLAST J033414-274217 | 0.103 | 0.013 | 0.042 | 0.010 | - | - |
| 32 | BLAST J033332-272900 | 0.111 | 0.014 | - | - | - | - |
| 33 | BLAST J033107-274023 | 0.097 | 0.012 | 0.063 | 0.010 | 0.060 | 0.007 |
| 34 | BLAST J033149-274335 | 0.087 | 0.011 | 0.053 | 0.009 | - | - |
| 35 | BLAST J033217-275905 | 0.085 | 0.011 | 0.065 | 0.008 | 0.036 | 0.006 |
| 36 | BLAST J033317-274606 | 0.083 | 0.011 | 0.074 | 0.008 | 0.052 | 0.006 |
| 37 | BLAST J032842-264107 | 0.317 | 0.042 | - | - | 0.066 | 0.021 |
| 38 | BLAST J033216-280350 | 0.082 | 0.011 | 0.049 | 0.009 | - | - |
| 39 | BLAST J033106-274508 | 0.086 | 0.012 | 0.047 | 0.010 | - | - |
| 40 | BLAST J032821-292636 | 0.303 | 0.041 | - | - | - | - |
| 41 | BLAST J033430-271915 | 0.273 | 0.037 | 0.135 | 0.029 | - | - |
| 42 | BLAST J033145-274635 | 0.080 | 0.011 | - | - | - | - |
| 43 | BLAST J033308-274809 | 0.080 | 0.011 | 0.045 | 0.008 | 0.036 | 0.006 |
| 44 | BLAST J033131-273235 | 0.092 | 0.013 | 0.086 | 0.010 | 0.058 | 0.007 |
| 45 | BLAST J033150-281126 | 0.091 | 0.013 | - | - | - | - |
| 46 | BLAST J033110-265744 | 0.291 | 0.041 | 0.113 | 0.032 | - | - |
| 47 | BLAST J033111-275605 | 0.080 | 0.011 | - | - | - | - |
| 48 | BLAST J033054-275457 | 0.089 | 0.013 | 0.057 | 0.010 | - | - |
| 49 | BLAST J033032-273527 | 0.158 | 0.022 | 0.077 | 0.019 | 0.046 | 0.013 |
| 50 | BLAST J032904-284759 | 0.260 | 0.037 | 0.137 | 0.029 | 0.061 | 0.020 |
| 51 | BLAST J033046-275515 | 0.097 | 0.014 | 0.040 | 0.011 | - | - |
| 52 | BLAST J033214-281133 | 0.083 | 0.012 | 0.069 | 0.009 | 0.035 | 0.007 |
| 53 | BLAST J033419-265319 | 0.275 | 0.040 | 0.162 | 0.030 | - | - |
| 54 | BLAST J033151-274428 | 0.074 | 0.011 | 0.066 | 0.009 | 0.038 | 0.006 |
| 55 | BLAST J033129-275557 | 0.074 | 0.011 | - | - | 0.051 | 0.006 |
| 56 | BLAST J033034-274325 | 0.110 | 0.016 | - | - | 0.031 | 0.009 |
| 57 | BLAST J033432-275140 | 0.099 | 0.015 | 0.040 | 0.011 | 0.033 | 0.008 |
| 58 | BLAST J033110-280011 | 0.080 | 0.012 | 0.044 | 0.010 | 0.036 | 0.007 |
| 59 | BLAST J033218-275212 | 0.074 | 0.011 | 0.064 | 0.009 | 0.048 | 0.006 |
| 60 | BLAST J033421-275033 | 0.088 | 0.013 | 0.031 | 0.010 | - | - |
| 61 | BLAST J033148-280424 | 0.074 | 0.011 | 0.056 | 0.009 | - | - |
| 62 | BLAST J033119-275822 | 0.074 | 0.011 | 0.040 | 0.009 | - | - |
| 63 | BLAST J033316-275045 | 0.072 | 0.011 | 0.034 | 0.008 | - | - |
| 64 | BLAST J033240-280310 | 0.073 | 0.011 | 0.062 | 0.008 | 0.034 | 0.006 |
| 65 | BLAST J033018-275500 | 0.149 | 0.023 | - | - | - | - |
| 66 | BLAST J033205-274648 | 0.072 | 0.011 | 0.063 | 0.008 | 0.022 | 0.006 |
| 67 | BLAST J033145-274159 | 0.073 | 0.011 | 0.038 | 0.009 | 0.041 | 0.006 |
| 68 | BLAST J033146-275732 | 0.072 | 0.011 | 0.044 | 0.008 | - | - |
Note. — Reading from left to right, columns are: Internal ID as used throughout this paper, official combined BLAST source ID then flux and flux error for 250, 350 and 500 m. To make the list, a source must be detected at in at least one band. Note that the fluxes quoted here have not been de-boosted and that errors are purely instrumental, neglecting the effects of source confusion (see Section 3.3 for further discussion).
| ID | BLAST ID | /Jy | /Jy | /Jy | /Jy | /Jy | /Jy |
|---|---|---|---|---|---|---|---|
| 69 | BLAST J033153-281036 | 0.078 | 0.012 | - | - | - | - |
| 70 | BLAST J033111-284835 | 0.252 | 0.039 | 0.093 | 0.029 | - | - |
| 71 | BLAST J033140-272937 | 0.086 | 0.013 | 0.074 | 0.011 | - | - |
| 72 | BLAST J033120-273344 | 0.083 | 0.013 | 0.043 | 0.011 | - | - |
| 73 | BLAST J033158-273519 | 0.071 | 0.011 | 0.058 | 0.009 | 0.057 | 0.006 |
| 74 | BLAST J033237-273531 | 0.071 | 0.011 | 0.058 | 0.009 | 0.046 | 0.006 |
| 75 | BLAST J033115-273905 | 0.076 | 0.012 | - | - | - | - |
| 76 | BLAST J033328-273949 | 0.072 | 0.011 | 0.033 | 0.009 | 0.025 | 0.006 |
| 77 | BLAST J033218-273138 | 0.071 | 0.011 | - | - | 0.023 | 0.006 |
| 78 | BLAST J033401-274759 | 0.072 | 0.011 | 0.041 | 0.009 | 0.026 | 0.006 |
| 80 | BLAST J033156-284241 | 0.230 | 0.036 | 0.082 | 0.027 | - | - |
| 81 | BLAST J033350-274254 | 0.072 | 0.011 | 0.058 | 0.009 | - | - |
| 82 | BLAST J033054-275025 | 0.078 | 0.012 | 0.078 | 0.010 | 0.035 | 0.007 |
| 83 | BLAST J033633-284223 | 0.227 | 0.036 | 0.145 | 0.028 | 0.069 | 0.019 |
| 84 | BLAST J033318-281436 | 0.103 | 0.017 | - | - | - | - |
| 85 | BLAST J033153-274950 | 0.068 | 0.011 | 0.059 | 0.009 | 0.052 | 0.006 |
| 86 | BLAST J033447-283013 | 0.220 | 0.036 | 0.128 | 0.027 | 0.074 | 0.019 |
| 87 | BLAST J032746-265801 | 0.254 | 0.041 | 0.107 | 0.032 | 0.088 | 0.022 |
| 88 | BLAST J033636-284115 | 0.223 | 0.036 | - | - | - | - |
| 89 | BLAST J033152-275032 | 0.067 | 0.011 | 0.064 | 0.008 | 0.044 | 0.006 |
| 90 | BLAST J032818-274311 | 0.235 | 0.038 | 0.189 | 0.028 | - | - |
| 91 | BLAST J033348-273435 | 0.076 | 0.012 | - | - | - | - |
| 92 | BLAST J033241-280557 | 0.068 | 0.011 | 0.037 | 0.009 | - | - |
| 93 | BLAST J033408-273514 | 0.093 | 0.015 | 0.071 | 0.011 | 0.034 | 0.008 |
| 94 | BLAST J033351-274357 | 0.069 | 0.011 | - | - | 0.043 | 0.006 |
| 95 | BLAST J033343-270918 | 0.248 | 0.041 | 0.099 | 0.033 | - | - |
| 96 | BLAST J033336-272854 | 0.090 | 0.015 | 0.050 | 0.011 | - | - |
| 97 | BLAST J033317-280220 | 0.067 | 0.011 | 0.035 | 0.009 | 0.028 | 0.006 |
| 98 | BLAST J033214-273053 | 0.069 | 0.011 | 0.048 | 0.009 | - | - |
| 99 | BLAST J033247-270716 | 0.240 | 0.040 | 0.106 | 0.030 | 0.098 | 0.021 |
| 100 | BLAST J033203-281015 | 0.069 | 0.011 | 0.031 | 0.009 | 0.021 | 0.006 |
| 101 | BLAST J033127-281009 | 0.086 | 0.014 | - | - | 0.047 | 0.008 |
| 102 | BLAST J033124-275207 | 0.066 | 0.011 | - | - | 0.031 | 0.006 |
| 103 | BLAST J032707-270516 | 0.237 | 0.040 | - | - | - | - |
| 104 | BLAST J033129-275913 | 0.066 | 0.011 | 0.049 | 0.009 | 0.053 | 0.006 |
| 105 | BLAST J033235-274930 | 0.065 | 0.011 | 0.039 | 0.008 | 0.044 | 0.006 |
| 106 | BLAST J032704-280713 | 0.230 | 0.039 | - | - | 0.066 | 0.020 |
| 107 | BLAST J033243-273917 | 0.065 | 0.011 | 0.037 | 0.009 | 0.026 | 0.006 |
| 108 | BLAST J033045-280219 | 0.100 | 0.017 | - | - | - | - |
| 109 | BLAST J033408-275415 | 0.070 | 0.012 | - | - | 0.026 | 0.007 |
| 110 | BLAST J033217-275054 | 0.064 | 0.011 | - | - | - | - |
| 111 | BLAST J033736-290254 | 0.224 | 0.038 | - | - | 0.077 | 0.020 |
| 112 | BLAST J033241-273818 | 0.064 | 0.011 | - | - | - | - |
| 113 | BLAST J033347-273848 | 0.066 | 0.011 | 0.041 | 0.009 | - | - |
| 114 | BLAST J033844-275532 | 0.217 | 0.038 | 0.091 | 0.029 | 0.070 | 0.021 |
| 115 | BLAST J033128-280508 | 0.068 | 0.012 | 0.046 | 0.009 | - | - |
| 116 | BLAST J033039-273652 | 0.109 | 0.019 | - | - | - | - |
| 117 | BLAST J033135-273934 | 0.063 | 0.011 | 0.033 | 0.009 | - | - |
| 118 | BLAST J033238-273151 | 0.064 | 0.011 | 0.055 | 0.009 | 0.033 | 0.006 |
| 119 | BLAST J033606-272311 | 0.229 | 0.040 | 0.139 | 0.031 | 0.093 | 0.021 |
| 120 | BLAST J032703-282950 | 0.205 | 0.036 | 0.135 | 0.027 | 0.117 | 0.020 |
| 122 | BLAST J033025-275014 | 0.099 | 0.017 | 0.060 | 0.015 | 0.038 | 0.010 |
| 123 | BLAST J033112-265716 | 0.230 | 0.041 | 0.113 | 0.032 | - | - |
| 125 | BLAST J033229-273505 | 0.063 | 0.011 | - | - | 0.023 | 0.006 |
| 126 | BLAST J033211-283251 | 0.202 | 0.036 | 0.094 | 0.028 | - | - |
| 127 | BLAST J033224-291707 | 0.218 | 0.039 | 0.097 | 0.030 | - | - |
| 128 | BLAST J033100-275310 | 0.068 | 0.012 | - | - | - | - |
| 129 | BLAST J033225-284148 | 0.203 | 0.036 | 0.127 | 0.029 | 0.067 | 0.020 |
| 130 | BLAST J033505-274027 | 0.206 | 0.037 | - | - | - | - |
| 131 | BLAST J033200-273604 | 0.061 | 0.011 | - | - | - | - |
| 132 | BLAST J033225-273818 | 0.062 | 0.011 | 0.040 | 0.009 | 0.031 | 0.006 |
| 134 | BLAST J032813-270453 | 0.225 | 0.040 | - | - | 0.073 | 0.022 |
| 135 | BLAST J033134-282344 | 0.207 | 0.037 | - | - | 0.070 | 0.019 |
| 136 | BLAST J033228-273547 | 0.061 | 0.011 | 0.050 | 0.009 | 0.023 | 0.006 |
| 137 | BLAST J032822-280809 | 0.206 | 0.037 | 0.102 | 0.029 | - | - |
| 138 | BLAST J033348-275015 | 0.061 | 0.011 | 0.046 | 0.008 | 0.025 | 0.006 |
| 139 | BLAST J033626-270939 | 0.224 | 0.041 | 0.111 | 0.031 | 0.067 | 0.021 |
| 140 | BLAST J032644-285106 | 0.210 | 0.038 | 0.125 | 0.029 | 0.140 | 0.020 |
| 141 | BLAST J033023-275041 | 0.101 | 0.018 | 0.060 | 0.015 | 0.042 | 0.011 |
| 143 | BLAST J033148-280958 | 0.066 | 0.012 | 0.072 | 0.009 | - | - |
| 144 | BLAST J033020-275553 | 0.115 | 0.021 | - | - | - | - |
| ID | BLAST ID | /Jy | /Jy | /Jy | /Jy | /Jy | /Jy |
|---|---|---|---|---|---|---|---|
| 145 | BLAST J033211-275859 | 0.060 | 0.011 | - | - | - | - |
| 146 | BLAST J033000-275347 | 0.153 | 0.028 | - | - | - | - |
| 147 | BLAST J033110-274302 | 0.063 | 0.012 | 0.052 | 0.009 | - | - |
| 148 | BLAST J033104-275001 | 0.062 | 0.011 | 0.045 | 0.009 | - | - |
| 149 | BLAST J033612-281046 | 0.206 | 0.038 | 0.107 | 0.030 | 0.083 | 0.021 |
| 150 | BLAST J033416-280216 | 0.081 | 0.015 | 0.043 | 0.011 | - | - |
| 151 | BLAST J033109-280045 | 0.066 | 0.012 | - | - | 0.036 | 0.007 |
| 152 | BLAST J033648-271936 | 0.205 | 0.038 | 0.116 | 0.029 | 0.064 | 0.021 |
| 153 | BLAST J033116-263428 | 0.230 | 0.043 | - | - | - | - |
| 154 | BLAST J033541-285524 | 0.210 | 0.039 | - | - | - | - |
| 155 | BLAST J032929-284222 | 0.200 | 0.038 | 0.140 | 0.028 | 0.063 | 0.021 |
| 157 | BLAST J033609-280942 | 0.208 | 0.039 | 0.111 | 0.030 | 0.084 | 0.021 |
| 158 | BLAST J033307-281412 | 0.081 | 0.015 | 0.065 | 0.011 | - | - |
| 159 | BLAST J033752-283714 | 0.192 | 0.036 | - | - | 0.091 | 0.019 |
| 160 | BLAST J032843-274414 | 0.191 | 0.036 | - | - | - | - |
| 161 | BLAST J033132-273759 | 0.059 | 0.011 | 0.036 | 0.009 | - | - |
| 162 | BLAST J033154-274406 | 0.057 | 0.011 | - | - | - | - |
| 163 | BLAST J033114-273412 | 0.070 | 0.013 | - | - | - | - |
| 164 | BLAST J033220-275640 | 0.058 | 0.011 | 0.066 | 0.009 | 0.036 | 0.006 |
| 165 | BLAST J033605-293357 | 0.210 | 0.040 | - | - | - | - |
| 166 | BLAST J033053-293431 | 0.196 | 0.037 | 0.090 | 0.028 | 0.098 | 0.020 |
| 167 | BLAST J033247-274221 | 0.057 | 0.011 | 0.054 | 0.008 | 0.036 | 0.006 |
| 168 | BLAST J033110-275303 | 0.058 | 0.011 | 0.033 | 0.009 | - | - |
| 169 | BLAST J033235-280626 | 0.057 | 0.011 | 0.030 | 0.009 | - | - |
| 170 | BLAST J033039-275805 | 0.079 | 0.016 | 0.047 | 0.013 | - | - |
| 171 | BLAST J033118-273454 | 0.065 | 0.013 | 0.050 | 0.010 | - | - |
| 172 | BLAST J033356-274556 | 0.058 | 0.011 | 0.054 | 0.009 | 0.047 | 0.006 |
| 173 | BLAST J033132-281257 | 0.088 | 0.017 | 0.092 | 0.013 | 0.068 | 0.010 |
| 174 | BLAST J033229-273948 | 0.057 | 0.011 | - | - | - | - |
| 175 | BLAST J033619-272415 | 0.202 | 0.040 | 0.117 | 0.030 | - | - |
| 176 | BLAST J033312-280758 | 0.059 | 0.012 | 0.040 | 0.009 | 0.032 | 0.006 |
| 177 | BLAST J033346-274214 | 0.057 | 0.011 | 0.048 | 0.009 | 0.052 | 0.006 |
| 178 | BLAST J033600-265102 | 0.210 | 0.041 | 0.107 | 0.031 | - | - |
| 179 | BLAST J033259-273536 | 0.056 | 0.011 | 0.027 | 0.009 | - | - |
| 180 | BLAST J033304-271943 | 0.187 | 0.037 | 0.084 | 0.028 | 0.089 | 0.019 |
| 181 | BLAST J032745-280446 | 0.193 | 0.038 | 0.141 | 0.029 | 0.067 | 0.020 |
| 182 | BLAST J033221-274107 | 0.056 | 0.011 | - | - | 0.031 | 0.006 |
| 183 | BLAST J033245-281104 | 0.059 | 0.012 | - | - | - | - |
| 184 | BLAST J033350-273520 | 0.062 | 0.012 | 0.039 | 0.010 | - | - |
| 185 | BLAST J033424-274514 | - | - | 0.122 | 0.010 | 0.097 | 0.008 |
| 186 | BLAST J033229-274307 | - | - | 0.076 | 0.008 | 0.043 | 0.006 |
| 187 | BLAST J033328-275659 | 0.054 | 0.011 | 0.071 | 0.009 | 0.052 | 0.006 |
| 188 | BLAST J033111-275546 | - | - | 0.075 | 0.009 | - | - |
| 189 | BLAST J033218-273113 | - | - | 0.070 | 0.009 | - | - |
| 190 | BLAST J033207-275813 | 0.048 | 0.011 | 0.066 | 0.009 | 0.065 | 0.006 |
| 191 | BLAST J033347-273435 | - | - | 0.072 | 0.010 | - | - |
| 192 | BLAST J033318-274125 | 0.051 | 0.011 | 0.064 | 0.009 | 0.038 | 0.006 |
| 193 | BLAST J033252-273755 | 0.047 | 0.011 | 0.064 | 0.009 | 0.040 | 0.006 |
| 195 | BLAST J033333-275926 | 0.036 | 0.011 | 0.059 | 0.009 | 0.042 | 0.006 |
| 196 | BLAST J033211-280514 | 0.036 | 0.011 | 0.057 | 0.009 | 0.029 | 0.006 |
| 197 | BLAST J033335-273244 | 0.044 | 0.012 | 0.062 | 0.009 | 0.038 | 0.007 |
| 198 | BLAST J033215-273930 | 0.044 | 0.011 | 0.056 | 0.009 | - | - |
| 200 | BLAST J033440-275630 | 0.074 | 0.018 | 0.084 | 0.013 | - | - |
| 201 | BLAST J033356-280314 | 0.052 | 0.013 | 0.062 | 0.009 | 0.049 | 0.007 |
| 202 | BLAST J032742-281911 | 0.161 | 0.037 | 0.178 | 0.028 | 0.133 | 0.020 |
| 203 | BLAST J033529-281053 | 0.128 | 0.038 | 0.188 | 0.030 | 0.076 | 0.021 |
| 204 | BLAST J033336-274359 | 0.049 | 0.011 | 0.054 | 0.009 | 0.022 | 0.006 |
| 205 | BLAST J032713-285101 | 0.190 | 0.038 | 0.174 | 0.028 | - | - |
| 206 | BLAST J033210-275207 | - | - | 0.054 | 0.009 | 0.037 | 0.006 |
| 207 | BLAST J033353-275555 | 0.049 | 0.011 | 0.054 | 0.009 | 0.026 | 0.006 |
| 208 | BLAST J033015-273940 | - | - | 0.131 | 0.021 | 0.052 | 0.014 |
| 210 | BLAST J033335-274827 | 0.039 | 0.011 | 0.052 | 0.008 | - | - |
| 211 | BLAST J033335-281422 | - | - | 0.085 | 0.014 | - | - |
| 212 | BLAST J033127-281027 | - | - | 0.070 | 0.012 | 0.047 | 0.008 |
| 213 | BLAST J033402-273916 | 0.059 | 0.012 | 0.058 | 0.010 | 0.036 | 0.007 |
| 214 | BLAST J033251-281037 | 0.049 | 0.011 | 0.054 | 0.009 | 0.052 | 0.006 |
| 216 | BLAST J033311-272223 | 0.097 | 0.028 | 0.131 | 0.022 | - | - |
| 217 | BLAST J033312-275609 | 0.045 | 0.011 | 0.051 | 0.009 | 0.048 | 0.006 |
| 218 | BLAST J033141-275530 | 0.038 | 0.011 | 0.050 | 0.008 | - | - |
| 219 | BLAST J033150-270007 | 0.195 | 0.043 | 0.184 | 0.032 | 0.088 | 0.022 |
| 220 | BLAST J033440-274905 | - | - | 0.070 | 0.012 | 0.043 | 0.008 |
| ID | BLAST ID | /Jy | /Jy | /Jy | /Jy | /Jy | /Jy |
|---|---|---|---|---|---|---|---|
| 222 | BLAST J032753-284023 | - | - | 0.168 | 0.029 | - | - |
| 223 | BLAST J033423-274409 | 0.064 | 0.014 | 0.060 | 0.010 | - | - |
| 224 | BLAST J033134-274628 | - | - | 0.049 | 0.009 | 0.021 | 0.006 |
| 225 | BLAST J033123-275233 | - | - | 0.048 | 0.008 | - | - |
| 226 | BLAST J033723-274021 | - | - | 0.163 | 0.029 | - | - |
| 227 | BLAST J033134-280059 | 0.038 | 0.011 | 0.048 | 0.009 | - | - |
| 228 | BLAST J033635-283558 | 0.126 | 0.036 | 0.154 | 0.028 | 0.104 | 0.019 |
| 229 | BLAST J033102-274456 | 0.059 | 0.012 | 0.055 | 0.010 | - | - |
| 230 | BLAST J033150-280557 | 0.055 | 0.011 | 0.049 | 0.009 | 0.039 | 0.006 |
| 231 | BLAST J033409-275213 | 0.056 | 0.012 | 0.050 | 0.009 | - | - |
| 232 | BLAST J033213-272619 | - | - | 0.067 | 0.012 | 0.038 | 0.008 |
| 233 | BLAST J033110-274515 | 0.051 | 0.011 | 0.051 | 0.009 | 0.052 | 0.007 |
| 234 | BLAST J033249-273109 | - | - | 0.048 | 0.009 | 0.022 | 0.006 |
| 235 | BLAST J033302-275635 | - | - | 0.047 | 0.009 | 0.031 | 0.006 |
| 236 | BLAST J033336-275328 | 0.036 | 0.011 | 0.047 | 0.009 | 0.032 | 0.006 |
| 237 | BLAST J033135-275449 | 0.033 | 0.011 | 0.047 | 0.009 | 0.046 | 0.006 |
| 238 | BLAST J032813-285930 | 0.143 | 0.041 | 0.174 | 0.032 | 0.124 | 0.022 |
| 239 | BLAST J033120-274933 | 0.049 | 0.011 | 0.046 | 0.008 | 0.021 | 0.006 |
| 240 | BLAST J033306-274415 | 0.050 | 0.011 | 0.046 | 0.009 | - | - |
| 241 | BLAST J033417-280108 | 0.060 | 0.014 | 0.059 | 0.011 | 0.051 | 0.008 |
| 242 | BLAST J033243-274728 | 0.040 | 0.011 | 0.045 | 0.008 | - | - |
| 244 | BLAST J033732-275836 | 0.117 | 0.037 | 0.148 | 0.028 | - | - |
| 245 | BLAST J032752-290904 | 0.124 | 0.040 | 0.163 | 0.031 | 0.103 | 0.021 |
| 246 | BLAST J033053-275704 | - | - | 0.058 | 0.011 | - | - |
| 247 | BLAST J033309-275124 | 0.051 | 0.011 | 0.045 | 0.008 | 0.036 | 0.006 |
| 248 | BLAST J033346-271431 | - | - | 0.161 | 0.030 | - | - |
| 249 | BLAST J032617-283344 | 0.123 | 0.036 | 0.146 | 0.028 | 0.069 | 0.019 |
| 250 | BLAST J033138-274122 | - | - | 0.044 | 0.008 | - | - |
| 251 | BLAST J033307-275831 | - | - | 0.045 | 0.009 | 0.021 | 0.006 |
| 252 | BLAST J033545-290948 | - | - | 0.151 | 0.029 | 0.069 | 0.021 |
| 253 | BLAST J032726-291936 | 0.160 | 0.039 | 0.157 | 0.030 | 0.105 | 0.021 |
| 254 | BLAST J033141-273107 | 0.047 | 0.013 | 0.053 | 0.010 | - | - |
| 255 | BLAST J033122-275130 | 0.053 | 0.011 | 0.044 | 0.008 | 0.031 | 0.006 |
| 256 | BLAST J033452-280119 | - | - | 0.096 | 0.018 | - | - |
| 257 | BLAST J032550-284919 | 0.139 | 0.038 | 0.147 | 0.028 | - | - |
| 258 | BLAST J033321-275512 | - | - | 0.044 | 0.009 | 0.032 | 0.006 |
| 259 | BLAST J033105-280634 | 0.063 | 0.015 | 0.064 | 0.012 | 0.058 | 0.009 |
| 260 | BLAST J033314-272913 | - | - | 0.050 | 0.010 | - | - |
| 261 | BLAST J033306-272831 | 0.061 | 0.013 | 0.051 | 0.010 | - | - |
| 262 | BLAST J033242-275511 | 0.048 | 0.011 | 0.044 | 0.009 | 0.019 | 0.006 |
| 263 | BLAST J032537-293422 | 0.122 | 0.040 | 0.155 | 0.030 | 0.096 | 0.021 |
| 264 | BLAST J033306-271435 | - | - | 0.157 | 0.031 | 0.105 | 0.021 |
| 265 | BLAST J033127-274430 | - | - | 0.043 | 0.009 | - | - |
| 266 | BLAST J033342-275117 | - | - | 0.043 | 0.009 | - | - |
| 267 | BLAST J033322-283356 | - | - | 0.146 | 0.029 | - | - |
| 268 | BLAST J033231-281247 | - | - | 0.050 | 0.010 | 0.030 | 0.007 |
| 269 | BLAST J032623-285456 | - | - | 0.147 | 0.029 | 0.082 | 0.020 |
| 270 | BLAST J033251-273417 | - | - | - | - | 0.058 | 0.006 |
| 271 | BLAST J033128-273942 | - | - | - | - | 0.055 | 0.006 |
| 272 | BLAST J033217-273042 | 0.056 | 0.011 | - | - | 0.052 | 0.006 |
| 273 | BLAST J033050-275529 | 0.062 | 0.013 | - | - | 0.062 | 0.008 |
| 274 | BLAST J033053-275513 | - | - | - | - | 0.060 | 0.007 |
| 275 | BLAST J033149-280936 | - | - | - | - | 0.052 | 0.006 |
| 276 | BLAST J033347-273503 | 0.054 | 0.012 | - | - | 0.050 | 0.007 |
| 277 | BLAST J033254-273308 | 0.038 | 0.011 | - | - | 0.043 | 0.006 |
| 278 | BLAST J033149-280311 | 0.053 | 0.011 | - | - | 0.042 | 0.006 |
| 279 | BLAST J033354-280720 | - | - | - | - | 0.053 | 0.008 |
| 280 | BLAST J033351-273306 | 0.052 | 0.013 | 0.040 | 0.010 | 0.051 | 0.007 |
| 282 | BLAST J033412-275210 | - | - | - | - | 0.045 | 0.007 |
| 283 | BLAST J033045-274633 | 0.053 | 0.014 | 0.038 | 0.011 | 0.053 | 0.008 |
| 284 | BLAST J033110-273702 | - | - | 0.042 | 0.010 | 0.047 | 0.007 |
| 287 | BLAST J033256-280102 | - | - | 0.039 | 0.009 | 0.040 | 0.006 |
| 288 | BLAST J033507-275242 | 0.104 | 0.034 | 0.101 | 0.021 | 0.090 | 0.014 |
| 289 | BLAST J033102-273948 | 0.049 | 0.013 | 0.049 | 0.010 | 0.048 | 0.007 |
| 290 | BLAST J033212-275601 | - | - | 0.029 | 0.008 | 0.039 | 0.006 |
| 291 | BLAST J033118-272849 | - | - | 0.054 | 0.016 | 0.066 | 0.010 |
| 292 | BLAST J033229-280358 | - | - | - | - | 0.039 | 0.006 |
| 293 | BLAST J033215-275018 | - | - | 0.037 | 0.009 | 0.038 | 0.006 |
| 294 | BLAST J033324-273432 | - | - | 0.037 | 0.009 | 0.039 | 0.006 |
| 296 | BLAST J033244-281158 | 0.052 | 0.012 | - | - | 0.043 | 0.007 |
| ID | BLAST ID | /Jy | /Jy | /Jy | /Jy | /Jy | /Jy |
|---|---|---|---|---|---|---|---|
| 297 | BLAST J033028-275625 | 0.084 | 0.019 | 0.071 | 0.015 | 0.065 | 0.010 |
| 299 | BLAST J033336-275751 | 0.050 | 0.011 | 0.038 | 0.009 | 0.038 | 0.006 |
| 300 | BLAST J033114-273556 | - | - | - | - | 0.046 | 0.007 |
| 301 | BLAST J033128-273745 | - | - | 0.038 | 0.009 | 0.040 | 0.006 |
| 302 | BLAST J033552-275511 | - | - | - | - | 0.130 | 0.021 |
| 303 | BLAST J033121-275803 | - | - | - | - | 0.038 | 0.006 |
| 304 | BLAST J033231-280437 | 0.049 | 0.011 | 0.037 | 0.009 | 0.037 | 0.006 |
| 306 | BLAST J033154-284219 | - | - | - | - | 0.118 | 0.019 |
| 307 | BLAST J033210-270531 | - | - | - | - | 0.128 | 0.021 |
| 309 | BLAST J033113-273016 | 0.081 | 0.017 | 0.072 | 0.015 | 0.057 | 0.009 |
| 310 | BLAST J033021-282344 | - | - | 0.100 | 0.028 | 0.117 | 0.020 |
| 311 | BLAST J033017-283020 | - | - | - | - | 0.113 | 0.019 |
| 312 | BLAST J033052-274206 | 0.060 | 0.013 | 0.041 | 0.011 | 0.045 | 0.008 |
| 313 | BLAST J033336-272934 | - | - | 0.034 | 0.011 | 0.046 | 0.008 |
| 314 | BLAST J033138-274853 | - | - | 0.037 | 0.008 | 0.035 | 0.006 |
| 316 | BLAST J032840-270822 | 0.130 | 0.041 | - | - | 0.129 | 0.022 |
| 318 | BLAST J033210-280711 | - | - | 0.041 | 0.009 | 0.035 | 0.006 |
| 319 | BLAST J033036-273717 | 0.080 | 0.019 | 0.074 | 0.017 | 0.063 | 0.011 |
| 320 | BLAST J032656-291615 | 0.150 | 0.037 | 0.088 | 0.029 | 0.111 | 0.019 |
| 321 | BLAST J033423-273224 | 0.084 | 0.024 | 0.055 | 0.017 | 0.067 | 0.012 |
| 322 | BLAST J033321-280333 | - | - | - | - | 0.035 | 0.006 |
| 323 | BLAST J033557-283540 | 0.153 | 0.036 | - | - | 0.113 | 0.020 |
| 324 | BLAST J033239-272942 | 0.035 | 0.011 | - | - | 0.036 | 0.006 |
| 325 | BLAST J032950-280013 | - | - | 0.077 | 0.024 | 0.097 | 0.017 |
| 326 | BLAST J033205-273043 | - | - | 0.033 | 0.009 | 0.037 | 0.007 |
| 327 | BLAST J033358-275357 | 0.035 | 0.011 | 0.040 | 0.009 | 0.034 | 0.006 |
| 328 | BLAST J033743-283135 | - | - | - | - | 0.105 | 0.019 |
| 329 | BLAST J033332-281348 | - | - | - | - | 0.050 | 0.009 |
| 330 | BLAST J033403-274321 | 0.042 | 0.012 | 0.041 | 0.009 | 0.037 | 0.007 |
| 332 | BLAST J033038-274738 | 0.047 | 0.015 | 0.047 | 0.012 | 0.046 | 0.008 |
| 333 | BLAST J033649-275932 | 0.141 | 0.036 | 0.112 | 0.028 | 0.107 | 0.019 |
| 335 | BLAST J033611-290528 | 0.155 | 0.039 | - | - | 0.114 | 0.021 |
| 336 | BLAST J033231-274541 | 0.037 | 0.011 | - | - | 0.032 | 0.006 |
| 337 | BLAST J033154-275354 | 0.048 | 0.011 | 0.039 | 0.009 | 0.033 | 0.006 |
| 338 | BLAST J033331-280944 | - | - | - | - | 0.038 | 0.007 |
| 339 | BLAST J033018-285124 | 0.171 | 0.039 | - | - | 0.113 | 0.021 |
| 340 | BLAST J033112-273333 | - | - | - | - | 0.044 | 0.008 |
| 341 | BLAST J033445-275038 | - | - | 0.057 | 0.013 | 0.050 | 0.009 |
| 342 | BLAST J032745-292408 | - | - | 0.136 | 0.032 | 0.123 | 0.023 |
| 343 | BLAST J033430-273704 | 0.068 | 0.019 | 0.040 | 0.013 | 0.051 | 0.009 |
| 344 | BLAST J033239-280553 | - | - | - | - | 0.032 | 0.006 |
| 345 | BLAST J033723-275653 | - | - | - | - | 0.102 | 0.019 |
| 346 | BLAST J032702-281055 | 0.155 | 0.037 | - | - | 0.109 | 0.021 |
| 347 | BLAST J032857-281327 | 0.110 | 0.035 | 0.089 | 0.028 | 0.100 | 0.019 |
| 348 | BLAST J033308-280545 | - | - | - | - | 0.032 | 0.006 |
| 349 | BLAST J033720-265950 | - | - | - | - | 0.121 | 0.023 |
| 350 | BLAST J033439-274212 | - | - | 0.046 | 0.013 | 0.049 | 0.009 |
| 351 | BLAST J033125-264713 | 0.157 | 0.041 | - | - | 0.120 | 0.023 |
| 355 | BLAST J033117-272006 | - | - | 0.133 | 0.028 | 0.107 | 0.021 |
| 356 | BLAST J033200-283721 | - | - | - | - | 0.100 | 0.019 |
| 357 | BLAST J033318-274926 | - | - | - | - | 0.031 | 0.006 |
| 358 | BLAST J033356-273613 | - | - | 0.031 | 0.010 | 0.035 | 0.007 |
| 359 | BLAST J033545-272937 | - | - | 0.105 | 0.029 | 0.105 | 0.020 |
| 360 | BLAST J032735-285902 | - | - | 0.107 | 0.031 | 0.113 | 0.022 |
| 361 | BLAST J033527-284233 | - | - | - | - | 0.105 | 0.020 |
| 362 | BLAST J033445-280222 | 0.092 | 0.025 | 0.070 | 0.017 | 0.059 | 0.011 |
| 363 | BLAST J033212-274258 | 0.043 | 0.011 | 0.030 | 0.009 | 0.031 | 0.006 |
| 365 | BLAST J033453-282822 | 0.121 | 0.036 | - | - | 0.100 | 0.019 |
| 366 | BLAST J033246-281629 | - | - | 0.060 | 0.014 | 0.052 | 0.010 |
| 367 | BLAST J033049-291151 | - | - | - | - | 0.104 | 0.020 |
| 368 | BLAST J032957-290321 | 0.135 | 0.039 | - | - | 0.105 | 0.021 |
| 369 | BLAST J033359-293715 | 0.145 | 0.039 | - | - | 0.108 | 0.021 |
| 371 | BLAST J033209-280118 | - | - | 0.028 | 0.008 | 0.030 | 0.006 |
| 372 | BLAST J032702-284013 | - | - | - | - | 0.103 | 0.020 |
| 373 | BLAST J033342-272413 | 0.128 | 0.026 | - | - | 0.070 | 0.014 |
| 374 | BLAST J033252-275929 | 0.052 | 0.011 | - | - | 0.030 | 0.006 |
| 375 | BLAST J032656-284912 | - | - | - | - | 0.101 | 0.020 |
| 376 | BLAST J033031-264922 | 0.155 | 0.041 | - | - | 0.108 | 0.021 |
| 377 | BLAST J032603-281109 | - | - | - | - | 0.098 | 0.019 |
| 378 | BLAST J033143-274817 | - | - | - | - | 0.029 | 0.006 |
Acknowledgments
We acknowledge the support of NASA through grant numbers NAG5-12785, NAG5- 13301, and NNGO-6GI11G, the NSF Office of Polar Programs, the Canadian Space Agency and the Natural Sciences and Engineering Research Council (NSERC) of Canada. This work is based in part on observations made with the Spitzer Space Telescope, which is operated by the Jet Propulsion Laboratory, California Institute of Technology under a contract with NASA. SD is supported by the UK Science and Technology Facilities Council (STFC). We thank Guilane Lagache for advice on implementation of her galaxy evolution models.
References
- Almaini et al. (2003) Almaini, O., et al., 2003, MNRAS, 338, 303
- Aretxaga et al. (2007) Aretxaga, I., et al., 2007, MNRAS, 379, 1571
- Barger et al. (1998) Barger, A. J., Cowie, L. L., Sanders, D. B., Fulton, E., Taniguchi, Y., Sato, Y., Kawara, K., & Okuda, H., 1998, Nature, 394, 248
- Blain et al. (2004) Blain, A. W., Chapman, S. C., Smail, Ian, & Ivison, R., 2004, ApJ, 611, 725
- Chapin et al. (2009) Chapin, E., Hughes, D. H., & Aretxaga, I., 2009, MNRAS, 393, 653
- Chapman et al. (2003) Chapman, S. C., Helou, G., Lewis, G. F., & Dale, D. A., 2003, ApJ, 588, 186
- Chapman et al. (2005) Chapman, S. C., Blain, A.W., Smail, I., & Ivison, R.J., 2005, ApJ, 622, 772
- Coppin et al. (2006) Coppin, K., et al., 2006, MNRAS, 372, 1621
- Coppin et al. (2008) Coppin, K., et al., 2008, MNRAS, 384, 1597
- Devlin et al. (2004) Devlin, M. J., et al., 2004, SPIE, 5498, 42
- Devlin et al. (2009) Devlin, M. J., et al., 2009, Nature, 458, 737
- Dickinson et al. (2003) Dickinson, M., et al., ‘The Mass of Galaxies at Low and High Redshift’, Proceedings of the European Southern Observatory and Universitäts-Sternwarte München Workshop, Held in Venice, Italy, 24-26 October 2001, ESO ASTROPHYSICS SYMPOSIA. ISBN 3-540-00205-7. Eds R. Bender and A. Renzini. Springer-Verlag, 2003, p. 324
- Dickinson et al. (2007) Dickinson, M., et al., 2007, AAS, 211, 5216
- Downes et al. (1986) Downes, A. J. B., Peacock, J. A., Savage, A., & Carrie, D. R., 1986, MNRAS, 218, 31
- Dunne et al. (2000) Dunne, L., Eales, S. A., Edmunds, M., Ivison, R., Alexander, P., Clements, D. L., 2000, MNRAS, 315, 115
- Dunne, Eales & Edmunds (2003) Dunne, L., Eales, S. A., & Edmunds, M. G., 2003, MNRAS, 341, 589
- Dye et al. (2007) Dye, S., Eales S., Ashby M., Huang J.-S., Egami E., Brodwin M., Lilly S., & Webb T., 2007, MNRAS, 375, 725
- Dye et al. (2008) Dye, S., et al., 2008, MNRAS, 386, 1107
- Eales et al. (2009) Eales, S. A., et al., 2009, ApJ, submitted
- Fixsen et al. (1998) Fixsen, D.J., Dwek, E., Mather, J.C., Bennet, C.L., & Shafer, R.A., 1998, ApJ, 508, 123
- Hauser & Dwek (2001) Hauser, M. G. & Dwek E., 2001, ARA&A, 39, 249
- Holland et al. (1999) Holland, W. S., et al., 1999, 303, 659
- Hughes et al. (1997) Hughes, D. H., Dunlop, J. S. & Rawlings, S., 1997, MNRAS, 289, 766
- Hughes et al. (1998) Hughes, D. H., et al., 1998, Nature, 394, 241
- Ivison et al. (2007) Ivison, R. J., et al., 2007, MNRAS, 380, 199
- Kovacs et al. (2006) Kovacs, A., Chapman, S. C., Dowell, C. D., Blain, A. W., Ivison, R. J., Smail, I., Phillips, T. G., 2006, ApJ, 650, 592
- Lagache et al. (2004) Lagache, G., et al., 2004 ApJS, 154, 112
- Lilly et al. (1999) Lilly, S., Eales, S., Gear, W., Hammer, F., Le Fèvre, O., Crampton, D., Bond, J. R., & Dunne, L., 1999, ApJ, 518, 641
- Lonsdale et al. (2004) Lonsdale, C. J., et al., 2004, ApJS, 154, 54
- Magnelli et al. (2009) Magnelli, B., Elbaz, D., Chary, R. R., Dickinson, M., Le Borgne, D., Frayer, D. T., & Willmer, C. N. A., 2009, A&A, 496, 57
- Marsden et al. (2009) Marsden, G., et al., 2009, ApJ, submitted, arXiv:0904.1205
- Miller et al. (2008) Miller, N. A., Fomalont, E. B., Kellermann, K. I., Mainieri, V., Norman, C., Padovani, P., Rosati, P., & Tozzi, P., 2008, ApJS, 179, 71
- Mortier et al. (2005) Mortier, A., et al., 2005, MNRAS, 363, 563
- Norris et al. (2006) Norris, R. P., et al., 2006, AJ, 132, 2409
- Pascale et al. (2008) Pascale, E., et al., 2008, AJ, 681, 400
- Pascale et al. (2009) Pascale, E., et al., 2009, ApJ, submitted, arXiv:0904.1206
- Patanchon et al. (2008) Patanchon, G., et al., 2008, ApJ, 681, 708
- Patanchon et al. (2009) Patanchon, G., et al., 2009, ApJ, submitted
- Rowan-Robinson et al. (2001) Rowan-Robinson, M., 2001, Proceedings of the IAU Symposium 204, ’The Extragalactic Infrared Background and its Cosmological Implications’, p.265, eds M.Harwit and M.G.Hauser
- Rowan-Robinson et al. (2008) Rowan-Robinson, M., et al., 2008, 386, 697
- Scott et al. (2002) Scott, S. E., et al., 2002, MNRAS, 331, 817
- Smail et al. (1997) Smail, I., Ivison, R.J., & Blain, A.W., 1997, ApJ, 490, L5
- Truch et al. (2008) Truch, M. D. P., et al., 2008, ApJ, 681, 415
- Truch et al. (2009) Truch, M. D. P., et al., 2009, ApJ, submitted
- Vlahakis et al. (2005) Vlahakis, C., Dunne, L. & Eales, S. A., 2005, MNRAS 364, 1253
- Wolf et al. (2004) Wolf, C., et al., 2004, A&A, 421, 913
- Younger et al. (2007) Younger, J. D., et al., 2007, ApJ, 671, 1531