A Bright Submillimeter Source in the Bullet Cluster (1E0657-56) Field Detected with BLAST
Abstract
We present the 250, 350, and 500 µm detection of bright submillimeter emission in the direction of the Bullet Cluster measured by the Balloon-borne Large-Aperture Submillimeter Telescope (BLAST). The 500 µm centroid is coincident with an AzTEC 1.1 mm point-source detection at a position close to the peak lensing magnification produced by the cluster. However, the 250 µm and 350 µm centroids are elongated and shifted toward the south with a differential shift between bands that cannot be explained by pointing uncertainties. We therefore conclude that the BLAST detection is likely contaminated by emission from foreground galaxies associated with the Bullet Cluster. The submillimeter redshift estimate based on 250–1100 µm photometry at the position of the AzTEC source is , consistent with the infrared color redshift estimation of the most likely IRAC counterpart. These flux densities indicate an apparent far-infrared luminosity of L⊙. When the amplification due to the gravitational lensing of the cluster is removed, the intrinsic far-infrared luminosity of the source is found to be L⊙, consistent with typical luminous infrared galaxies.
Subject headings:
submillimeter — galaxy clusters1. Introduction
A decade of advances in submillimeter surveys has led to a broad understanding of the galaxies responsible for the high-redshift component of the cosmic infrared background (Smail et al., 1997; Barger et al., 1998; Hughes et al., 1998; Webb et al., 2003; Greve et al., 2004; Pope et al., 2006; Coppin et al., 2006; Bertoldi et al., 2007; Knudsen et al., 2008; Devlin et al., 2009). These massive submillimeter galaxies (SMGs) are considered to be the products of galaxy mergers and are associated with a vital stage of galaxy evolution. With typical far-infrared (FIR) luminosities L⊙, they are presumed to be the high-redshift counterparts to (ultra)luminous infrared galaxies (LIRGs, ULIRGs). The source of this energy is generally attributed to powerful starbursts, suggesting star formation rates of 100–1000 M⊙ yr-1. Approximately half of these galaxies are located at (Chapman et al., 2005; Aretxaga et al., 2007), constituting a significant component of the star formation rate at this epoch (Pérez-González et al., 2005).
The increased mapping speeds of current submillimeter instruments have facilitated recent large-area blank-field surveys (Siringo et al., 2009; Devlin et al., 2009; Austermann et al., 2009). These surveys provide a large statistical sample of bright SMGs. However, resolution restricts the depth to the confusion limit and they are unable to probe the abundant faint end of the number counts. Observations directed toward massive galaxy clusters take advantage of gravitational lensing to penetrate the confusion limit and sample intrinsically fainter and higher-redshift SMGs (Smail et al., 1997; Zemcov et al., 2007; Knudsen et al., 2008).
An extremely bright millimeter source was recently reported from a survey of the Bullet Cluster conducted with the 1.1 mm AzTEC receiver on the Atacama Submillimeter Telescope Experiment (ASTE) (Wilson et al., 2008). Its millimeter properties are given in Table 1. The high apparent flux and close proximity to a critical line of magnification on the lensing model motivated the authors to conclude that the source is likely to be a background galaxy amplified by the foreground mass. This AzTEC source (MMJ0658375557.0) is coincident with a LIRG detected by IRAC (which possibly has multiple infrared images of the galaxy), with a redshift (Wilson et al., 2008; Gonzalez et al., 2009).
We present the 250, 350, and 500 µm measurements of a bright source (BLAST J065837555708) located in the direction of the Bullet Cluster. With significances 6-, 5-, and 9- at 250, 350, and 500 µm, respectively, this detection is the highest signal-to-noise source in the 0.25 deg2 map of the region taken with the Balloon-borne Large-Aperture Submillimeter Telescope (BLAST) in 2006 (Pascale et al., 2008). Details of the observations and data reduction techniques are presented in Section 2. Extracted photometry as well as a photometric redshift estimate and constraints on the intrinsic properties of the millimeter source are given in Section 3. Finally, our conclusions are summarized in Section 4.
2. Observations and Reduction
BLAST conducted an 11 day high-altitude flight from McMurdo Station, Antarctica, in December of 2006 (BLAST06). The telescope has a 1.8 m primary mirror and three large-format bolometer arrays that image the sky simultaneously at 250, 350, and 500 µm over a field of view. The telescope point spread function (PSF) at each wavelength is best fit by Gaussians with full-widths at half-maximum (FWHM) 36″, 42″, and 60″ at 250, 350, and 500 µm, respectively. BLAST scans the sky quickly ( 0.1 deg s-1) in azimuth, while drifting slowly in elevation. Details of the BLAST instrument can be found in Pascale et al. (2008). The BLAST wavelengths were selected to sample the peak of the spectral energy distribution for high-redshift starburst galaxies as well as cooler star-forming regions within our own Galaxy.
A large portion of the BLAST06 flight ( 150/220 hours) was dedicated to conducting large-area, wide and deep blank-field surveys to identify and characterize the high-redshift population of starburst galaxies that comprise the FIR extra-galactic background (Devlin et al., 2009). Two smaller fields were also targeted which are known to contain massive galaxy clusters, including a 1.1 deg2 map around Abell 3112 and a 0.25 deg2 map around the Bullet Cluster. The Bullet Cluster field was visited three times during the flight, with a total observing time of 2.0 hours.
The raw BLAST06 time-stream data are reduced using a common pipeline detailed in Pascale et al. (2008) and Truch et al. (2008). The absolute calibration of the BLAST06 data is determined based on observations of the star VY CMa with 10%–13% uncertainty which is highly correlated between bands (Truch et al., 2009). Signal and variance maps of the Bullet Cluster with 10″ pixels are generated using the mapmaking algorithm OptBin (Pascale et al., in prep). The rotation of the sky between visits to the field provided cross-linking between azimuthal scans. This shallow angle is insufficient to constrain low frequency drifts in the detectors and preliminary maps suffered from significant striping along the telescope scan direction. In order to suppress these artifacts, the time-stream data are filtered by the map maker, whitening the map on scales 16′. The appropriate PSF for each band is produced by stacking maps of VY Cma, co-added with the the proper sky rotation, and filtered in the same manner as the final maps to enable accurate source extraction and calibration111Maps and PSFs for the field are available to download from http://blastexperiment.info. A catalog of sources for each band is compiled using a source-finding algorithm which selects the peaks in a smoothed map produced by the noise-weighted convolution of the image with the PSF. The peak positions in each band associated with BLAST J065837555708 are given in Table 2.
The telescope pointing solution is reconstructed post-flight by combining 100 Hz rate gyroscope data with 1 Hz star camera solutions which provide an absolute reference (Pascale et al., 2008). The star cameras are mounted to the same rigid structure as the telescope. Nevertheless, tilting the structure in elevation results in small changes to the angular offset between the boresights. To correct this effect, bright compact objects were targeted as pointing calibrators at different elevations throughout the flight. The resulting 1- pointing uncertainty over the elevation range of observed calibrators (30∘–50∘) is 5″. Observations of the Bullet Cluster were performed at high elevation (), outside the range of our pointing calibrators. They were also conducted early in the flight, before the telescope focus had been finalized. While these factors lead us to suspect larger absolute pointing uncertainties for sources in the Bullet Cluster field, the optical design of BLAST does not allow for relative offsets between the bands.
The absolute pointing offset for the BLAST maps of the Bullet Cluster is determined by stacking them against positions of 24 µm sources. This 24 µm catalog contains sources with a significance 3- extracted from the Spitzer MIPS observations of the field using the APEX source-finding algorithm (Makovoz et al., 2002). At 250 µm, this analysis produces the highest signal-to-noise, indicating a 27″ astrometry correction required for the BLAST maps. The corrected peak positions of BLAST J065837555708 are given in Table 2.
3. Analysis
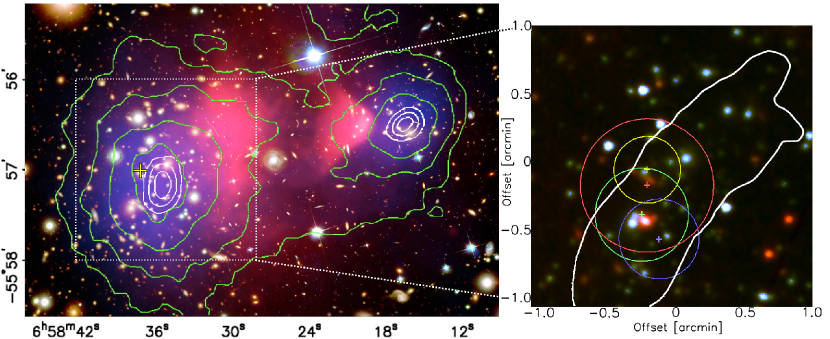
The Bullet Cluster, at redshift (Tucker et al., 1998), is the product of two merging galaxy clusters. The less massive member has passed through the dominant mass with a relative velocity of 4500 km s-1. This extreme interaction emphasizes the displacement between the mass of the cluster, traced by weak lensing models, and the hot X-ray gas, providing dramatic evidence for the presence of dark matter (Clowe et al., 2004). Figure 1 shows maps of the Bullet Cluster at optical, X-ray, and infrared wavelengths. The image in the left-hand panel combines optical maps from Magellan and the Hubble Space Telescope (HST) (Clowe et al., 2004) with Chandra X-ray data (Markevitch et al., 2002). The X-ray emission reveals hot gas that represents the majority of the baryonic matter in the cluster (shown in pink). The distribution of the dark matter is shown in blue with weak lensing contours over-plotted in green (Clowe et al., 2006). The yellow cross marks the position of the AzTEC point-source detection at 1.1 mm, near the peak of the largest mass distribution.
The right-hand panel of Figure 1 shows a detail of the region. The color image is produced from Spitzer IRAC 3.6, 4.5, and 8.0 µm maps. The BLAST centroids at 250, 350, and 500 µm are shown in blue, green, and red, respectively. The AzTEC 1.1 mm position is shown in yellow. Each cross indicates the position of the peak BLAST detection, with circles representing the FWHM of each beam. It is apparent that the relative offsets between the BLAST beams is inconsistent with the 5″ pointing error determined in other BLAST06 maps Pascale et al. (2008); Devlin et al. (2009). We therefore consider the possibility that the centroids are shifted due to emission from a combination of galaxies at different redshifts, slightly displaced along the line-of-sight.
3.1. Photometry
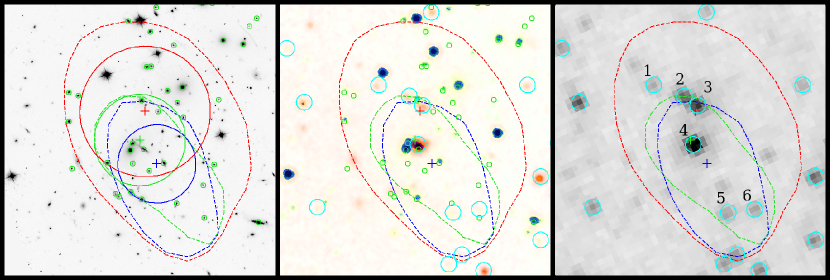
The displacement of the BLAST centroid positions from the location of the millimeter source increases with frequency and detections are elongated in the direction of that displacement. These features are illustrated in Figure 2, showing a detailed 2′ 2′ region around BLAST J065837555708. The differential shift between bands suggests emission from other galaxies with small angular offsets to the line-of-sight, south of the AzTEC source. The central panel of Figure 2 is a composite of IRAC 3.6, 4.5, and 8.0 µm images. The maps reveal multiple cluster member galaxies that may be contributing flux to the BLAST submillimeter measurements and shifting the centroid positions away from the background LIRG. For a galaxy contained within the Bullet Cluster (), BLAST colors sample the Rayleigh-Jeans side of the SED. This emission scales as , and would contribute to the BLAST bands in a form consistent with the observations. The MIPS 24 µm map is shown in the right-hand panel of Figure 2, with cyan circles around 5- sources. Those located within the 3- flux density contours of the BLAST emission are numbered and infrared photometry extracted for each using the APEX pipeline is given in Table 3. Though a number of these galaxies likely contribute to the submillimeter detection, sources 2, 3, and 4 clearly dominate the emission at 24 µm and line up with the centroid peaks of the submillimeter maps. Sources 2 and 3 are likely double images of the lensed background LIRG (Wilson et al., 2008; Gonzalez et al., 2009), while Source 4 is a spectroscopically confirmed cluster member (Mehlert et al., 2001). We estimate the submillimeter flux densities of each of the lensed high-redshift millimeter source detected by AzTEC and the foreground dominant cluster member galaxy by simultaneously fitting the PSF to the BLAST maps at the positions of both sources using the maximum-likelihood algorithm presented in Scott et al. (2002). Because the mid-infrared images of the lensed LIRG are closely spaced compared to the scale of the resolution, we adopt the millimeter position of Wilson et al (2008) for this component in the joint-fit. The submillimeter photometry of the LIRG and the bright cluster member galaxy are given in Table 4 and Table 5 respectively. The measured 500 µm emission is dominated by an association with the millimeter AzTEC source. However, our estimates of the shorter wavelength contributions to the flux densities at 250 and 350 µm favor the cluster member galaxy as the dominant source of emission. Consequently, the observed submillimeter spectrum of the background LIRG is flattened across the BLAST bands.
Submillimeter emission in this region is not confined to compact sources. IRAS maps reveal foreground cirrus emission of 5 MJy sr-1 at 100 µm. However, this structure is smooth on scales of and therefore filtered out of the BLAST maps. The measured BLAST flux densities are adjusted to account for a small contamination by the thermal Sunyaev-Zel’dovich effect (SZE). This excess flux density results from the hot gas in the cluster boosting cosmic microwave background photons to higher energies through inverse Compton scattering. Following Wilson et al. (2008), we estimate the SZE flux contribution to the BLAST bands at the position of the AzTEC detection by developing a model to describe the electron density distribution of the Bullet Cluster. We assume a two-component spherically-symmetric -model () and a range of total cluster-mass, – M⊙, distributed in a 3:1 ratio (Nusser, 2008) between the main and sub-clusters. Each component is centered at the peak of the corresponding observed X-ray surface brightness distribution given by Clowe et al. (2006). Provided that the electron temperature is similar to the X-ray gas temperature, and assuming each component is isothermal, we estimate electron temperatures – keV for the main cluster and – keV for the sub-cluster, in agreement with the temperature map provided by Markevitch et al. (2002). Relativistic corrections were applied using the analytical approximation given by Itoh et al. (1998). The results of these simulations and our revised source flux densities are given in Table 4. We have also used this model to estimate the SZE at the position of the bright cluster member galaxy and these results are shown in Table 5.
3.1.1 Photometric Redshifts
The shape of the spectral energy distribution (SED) in the submillimeter regime can be used to estimate the redshift of the source. The BLAST bands were chosen to optimize constraints on the FIR peak of the bright submillimeter galaxy population at . A Monte Carlo photometric redshift method has been developed (Hughes et al., 2002; Aretxaga et al., 2003) to take into account constraining prior information such as a range of local SED templates and the evolving luminosity function to .
In accordance with this method, we generate SEDs for a catalog of galaxies based on an evolutionary model for the 60 µm luminosity function that fits the observed 850 µm number counts (e.g. luminosity evolution for , and no evolution at ) and covers a simulated area of . Template SEDs are drawn at random from a library of local starbursts, ULIRGs, and AGN to provide FIR–radio fluxes. The SEDs cover a wide range of FIR luminosities (– L⊙) and temperatures (25–65 K). The photometric and calibration uncertainties of the BLAST and AzTEC measurements are included in the fluxes of the mock galaxies. We adopt a conservative estimate for the amplification of the source () (Wilson et al., 2008; Gonzalez et al., 2009), and reject mock galaxies with fluxes below the detection threshold of the survey. The redshift probability distribution of the source is then calculated as the normalized distribution of the redshifts of the mock galaxies in the catalog, weighted by the likelihood of identifying the colors and fluxes of each mock galaxy with those of the source.
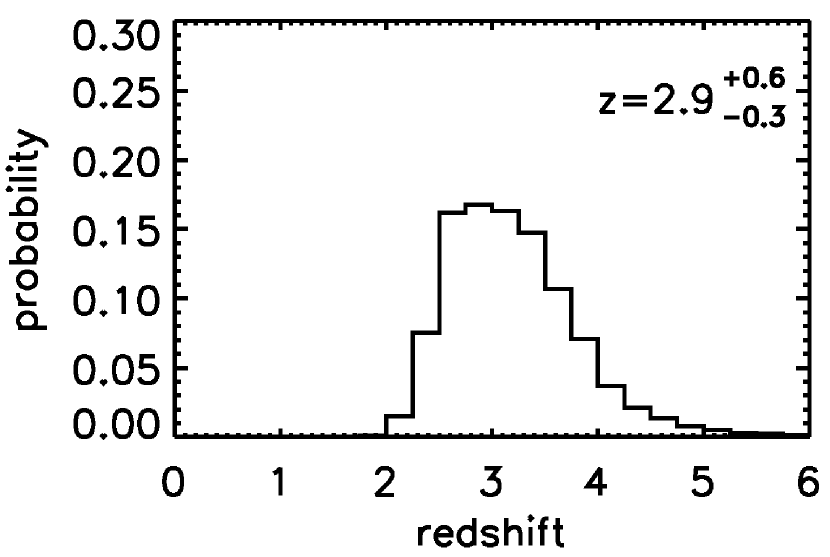
Figure 3 shows the results of this analysis indicating a photometric redshift . This estimate is consistent with the IR-color redshift estimation () for the most likely IRAC counterpart (Wilson et al., 2008; Gonzalez et al., 2009). The accuracy of the technique has been experimentally tested for galaxies detected in at least 3 bands in the rest-frame radio to FIR interval, yielding a typical 1- error over the regime (Aretxaga et al., 2007).
3.1.2 Intrinsic Properties
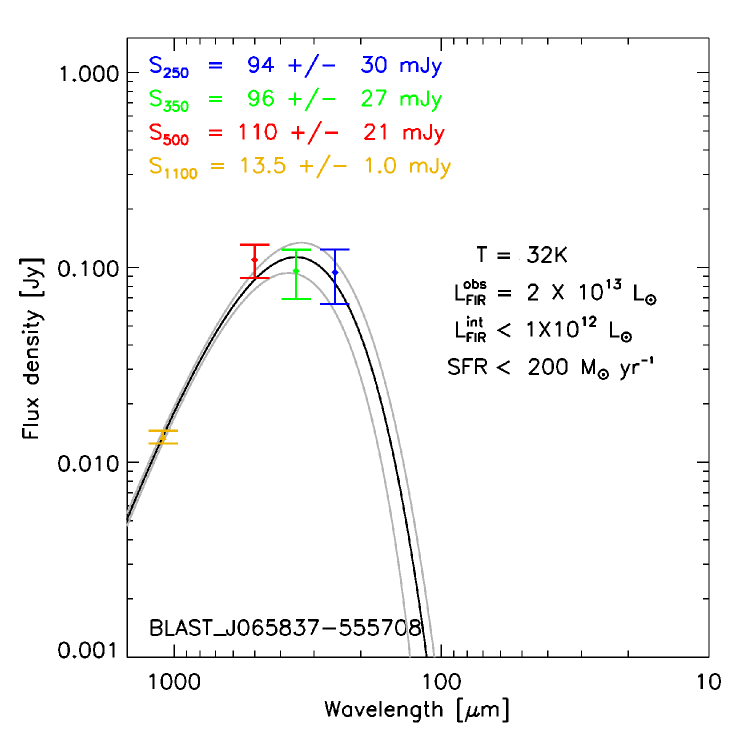
With an estimate of its redshift, we can derive properties intrinsic to the submillimeter galaxy. Figure 4 shows a single-temperature modified blackbody SED of the form
| (1) |
where is the flux density, is the amplitude, is the dust emissivity index, is fixed at µm, and is the Planck blackbody radiation function for a source with temperature . The function is fit to the data using a minimization routine, after subtracting the contribution from SZE and an estimate of the contribution from the brightest mid-infrared cluster member galaxy, as discussed previously. The grey curves indicate the 1- range of temperature and amplitudes for the fit estimated from 200 Monte Carlo simulations. The value of is fixed here at , but the fits give very similar values of and if we use . The best-fit temperature of the distant lensed source is 32 K. This SED is consistent with those fit to submillimeter galaxies observed in regular blank-field surveys (Chapman et al., 2005; Kovács et al., 2006; Aretxaga et al., 2007; Dye et al., 2009). This spectral information also enables a color correction to the flux densities which accounts for the profiles and widths of the BLAST filters (Truch et al., 2008). These color corrected flux densities are given in Table 4. is the FIR luminosity, calculated in the wavelength range – µm (Kennicutt, 1998), for the observed flux densities without considering gravitational lensing effects. Using the previously assumed lower limit for the amplitude of the lensing magnification (), we derive an upper limit for the intrinsic FIR luminosity of L⊙. This value is consistent with estimates presented by the AzTEC team (Wilson et al., 2008) as well as from extrapolation of the 24 µm luminosity (Gonzalez et al., 2009), and qualifies the source as a LIRG. This intrinsic luminosity implies an upper limit on the star formation rate of 200 M⊙ yr-1 (Kennicutt, 1998). The source is relatively faint compared to typical submillimeter-selected galaxies with similar dust temperatures (Blain et al., 2003; Kovács et al., 2006; Dye et al., 2009), and is more consistent with the luminosity-temperature relationship observed in IRAS-selected samples (Soifer et al., 1991; Blain et al., 2003; Chapman et al., 2003; Chapin et al., 2009).
4. Conclusions
BLAST submillimeter maps of the Bullet Cluster have revealed bright emission near the peak of the weak lensing contours (Clowe et al., 2006). The position of the detection coincides with the AzTEC 1.1 mm source MMJ0658375557.0 and a multiply-imaged LIRG detected in the Spitzer IRAC maps (Wilson et al., 2008; Gonzalez et al., 2009). The systematic offsets in peak emission between the BLAST bands motivates the likely interpretation that multiple sources are confused at BLAST resolution. We have performed a simultaneous fit to the brightest two infrared galaxies in the field in order to estimate the properties of the background LIRG. The resulting color corrected flux densities for the the source are , , and mJy.
The BLAST colors sample the peak of the source spectrum, and 250–1100 µm flux densities place strong constraints on its photometric redshift. Using a Monte Carlo photometric redshift method (Hughes et al., 2002; Aretxaga et al., 2003), we have calculated a redshift . The redshift probability distribution is inconsistent with the redshift of the Bullet Cluster (), ruling out the possibility that the millimeter AzTEC source is associated with the foreground mass. Assuming the best-fit photometric redshift we have derived the observed FIR luminosity of the source, in the absence of lensing; to be L⊙. The proximity of the source to a critical line in the lensing model (Bradač et al., 2006; Gonzalez et al., 2009) puts a lower limit on the amplitude of magnification due to gravitational lensing by the cluster. This imposes an upper limit on the intrinsic luminosity of the SMG, L⊙. This luminosity is consistent with estimates from Wilson et al. (2008) and Gonzalez et al. (2009), and characterizes the source as a LIRG, a member of the fainter population of SMGs that dominate the number counts but are difficult to detect with the limited resolution of existing submillimeter telescopes.
The challenges in interpreting the BLAST maps demonstrate the necessity of including complementary, higher resolution data sets in the analysis. BLAST is a precursor to the Spectral and Photometric Imaging Receiver (SPIRE) on the recently launched Herschel Space Observatory (Griffin et al., 2006). With nearly twice the resolution, and gains in sensitivity, SPIRE will be able to provide significantly better centroiding accuracy. Nevertheless, access to infrared and millimeter data sets will still be integral to a more complete understanding of these crowded systems.
We acknowledge the support of NASA through grant numbers NAG5-12785, NAG5- 13301, and NNGO-6GI11G, the NSF Office of Polar Programs, the Canadian Space Agency, the Natural Sciences and Engineering Research Council (NSERC) of Canada, and the UK Science and Technology Facilities Council (STFC). We thank Tony Mroczkowski for his help with the SZE simulations. This research has been enabled by the use of WestGrid computing resources. This research also made use of the SIMBAD database, observations made with the Spitzer Space Telescope, which is operated by the Jet Propulsion Laboratory, California Institute of Technology under a contract with NASA, and SAOImage DS9, developed by Smithsonian Astrophysical Observatory.
| Flux Density | 13.5 1.0 mJy |
|---|---|
| RA Centroid Position | (J2000) |
| Dec Centroid Position | (J2000) |
Note. — 1.1 mm flux density and centroid position of MMJ0658375557.0 from Wilson et al. (2008).
| Before Correction | After Correction | |||
|---|---|---|---|---|
| Centroid RA | Centroid Dec | Centroid RA | Centroid Dec | |
| [] | [h:m:s] | [d:m:s] | [h:m:s] | [d:m:s] |
| 250 | 06:58:35.3 | 55:57:08 | 06:58:36.7 | 55:57:33 |
| 350 | 06:58:36.2 | 55:56:58 | 06:58:36.6 | 55:57:22 |
| 500 | 06:58:36.0 | 55:56:44 | 06:58:37.3 | 55:57:09 |
Note. — Positions of the peaks in each band associated with BLAST J065837555708. The positions are given before and after the correctional offset applied based on stacking the 250 µm map against 24 µm sources.
| ID | 24 µm RA | 24 µm Dec | S3.6 | S4.5 | S5.8 | S8.0 | S24 |
|---|---|---|---|---|---|---|---|
| [Hours] | [Degrees] | [Jy] | [Jy] | [Jy] | [Jy] | [Jy] | |
| 1 | 6:58:39.69 | 55:56:56 | 18.6 0.2 | 26.2 0.3 | 70.6 1.1 | 40.0 1.9 | 252.7 37.2 |
| 2 | 6:58:37.99 | 55:57:01 | 19.1 0.2 | 25.7 0.3 | 76.5 1.1 | 60.5 1.9 | 596.2 34.9 |
| 3 | 6:58:37.21 | 55:57:06 | 28.5 0.2 | 49.0 0.3 | 69.2 1.1 | 86.9 2.0 | 840.4 36.4 |
| 4 | 6:58:37.40 | 55:57:24 | 309.6 0.5 | 269.5 0.5 | 190.4 1.3 | 528.3 2.1 | 1482.0 34.8 |
| 5 | 6:58:35.62 | 55:57:55 | 72.0 0.2 | 47.4 0.3 | 60.2 1.1 | 25.6 1.9 | 306.4 37.4 |
| 6 | 6:58:34.09 | 55:57:54 | 32.5 0.2 | 23.0 0.3 | 41.9 1.1 | 18.4 1.9 | 285.0 36.5 |
Note. — IR photometry corresponding to the 24 µm sources located within the BLAST 3- contours which have a significance of 5-.
| Measured Flux | SZE | SZE Corrected Flux | Color Corrected Flux | |
|---|---|---|---|---|
| [µm] | [mJy] | [mJy] | [mJy] | [mJy] |
| 250 | 91 27 | 0.15 0.03 | 91 27 | 94 30 |
| 350 | 95 24 | 1.1 0.2 | 94 24 | 96 27 |
| 500 | 121 16 | 10.6 1.7 | 110 16 | 110 21 |
Note. — Flux densities in each band associated with BLAST J065837555708 at the position of the AzTEC detection. The contribution from SZE is calculated at the position of the AzTEC point source, based on the theoretical model outlined in Wilson et al. (2008). This small contamination is subtracted from the measured fluxes for further analysis. The monochromatic flux densities based on the best-fit SED are given in the final column.
| Measured Flux | SZE | SZE Corrected Flux | Color Corrected Flux | |
|---|---|---|---|---|
| [µm] | [mJy] | [mJy] | [mJy] | [mJy] |
| 250 | 129 26 | 0.13 0.03 | 129 26 | 131 30 |
| 350 | 104 23 | 1.0 0.2 | 103 23 | 106 27 |
| 500 | 49 18 | 9.4 1.5 | 40 18 | 38 18 |
References
- Aretxaga et al. [2003] I. Aretxaga, D. H. Hughes, E. L. Chapin, E. Gaztañaga, J. S. Dunlop, and R. J. Ivison. Breaking the ‘redshift deadlock’- II. The redshift distribution for the submillimetre population of galaxies. MNRAS, 342:759–801, July 2003. 10.1046/j.1365-8711.2003.06560.x.
- Aretxaga et al. [2007] I. Aretxaga, D. H. Hughes, K. Coppin, A. M. J. Mortier, J. Wagg, J. S. Dunlop, E. L. Chapin, S. A. Eales, E. Gaztañaga, M. Halpern, R. J. Ivison, E. van Kampen, D. Scott, S. Serjeant, I. Smail, T. Babbedge, A. J. Benson, S. Chapman, D. L. Clements, L. Dunne, S. Dye, D. Farrah, M. J. Jarvis, R. G. Mann, A. Pope, R. Priddey, S. Rawlings, M. Seigar, L. Silva, C. Simpson, and M. Vaccari. The SCUBA Half Degree Extragalactic Survey - IV. Radio-mm-FIR photometric redshifts. MNRAS, 379:1571–1588, August 2007. 10.1111/j.1365-2966.2007.12036.x.
- Austermann et al. [2009] J. E. Austermann, J. S. Dunlop, T. A. Perera, K. S. Scott, G. W. Wilson, I. Aretxaga, D. H. Hughes, O. Almaini, E. L. Chapin, S. C. Chapman, M. Cirasuolo, D. L. Clements, K. E. K. Coppin, L. Dunne, S. Dye, S. A. Eales, E. Egami, D. Farrah, D. Ferrusca, S. Flynn, D. Haig, M. Halpern, E. Ibar, R. J. Ivison, E. van Kampen, Y. Kang, S. Kim, C. Lacey, J. D. Lowenthal, P. D. Mauskopf, R. J. McLure, A. M. J. Mortier, M. Negrello, S. Oliver, J. A. Peacock, A. Pope, S. Rawlings, G. Rieke, I. Roseboom, M. Rowan-Robinson, D. Scott, S. Serjeant, I. Smail, A. M. Swinbank, J. A. Stevens, M. Velazquez, J. Wagg, and M. S. Yun. AzTEC Half Square Degree Survey of the SHADES Fields – I. Maps, Catalogues, and Source Counts. ArXiv e-prints, July 2009.
- Barger et al. [1998] A. J. Barger, L. L. Cowie, D. B. Sanders, E. Fulton, Y. Taniguchi, Y. Sato, K. Kawara, and H. Okuda. Submillimetre-wavelength detection of dusty star-forming galaxies at high redshift. Nature, 394:248–251, July 1998. 10.1038/28338.
- Bertoldi et al. [2007] F. Bertoldi, C. Carilli, M. Aravena, E. Schinnerer, H. Voss, V. Smolcic, K. Jahnke, N. Scoville, A. Blain, K. M. Menten, D. Lutz, M. Brusa, Y. Taniguchi, P. Capak, B. Mobasher, S. Lilly, D. Thompson, H. Aussel, E. Kreysa, G. Hasinger, J. Aguirre, J. Schlaerth, and A. Koekemoer. COSBO: The MAMBO 1.2 Millimeter Imaging Survey of the COSMOS Field. ApJS, 172:132–149, September 2007. 10.1086/520511.
- Blain et al. [2003] A. W. Blain, V. E. Barnard, and S. C. Chapman. Submillimetre and far-infrared spectral energy distributions of galaxies: the luminosity-temperature relation and consequences for photometric redshifts. MNRAS, 338:733–744, January 2003. 10.1046/j.1365-8711.2003.06086.x.
- Bradač et al. [2006] M. Bradač, D. Clowe, A. H. Gonzalez, P. Marshall, W. Forman, C. Jones, M. Markevitch, S. Randall, T. Schrabback, and D. Zaritsky. Strong and Weak Lensing United. III. Measuring the Mass Distribution of the Merging Galaxy Cluster 1ES 0657-558. ApJ, 652:937–947, December 2006. 10.1086/508601.
- Chapin et al. [2009] E. L. Chapin, D. H. Hughes, and I. Aretxaga. The local far-infrared galaxy colour-luminosity distribution: a reference for BLAST and Herschel/SPIRE submillimetre surveys. MNRAS, 393:653–662, February 2009. 10.1111/j.1365-2966.2008.14242.x.
- Chapman et al. [2003] S. C. Chapman, G. Helou, G. F. Lewis, and D. A. Dale. The Bivariate Luminosity-Color Distribution of IRAS Galaxies and Implications for the High-Redshift Universe. ApJ, 588:186–198, May 2003. 10.1086/374038.
- Chapman et al. [2005] S. C. Chapman, A. W. Blain, I. Smail, and R. J. Ivison. A Redshift Survey of the Submillimeter Galaxy Population. ApJ, 622:772–796, April 2005. 10.1086/428082.
- Clowe et al. [2004] D. Clowe, A. Gonzalez, and M. Markevitch. Weak-Lensing Mass Reconstruction of the Interacting Cluster 1E 0657-558: Direct Evidence for the Existence of Dark Matter. ApJ, 604:596–603, April 2004. 10.1086/381970.
- Clowe et al. [2006] D. Clowe, M. Bradač, A. H. Gonzalez, M. Markevitch, S. W. Randall, C. Jones, and D. Zaritsky. A Direct Empirical Proof of the Existence of Dark Matter. ApJ, 648:L109–L113, September 2006. 10.1086/508162.
- Coppin et al. [2006] K. Coppin, E. L. Chapin, A. M. J. Mortier, S. E. Scott, C. Borys, J. S. Dunlop, M. Halpern, D. H. Hughes, A. Pope, D. Scott, S. Serjeant, J. Wagg, D. M. Alexander, O. Almaini, I. Aretxaga, T. Babbedge, P. N. Best, A. Blain, S. Chapman, D. L. Clements, M. Crawford, L. Dunne, S. A. Eales, A. C. Edge, D. Farrah, E. Gaztañaga, W. K. Gear, G. L. Granato, T. R. Greve, M. Fox, R. J. Ivison, M. J. Jarvis, T. Jenness, C. Lacey, K. Lepage, R. G. Mann, G. Marsden, A. Martinez-Sansigre, S. Oliver, M. J. Page, J. A. Peacock, C. P. Pearson, W. J. Percival, R. S. Priddey, S. Rawlings, M. Rowan-Robinson, R. S. Savage, M. Seigar, K. Sekiguchi, L. Silva, C. Simpson, I. Smail, J. A. Stevens, T. Takagi, M. Vaccari, E. van Kampen, and C. J. Willott. The SCUBA Half-Degree Extragalactic Survey - II. Submillimetre maps, catalogue and number counts. MNRAS, 372:1621–1652, November 2006. 10.1111/j.1365-2966.2006.10961.x.
- Devlin et al. [2009] Mark J. Devlin, Peter A. R. Ade, Itziar Aretxaga, James J. Bock, Edward L. Chapin, Matthew Griffin, Joshua O. Gundersen, Mark Halpern, Peter C. Hargrave, David H. Hughes, Jeff Klein, Gaelen Marsden, Peter G. Martin, Philip Mauskopf, Lorenzo Moncelsi, Calvin B. Netterfield, Henry Ngo, Luca Olmi, Enzo Pascale, Guillaume Patanchon, Marie Rex, Douglas Scott, Christopher Semisch, Nicholas Thomas, Matthew D. P. Truch, Carole Tucker, Gregory S. Tucker, Marco P. Viero, and Donald V. Wiebe. Over half of the far-infrared background light comes from galaxies at . Nature, 458:737–739, April 2009. 10.1038/nature07918.
- Dye et al. [2009] S. Dye, P. A. R. Ade, J. J. Bock, E. L. Chapin, M. J. Devlin, J. S. Dunlop, S. A. Eales, M. Griffin, J. O. Gundersen, M. Halpern, P. C. Hargrave, D. H. Hughes, J. Klein, B. Magnelli, G. Marsden, P. Mauskopf, L. Moncelsi, C. B. Netterfield, L. Olmi, E. Pascale, G. Patanchon, M. Rex, D. Scott, C. Semisch, T. Targett, N. Thomas, M. D. P. Truch, C. Tucker, G. S. Tucker, M. P. Viero, and D. V. Wiebe. Radio and mid-infrared identification of BLAST source counterparts in the Chandra Deep Field South. ApJ, accepted for publication, July 2009.
- Gonzalez et al. [2009] A. H. Gonzalez, D. Clowe, M. Bradač, D. Zaritsky, C. Jones, and M. Markevitch. A Multiply Imaged Luminous Infrared Galaxy Behind the Bullet Cluster (1E0657-56). ApJ, 691:525–530, January 2009. 10.1088/0004-637X/691/1/525.
- Greve et al. [2004] T. R. Greve, R. J. Ivison, F. Bertoldi, J. A. Stevens, J. S. Dunlop, D. Lutz, and C. L. Carilli. A 1200-m MAMBO survey of ELAISN2 and the Lockman Hole - I. Maps, sources and number counts. MNRAS, 354:779–797, November 2004. 10.1111/j.1365-2966.2004.08235.x.
- Griffin et al. [2006] M. Griffin, A. Abergel, P. Ade, P. André, J.-P. Baluteau, J. Bock, A. Franceschini, W. Gear, J. Glenn, D. Griffin, K. King, E. Lellouch, D. Naylor, G. Olofsson, I. Perez-Fournon, M. Rowan-Robinson, P. Saraceno, E. Sawyer, A. Smith, B. Swinyard, L. Vigroux, and G. Wright. Herschel-SPIRE: design, performance, and scientific capabilities. In Society of Photo-Optical Instrumentation Engineers (SPIE) Conference Series, volume 6265 of Society of Photo-Optical Instrumentation Engineers (SPIE) Conference Series, July 2006. 10.1117/12.670783.
- Hughes et al. [1998] D. H. Hughes, S. Serjeant, J. Dunlop, M. Rowan-Robinson, A. Blain, R. G. Mann, R. Ivison, J. Peacock, A. Efstathiou, W. Gear, S. Oliver, A. Lawrence, M. Longair, P. Goldschmidt, and T. Jenness. High-redshift star formation in the Hubble Deep Field revealed by a submillimetre-wavelength survey. Nature, 394:241–247, July 1998. 10.1038/28328.
- Hughes et al. [2002] D. H. Hughes, I. Aretxaga, E. L. Chapin, E. Gaztañaga, J. S. Dunlop, M. J. Devlin, M. Halpern, J. Gundersen, J. Klein, C. B. Netterfield, L. Olmi, D. Scott, and G. Tucker. Breaking the ‘redshift deadlock’- I. Constraining the star formation history of galaxies with submillimetre photometric redshifts. MNRAS, 335:871–882, October 2002. 10.1046/j.1365-8711.2002.05670.x.
- Itoh et al. [1998] N. Itoh, Y. Kohyama, and S. Nozawa. Relativistic Corrections to the Sunyaev-Zeldovich Effect for Clusters of Galaxies. ApJ, 502:7–15, July 1998. 10.1086/305876.
- Kennicutt [1998] R. C. Kennicutt, Jr. Star Formation in Galaxies Along the Hubble Sequence. ARA&A, 36:189–232, 1998. 10.1146/annurev.astro.36.1.189.
- Knudsen et al. [2008] K. K. Knudsen, P. P. van der Werf, and J.-P. Kneib. Probing the submillimetre number counts at . MNRAS, 384:1611–1626, March 2008. 10.1111/j.1365-2966.2007.12820.x.
- Kovács et al. [2006] A. Kovács, S. C. Chapman, C. D. Dowell, A. W. Blain, R. J. Ivison, I. Smail, and T. G. Phillips. SHARC-2 350 m Observations of Distant Submillimeter-selected Galaxies. ApJ, 650:592–603, October 2006. 10.1086/506341.
- Makovoz et al. [2002] D. Makovoz, M. Moshir, R. Laher, and K. Marsh. APEX: A Point Source Extractor for SIRTF. In D. A. Bohlender, D. Durand, and T. H. Handley, editors, Astronomical Data Analysis Software and Systems XI, volume 281 of Astronomical Society of the Pacific Conference Series, pages 417–420, 2002.
- Markevitch et al. [2002] M. Markevitch, A. H. Gonzalez, L. David, A. Vikhlinin, S. Murray, W. Forman, C. Jones, and W. Tucker. A Textbook Example of a Bow Shock in the Merging Galaxy Cluster 1E 0657-56. ApJ, 567:L27–L31, March 2002. 10.1086/339619.
- Mehlert et al. [2001] D. Mehlert, S. Seitz, R. P. Saglia, I. Appenzeller, R. Bender, K. J. Fricke, T. L. Hoffmann, U. Hopp, R.-P. Kudritzki, and A. W. A. Pauldrach. Gravitationally lensed high redshift galaxies in the field of 1E0657-56. A&A, 379:96–106, November 2001. 10.1051/0004-6361:20011286.
- Nusser [2008] A. Nusser. Back-in-time dynamics of the cluster IE 0657-56 (the Bullet system). MNRAS, 384:343–347, February 2008. 10.1111/j.1365-2966.2007.12716.x.
- Pascale et al. [2008] E. Pascale, P. A. R. Ade, J. J. Bock, E. L. Chapin, J. Chung, M. J. Devlin, S. Dicker, M. Griffin, J. O. Gundersen, M. Halpern, P. C. Hargrave, D. H. Hughes, J. Klein, C. J. MacTavish, G. Marsden, P. G. Martin, T. G. Martin, P. Mauskopf, C. B. Netterfield, L. Olmi, G. Patanchon, M. Rex, D. Scott, C. Semisch, N. Thomas, M. D. P. Truch, C. Tucker, G. S. Tucker, M. P. Viero, and D. V. Wiebe. The Balloon-borne Large Aperture Submillimeter Telescope: BLAST. ApJ, 681:400–414, July 2008. 10.1086/588541.
- Pérez-González et al. [2005] P. G. Pérez-González, G. H. Rieke, E. Egami, A. Alonso-Herrero, H. Dole, C. Papovich, M. Blaylock, J. Jones, M. Rieke, J. Rigby, P. Barmby, G. G. Fazio, J. Huang, and C. Martin. Spitzer View on the Evolution of Star-forming Galaxies from z = 0 to z 3. ApJ, 630:82–107, September 2005. 10.1086/431894.
- Pope et al. [2006] A. Pope, D. Scott, M. Dickinson, R.-R. Chary, G. Morrison, C. Borys, A. Sajina, D. M. Alexander, E. Daddi, D. Frayer, E. MacDonald, and D. Stern. The Hubble Deep Field-North SCUBA Super-map - IV. Characterizing submillimetre galaxies using deep Spitzer imaging. MNRAS, 370:1185–1207, August 2006. 10.1111/j.1365-2966.2006.10575.x.
- Scott et al. [2002] S. E. Scott, M. J. Fox, J. S. Dunlop, S. Serjeant, J. A. Peacock, R. J. Ivison, S. Oliver, R. G. Mann, A. Lawrence, A. Efstathiou, M. Rowan-Robinson, D. H. Hughes, E. N. Archibald, A. Blain, and M. Longair. The SCUBA 8-mJy survey - I. Submillimetre maps, sources and number counts. MNRAS, 331:817–838, April 2002. 10.1046/j.1365-8711.2002.05193.x.
- Siringo et al. [2009] G. Siringo, E. Kreysa, A. Kovacs, F. Schuller, A. Weiss, W. Esch, H. P. Gemuend, N. Jethava, G. Lundershausen, A. Colin, R. Guesten, K. M. Menten, A. Beelen, F. Bertoldi, J. W. Beeman, and E. E. Haller. The Large APEX Bolometer Camera LABOCA. A&A, accepted for publication, March 2009.
- Smail et al. [1997] I. Smail, R. J. Ivison, and A. W. Blain. A Deep Sub-millimeter Survey of Lensing Clusters: A New Window on Galaxy Formation and Evolution. ApJ, 490:L5–L8, November 1997. 10.1086/311017.
- Soifer et al. [1991] B. T. Soifer, G. Neugebauer, J. R. Graham, K. Matthews, J. M. Mazzarella, C. J. Lonsdale, M. Rowan-Robinson, T. Broadhurst, A. Lawrence, and R. McMahon. Near-infrared observations of the Z about 2.3 IRAS source FSC 10214 + 4724. ApJ, 381:L55–L57, November 1991. 10.1086/186195.
- Truch et al. [2008] M. D. P. Truch, P. A. R. Ade, J. J. Bock, E. L. Chapin, M. J. Devlin, S. Dicker, M. Griffin, J. O. Gundersen, M. Halpern, P. C. Hargrave, D. H. Hughes, J. Klein, G. Marsden, P. G. Martin, P. Mauskopf, C. B. Netterfield, L. Olmi, E. Pascale, G. Patanchon, M. Rex, D. Scott, C. Semisch, C. Tucker, G. S. Tucker, M. P. Viero, and D. V. Wiebe. The Balloon-borne Large Aperture Submillimeter Telescope (BLAST) 2005: Calibration and Targeted Sources. ApJ, 681:415–427, July 2008. 10.1086/588542.
- Truch et al. [2009] M. D. P. Truch, P. A. R. Ade, J. J. Bock, E. L. Chapin, M. J. Devlin, S. Dicker, M. Griffin, J. O . Gundersen, M. Halpern, P. C. Hargrave, D. H. Hughes, J. Klein, G. Marsden, P. G. Martin, P. Mauskopf, L. Moncelsi, N. Netterfield, L. Olmi, E. Pascale, G. Patanchon, M. Rex, D. Scott, C. Semisch, N. Thomas, M. D. P. Truch, C. Tucker, G. S. Tucker, M. P. Viero, and D. V. Wiebe. The Balloon-borne Large Aperture Submillimeter Telescope (BLAST) 2006: Calibration and Flight Performance. ApJ, submitted, 2009.
- Tucker et al. [1998] W. Tucker, P. Blanco, S. Rappoport, L. David, D. Fabricant, E. E. Falco, W. Forman, A. Dressler, and M. Ramella. 1E 0657-56: A Contender for the Hottest Known Cluster of Galaxies. ApJ, 496:L5–L8, March 1998. 10.1086/311234.
- Webb et al. [2003] T. M. Webb, S. A. Eales, S. J. Lilly, D. L. Clements, L. Dunne, W. K. Gear, R. J. Ivison, H. Flores, and M. Yun. The Canada-UK Deep Submillimeter Survey. VI. The 3 Hour Field. ApJ, 587:41–54, April 2003. 10.1086/368109.
- Wilson et al. [2008] G. W. Wilson, D. H. Hughes, I. Aretxaga, H. Ezawa, J. E. Austermann, S. Doyle, D. Ferrusca, I. Hernández-Curiel, R. Kawabe, T. Kitayama, K. Kohno, A. Kuboi, H. Matsuo, P. D. Mauskopf, Y. Murakoshi, A. Montaña, P. Natarajan, T. Oshima, N. Ota, T. A. Perera, J. Rand, K. S. Scott, K. Tanaka, M. Tsuboi, C. C. Williams, N. Yamaguchi, and M. S. Yun. A bright, dust-obscured, millimetre-selected galaxy beyond the Bullet Cluster (1E0657-56). MNRAS, 390:1061–1070, November 2008. 10.1111/j.1365-2966.2008.13774.x.
- Zemcov et al. [2007] M. Zemcov, C. Borys, M. Halpern, P. Mauskopf, and D. Scott. A study of the Sunyaev-Zel’dovich increment using archival SCUBA data. MNRAS, 376:1073–1098, April 2007. 10.1111/j.1365-2966.2007.11443.x.