A ring/disk/outflow system associated with W51 North:
a very massive star in the making
Abstract
Sensitive and high angular resolution ( 0.4′′) SO2[222,20 221,21] and SiO[54] line and 1.3 and 7 mm continuum observations made with the Submillimeter Array (SMA) and the Very Large Array (VLA) towards the young massive cluster W51 IRS2 are presented. We report the presence of a large (of about 3000 AU) and massive (40 M⊙) dusty circumstellar disk and a hot gas molecular ring around a high-mass protostar or a compact small stellar system associated with W51 North. The simultaneous observations of the silicon monoxide molecule, an outflow gas tracer, further revealed a massive (200 M⊙) and collimated ( 14∘) outflow nearly perpendicular to the dusty and molecular structures suggesting thus the presence of a single very massive protostar with a bolometric luminosity of more than 105 L⊙. A molecular hybrid LTE model of a Keplerian and infalling ring with an inner cavity and a central stellar mass of more than 60 M⊙ agrees well with the SO2[222,20 221,21] line observations. Finally, these results suggest that mechanisms, such as mergers of low- and intermediate- mass stars, might be not necessary for forming very massive stars.
1 Introduction
In recent years a small group of candidate accreting disks in high-mass protostars has been reported in the literature (Cesaroni et al., 2006, and references therein), but with luminosities typical of B-type main-sequence stars, that is, stars with masses 25 M⊙. Around more luminous and massive objects (presumed O-type stars) there have been no clear evidence for accretion disks, only gravitational unstable and large rotating molecular structures have been found. These molecular structures (“toroids”) are infalling and thus accreting fresh gas material to a central cluster of young massive protostars (Sollins & Ho, 2005; Beltrán et al., 2005, 2006) or maybe a single 40 M⊙ protostar (Sandell et al., 2003; Beuther & Walsh, 2008). The sizes and masses of the rotating toroids are about 2-3 104 AU and 100-400 M⊙, respectively.
Located at 5-8 kpc away in the Sagittarius spiral arm (Genzel et al., 1981; Imai et al., 2002; Schneps et al., 1981) and with a total bolometric luminosity of about 3 106 , the W51-IRS2 region is one of the most luminous massive star forming regions in our Galaxy (Erickson & Tokunaga, 1980).
Recently however it has been estimated a distance of 2.3 0.3 kpc to W51-IRS2 using spectroscopic parallaxes of OB stars (Figuerêdo et al., 2008). But, in other hand, a lower limit of 5 kpc by triangulation using Very Long Baseline Array observations of methanol masers located in W51 IRS2 was found by Xu et al. (2008), a very similar value to those found earlier by the statistical H2O maser parallax (Genzel et al., 1981; Schneps et al., 1981; Imai et al., 2002). In this study, we adopt a distance of 6 kpc for the cluster.
This region might contain about 30 O-type zero-age main-sequence stars with excess emission at the infrared and (sub)millimeter wavelengths, see for an example Barbosa et al. (2008). In the W51 IRS2 cluster there are two highly obscured massive sources called W51 North and W51 d2 that seem to be the youngest objects in the cluster and that exhibit strong emission from many complex molecules (Ho et al., 1983; Rudolph et al., 1990; Zhang & Ho, 1997; Zhang et al., 1998; Sollins et al., 2004; Zapata et al., 2008b). In particular, toward the W51 North object very strong maser emission from various species e.g., hydroxyl (OH), silicon monoxide (SiO), and water (H2O) has been detected (Schneps et al., 1981; Gaume & Mutel, 1987; Morita et al., 1992). This type of emission is associated with the formation of the high-mass stars. Observations of the proper motions of the H2O masers, in addition, revealed the presence of a remarkable compact ( 1-2′′) southeast-northwest outflow emanating from this protostar (Schneps et al., 1981; Eisner et al., 2002; Imai et al., 2002). Furthermore, very high spatial resolution VLA and VLBA radio observations revealed that the SiO maser emission traces the innermost parts of the outflow ejected from W51 North (Eisner et al., 2002). Finally, observations of the cyanogen (CN) molecule showed that the molecular gas is falling into this central protostar with a mass accretion rate 10-3 yr-1 (Zapata et al., 2008b).
2 Observations
In order to study the very young massive object W51 North, we carried out observations of the SO2[222,20 221,21] (sulfur dioxide) and SiO[54] (silicon monoxide) molecular lines and 1.3 mm continuum with the Submillimeter Array. We also obtained 7 mm continuum data with the Very Large Array. Both observations had high angular resolution ( 0.4′′).
The SO2 molecule is a good high-density gas tracer (see Leurini et al., 2007; Jiménez-Serra et al., 2007), while the SiO, is an excellent tracer for molecular outflows.111 The production of the silicon monoxide (SiO) molecule is mainly attributed to the destruction of the dust particles in strong shocks (Schilke et al., 1997; van Dishoeck & Blake, 1998). The SMA SiO[5 4], SO2[222,20 221,21] and 1.3 mm observations were made simultaneously on 2008 January 17, and the VLA 7 mm observations were made on 2008 April 22. At that time, the SMA was in its very extended configuration, while the VLA was in its C configuration. The phase reference center of both VLA and SMA observations was R.A.=19h 23m 40055, decl.= 14∘ 31′ 559 (J2000.0).
For the 7 mm observations, we integrated on-source for a total of approximately 5 hr using the fast-switching mode with a cycle of 120 s. The observations were made using the continuum mode, with a total bandwidth of 100 MHz. The central frequency observed was 43.34 GHz. The absolute amplitude calibrator was 1331+305 (with an adopted flux density of 1.45 Jy) and the phase calibrator was 1924+156 (with a bootstrapped flux density of 0.65 0.01 Jy).
For the 1 mm observations, the zenith opacity (), measured with the NRAO tipping radiometer located at the Caltech Submillimeter Observatory, was 0.15, indicating excellent weather conditions (for this frequency) during the observations. Observations of Uranus provided the absolute scale for the flux density calibration. Phase and amplitude calibrators were the quasars 1925+211 and 2035+109, with measured flux densities of 0.7 0.1 and 0.5 0.1 Jy, respectively.
The SO2[222,20 221,21] and SiO[54] transitions were detected in the lower side band (LSB) of the SMA at a frequency of 216.643 and 217.104 GHz, respectively. The full bandwidth of the SMA correlator is 4 GHz (2 GHz in each band). The SMA digital correlator was configured in 24 spectral windows (“chunks”) of 104 MHz each, with 256 channels distributed over each spectral window, providing a resolution of 0.40 MHz (0.58 km s-1) per channel. Further technical descriptions of the SMA and its calibration schemes can be found in Ho et al. (2004).
The data were edited, calibrated and imaged using the programs MIR, AIPS, MIRIAD and KARMA. In both bands, we used the ROBUST parameter set to 0 to obtain an optimal compromise between sensitivity and angular resolution. The 7mm data were self-calibrated in phase. For the 7 mm observations, the continuum image rms noise was 0.9 mJy beam-1 at an angular resolution of with a P.A. = -53.6∘. For the 1 mm observations, the continuum image rms noise was 6 mJy beam-1 at an angular resolution of with a P.A. = 54.8∘. The line image rms noise was about 80 mJy beam-1.
| Position | |||||||
|---|---|---|---|---|---|---|---|
| Wave./Mol. | Flux Density | Deconvolved Size | P.A. | Gas Mass | Dyn. Mass | ||
| [ ] | [ ] | [mJy] | [arcsec] | [Degree] | [M⊙] | [M⊙] | |
| 7 mm | 19 23 40.057 | 14 31 05.67 | 17 3 | 0.580.02 0.270.02 | 706 | – | – |
| 1.3 mm | 19 23 40.045 | 14 31 05.48 | 1620 160 | 0.720.03 0.570.03 | 9040 | 40 | – |
| SO2 | 19 23 40.074 | 14 31 05.44 | 7104 5001 | 1.80.1 1.20.1 | 722 | – | 1002 |
.
Note. — 1: The units are mJy Beam-1 km s-1. 2: The dynamical mass was obtained from our model.

3 Results and Discussion
3.1 A massive and large dusty disk
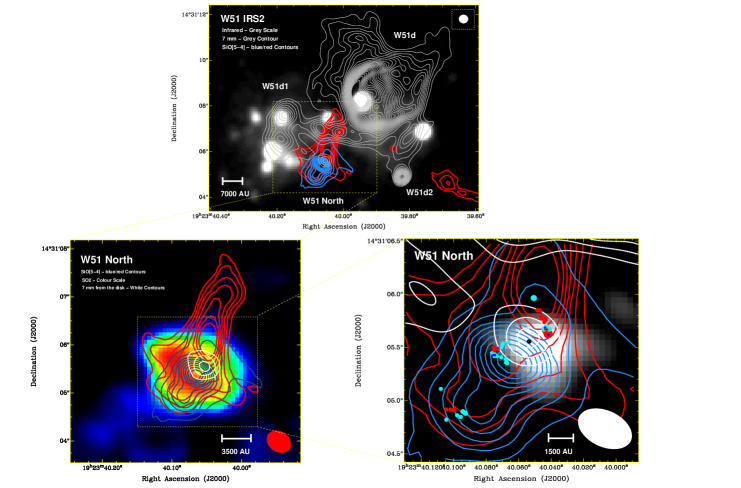
At a wavelength of 7 mm (see Figure 1), we detected strong free-free continuum emission arising from the HII regions associated with the neighboring young massive ZAMS stars located in the W51 IRS2 cluster. This emission has already been mapped at centimeter wavelengths by many authors (Gaume & Mutel, 1987; Eisner et al., 2002; Mehringer, 1994; Lacy et al., 2007). The radio images presented by Lacy et al. (2007) were obtained from Mehringer (1994). However, in our map, we detected for the first time a faint and compact millimeter source associated with the obscured high-mass protostar located in W51 North. This 7 mm continuum source is the counterpart of the dusty sources associated with large envelopes, and reported at 2 and 1.3 mm by Zhang et al. (1998); Zapata et al. (2008b), respectively.
In Figure 2, we have constructed the spectral energy distribution (SED) for this millimeter source from the centimeter to millimeter wavelengths, combining only data presented here. The angular resolution of two different observations are quite similar, of about 0.4′′. From these data, we estimated a spectral index of = 2.8. This suggest that the emission at these wavelengths likely arises from a dusty disk. A larger envelope has been already mapped at scales 104 AU as mentioned above. The hypothesis of a flattened circumstellar disk is supported by the fact that the mm source is resolved at wavelength 7 mm (see Table 1) and show a modest east-west elongation, nearly perpendicular to the orientation of the molecular outflow that will discussed on the following sections. At 1.3 mm the orientation is not so well determined.
We noted from Figure 16 of Mehringer (1994) there is no strong emission from the recombination lines H92 and He92 toward the mm source, both lines are associated with the compact HII regions W51d and/or d1. The non detection of recombination lines emission from the mm source is consistent with our interpretation. Taking the values of the deconvolved sizes and the flux densities for the continuum source at 7 mm and 1.3 mm, we estimated a brightness temperature 80 10 K., a very low temperature to be associated with a H II region. This temperature is more likely associated with thermal dust emission.
Possibly, the high mass accretion rates of the infalling material associated with W51 North ( 10-3 yr-1) could be likely quenching or trapping the development of an ultra-compact HII region, so that the free-free emission from the ionized material is undetectable at centimeter wavelengths, see for a reference of these phenomena: Osorio et al. (1999); Keto (2003). Another possibly is we have a quite young massive protostar that has not developed an HII region yet.
In Figure 1, we also show the morphology of the continuum source at 1.3 mm. At both wavelengths, the deconvolved sizes are similar, with a size on the order 3500 1500 AU, see Table 1. Certainly, a very large disk compared with those observed in low-mass stars ( 100 AU), but with similar sizes to those observed in early B-type protostars (1000-2000 AU, e.g. Cesaroni et al., 1999; Shepherd et al., 2001; Schreyer et al., 2006; Patel et al., 2005; Rodríguez et al., 2007).
Finally, assuming that the emission is optically thin, a dust temperature value of 200 K (Zhang et al., 1998), a grain emissivity spectral index =1 (see Figure 2), a value of the dust absorption coefficient that goes as and a distance to W51 North of 6 kpc, we estimated a gas mass of the dusty disk of 40 M⊙. This value is consistent with the mass (100 M⊙) obtained for the large dusty structures found in W51 North by Zhang et al. (1998); Zapata et al. (2008b) .
3.2 A collimated molecular outflow
The SiO[54] zero moment map shows the presence of a compact and collimated ( 14∘) north-south bipolar molecular outflow. The redshifted radial velocities are from +60 to +95 km s-1 and the blueshifted ones are from +20 to +58 km s-1; the systemic LSR radial velocity of the ambient molecular cloud is about at 59 km s-1. The receding radial velocities (redshifted) of the outflow are located toward the north, while the approaching radial velocities (blueshifted) are toward the southwest. The outflow emanates from the mm source imaged at 1.3 and 7 mm wavelengths (see Figure 1).
In Figure 1, we have also overlaid the SiO[54] molecular emission from the bipolar outflow with the positions of the blue- and red-shifted water maser spots reported by Eisner et al. (2002). It is evident how the water maser spots trace the innermost parts of the SiO[54] molecular bipolar outflow as observed on many other molecular outflows and proposed for this case by Zapata et al. (2008b).
In the other hand, the SiO masers reported also in Eisner et al. (2002) and associated with very luminous high-mass star forming regions (Zapata et al., 2008a), might be tracing even more dense parts of the outflow at very small scales, as has been observed for the massive protostar Source I located in the closest massive star forming region, Orion (Menten & Reid, 1995; Reid et al., 2007). We have marked the position of the SiO maser source in our Figure 1. The P.A. of the SiO[54] molecular outflow is 150∘ 20∘, almost perpendicular to the orientation of the dusty source, as mentioned before. The large radial velocities of the outflow and the morphology of the SiO[54] molecular emission suggest that it is nearly perpendicular to the plane of the sky. This is also suggested by the location of water maser radial redshifted and blueshifted velocities, see Imai et al. (2002); Eisner et al. (2002).
Assuming that we are in LTE and the molecular emission is optically thin, we can estimate the mass of the outflow for the SiO molecule in the transition J= from the equation:
| (1) |
where , is the fractional abundance between the silicon monoxide and the molecular hydrogen, that for this case we took a value of 107, D is distance to W51 North, is solid angle, the rest frequency of the line, Sν the flux density and Tex the excitation temperature equal 50 K. We estimated a mass for the outflow of 200 M⊙. It is important to mention that the fractional abundance between the silicon monoxide and the molecular hydrogen varies in every star forming regions (SFRs) and thus the mass of the outflow can be over/underestimated. The value for the fractional abundance assumed here seems to be consistent for a few SFRs, see Ziurys & Friberg (1987); Mikami et al. (1992); Zhang et al. (1995).
For a mechanical force of FM=200 M⊙ 30 km s-1/ 1800 yr-1=3.3 M⊙ km s-1 yr-1 and from the correlation presented in Wu et al. (2004) for the outflow mechanical force versus the bolometric luminosity of the exciting source, we very roughly estimated a luminosity for the central powering source of more 105 L⊙ which corresponds to a massive early O-type protostar. This spectral type for the central star is in good agreement with that obtained from the dynamical considerations.
3.3 A hot molecular gas ring
A large and flattened molecular ring (with an inner cavity of about 3000 AU) surrounding the dusty disk was traced by the emission of the molecule SO2[222,20 221,21] (see Figure 1).
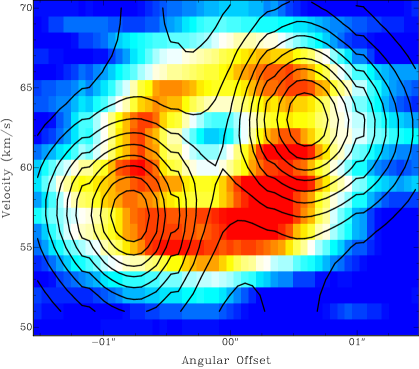
The ring has a deconvolved radius of order 6000 AU with an orientation (P.A.= 22∘) almost perpendicular to that of the molecular outflow and similar to the presumed dusty disk. In Figure 3, we show the position-velocity diagram of the molecular SO2[222,20 221,21] emission from the ring structure. From this figure, one can see a ring structure with a modest velocity gradient across the ring of 5 km s-1 over 2.0′′, produced by rotation and infall. The redshifted radial velocities located to the east, while the blueshifted ones to the west. The small velocity gradient is likely due to the small inclination angle of ring with respect to plane of sky. Similar rings velocity structures were also found traced by the emission of other molecules species, e.g HC3N, H2CO, NH2CHO and CH3OH.
Very recently, however, Zapata et al. (2008b) reported a large structure or envelope with a size of 4 104 AU and with a P.A. = 90∘ traced by the C2H3CN molecule and centered in W51 North. This molecular structure seems rotate in an opposite direction (with the blueshifted velocities to the east while the redshifted ones to the east) to the molecular compact ring traced by the SO2[222,20 221,21] . As discussed in Zapata et al. (2008b), other molecules such as HCOOCH3 and CH3OH at same scales associated with W51 North were very much contaminated by the emission from the hot molecular core associated with W51d2 do not allowing to confirm the velocity shift. We thus think that the C2H3CN molecular core in W51 North was also contaminated with emission coming from W51d2 given therefore the impression of rotation.
We are more confident of the velocity gradient across the molecular ring are correct because we have resolved the molecular source and other molecules show similar velocity structures.
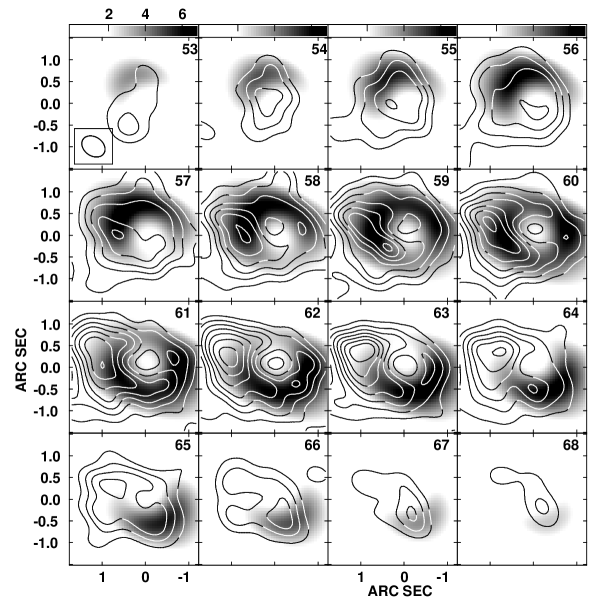
In Figure 4 and 5, we additionally present the velocity channel maps and the position-velocity diagram of the SO2[222,20 221,21] emission from the ring, overlaid with a simple LTE model of a large infalling Keplerian ring with an inner cavity with sizes (of the ring and the inner cavity) similar to those observed.
We assumed in this model that the thermal molecular line emission of the ring is in local thermodynamic equilibrium, and took from the literature some know values as the excitation temperature, the density and the infall velocity (see Zhang et al., 1998; Zapata et al., 2008b). The best fit was found recurrently until we obtained similar structures in our model to those imaged (see, Table 1 and Figures 3 and 4). The model fits the observations well.
This model, in addition, restricted the position of the ring on the sky. It is almost in face-on, with an inclination angle with respect to plane of the sky less than 30∘ and a P.A. equal to 22∘. It is important to mention that if the inclination angle is smaller, the dynamical mass will increase by much more, with a reason inversely proportional to the sin2(i), where i is the inclination angle. Thus, the central object could have a stellar mass of more than 60 M⊙.
It is interesting to note that the mass of the disk (40 M⊙) might be on the order of the stellar mass ( 60 M⊙). This has seen before for the massive young disks associated with the high-mass protostars located in the star forming region: NGC6334N(I) (Rodríguez et al., 2007).
The nature of large inner cavity in the molecular ring may be due to opacity effects, photodissociation of the molecules, or clearing of the inner disk either from a multiple system of compact circumstellar disks already formed in the center of the ring or by the outflow itself. If the nature of the ring is because of opacity effects or photodissociation of the molecules very close to the central object suggesting that both the molecular ring and circumstellar disk could be part of a same extended and flattened structure. Observations with a much better angular resolution of high-density tracers and the continuum at millimeter wavelengths may determinate the nature of the inner cavity in the ring.
The strong feature observed toward the east of the ring might be originated from the interaction of the outflow with the ring itself. However, more observations at high angular resolution with different molecular probes sensitive to different cloud properties will be quite important for studying the higher excitation material within the ring.
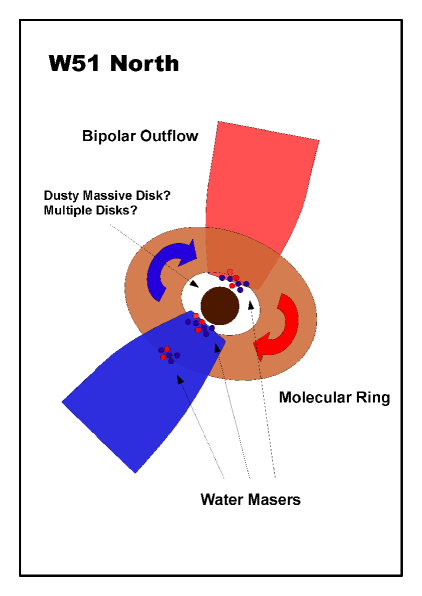
In Figure 5 we show artist’s conception of the molecular ring, the bipolar outflow and the central massive disk found in the high-mass protostar W51 North.
4 Summary
W51 North presents a promising laboratory for future studies on formation of very high-mass stars. We have observed this young massive protostar at spatial scales of 0.4′′ using the SMA and VLA and found the following:
-
•
A massive (40 M⊙) and large ( 3000 AU) dusty circumstellar disk around a single high-mass protostar or a compact small stellar system.
-
•
A hot and rotating molecular ring with a inner cavity of about 3000 AU and a size of about 9,000 AU.
-
•
A highly collimated and massive (200 M⊙) bipolar outflow that emanates with an orientation almost perpendicular to the circumstellar disk and the ring. This collimated outflow suggests the presence of a single massive protostar in the center of the circumstellar disk.
-
•
Our data reveled that H2O and SiO masers associated with this highly embedded protostar are tracing the innermost parts of the SiO[54] thermal bipolar outflow.
-
•
A molecular hybrid LTE model of a Keplerian infalling ring with an inner cavity ( 3000 AU) and a stellar mass of more than 60 M⊙ agree well with the SO2[222,20 221,21] line observations.
These results suggest that mechanisms, such as mergers of low- and intermediate- mass stars, might be not necessary for forming very massive stars.
| Name | Parameter | Value |
|---|---|---|
| Systematic Velocity | VLSR | 60.0 km s-1 |
| Orientation | PA | 22∘ 10∘ |
| Inclination | i | 30∘ |
| Density | 108 cm-3 | |
| Inner Radius | Ri | 3000 AU 200 AU |
| Outer Radius | Ro | 6000 AU 200 AU |
| Temperature of the central object | T | 500 K |
| Dust Exponent | 1.0 | |
| Distance | D | 6000 pc |
| Reference radius | r | 6000 AU |
| Power law index density | 2.75 | |
| Kinetic temperature | ||
| at referenced radius | Tkin | 200 K |
| Excitation temperature | ||
| at referenced radius | Texc | 200 K |
| Power law index Tkin | 0.6 | |
| Power law index Texc | 0.6 | |
| Scale Height of disk | H | 60 AU 20 AU |
| Dynamical mass | M | 100 M⊙ |
| infall velocity | Vinf | 4 km s-1 |
References
- Barbosa et al. (2008) Barbosa, C. L., Blum, R. D., Conti, P. S., Damineli, A., & Figuerêdo, E. 2008, ApJ, 678, L55
- Beltrán et al. (2006) Beltrán, M. T., Cesaroni, R., Codella, C., Testi, L., Furuya, R. S., & Olmi, L. 2006, Nature, 443, 427
- Beltrán et al. (2005) Beltrán, M. T., Cesaroni, R., Neri, R., Codella, C., Furuya, R. S., Testi, L., & Olmi, L. 2005, A&A, 435, 901
- Beuther & Walsh (2008) Beuther, H. & Walsh, A. J. 2008, ApJ, 673, L55
- Cesaroni et al. (1999) Cesaroni, R., Felli, M., Jenness, T., Neri, R., Olmi, L., Robberto, M., Testi, L., & Walmsley, C. M. 1999, A&A, 345, 949
- Cesaroni et al. (2006) Cesaroni, R., Galli, D., Lodato, G., Walmsley, M., & Zhang, Q. 2006, Nature, 444, 703
- Eisner et al. (2002) Eisner, J. A., Greenhill, L. J., Herrnstein, J. R., Moran, J. M., & Menten, K. M. 2002, ApJ, 569, 334
- Erickson & Tokunaga (1980) Erickson, E. F. & Tokunaga, A. T. 1980, ApJ, 238, 596
- Figuerêdo et al. (2008) Figuerêdo, E., Blum, R. D., Damineli, A., Conti, P. S., & Barbosa, C. L. 2008, AJ, 136, 221
- Gaume & Mutel (1987) Gaume, R. A. & Mutel, R. L. 1987, ApJS, 65, 193
- Genzel et al. (1981) Genzel, R., Downes, D., Schneps, M. H., Reid, M. J., Moran, J. M., Kogan, L. R., Kostenko, V. I., Matveenko, L. I., & Ronnang, B. 1981, ApJ, 247, 1039
- Ho et al. (1983) Ho, P. T. P., Das, A., & Genzel, R. 1983, ApJ, 266, 596
- Ho et al. (2004) Ho, P. T. P., Moran, J. M., & Lo, K. Y. 2004, ApJ, 616, L1
- Imai et al. (2002) Imai, H., Watanabe, T., Omodaka, T., Nishio, M., Kameya, O., Miyaji, T., & Nakajima, J. 2002, PASJ, 54, 741
- Jiménez-Serra et al. (2007) Jiménez-Serra, I., Martín-Pintado, J., Rodríguez-Franco, A., Chandler, C., Comito, C., & Schilke, P. 2007, ApJ, 661, L187
- Keto (2003) Keto, E. 2003, ApJ, 599, 1196
- Lacy et al. (2007) Lacy, J. H., Jaffe, D. T., Zhu, Q., Richter, M. J., Bitner, M. A., Greathouse, T. K., Volk, K., Geballe, T. R., & Mehringer, D. M. 2007, ApJ, 658, L45
- Leurini et al. (2007) Leurini, S., Beuther, H., Schilke, P., Wyrowski, F., Zhang, Q., & Menten, K. M. 2007, A&A, 475, 925
- Mehringer (1994) Mehringer, D. M. 1994, ApJS, 91, 713
- Menten & Reid (1995) Menten, K. M. & Reid, M. J. 1995, ApJ, 445, L157
- Mikami et al. (1992) Mikami, H., Umemoto, T., Yamamoto, S., & Saito, S. 1992, ApJ, 392, L87
- Morita et al. (1992) Morita, K.-I., Hasegawa, T., Ukita, N., Okumura, S. K., & Ishiguro, M. 1992, PASJ, 44, 373
- Osorio et al. (1999) Osorio, M., Lizano, S., & D’Alessio, P. 1999, ApJ, 525, 808
- Patel et al. (2005) Patel, N. A., Curiel, S., Sridharan, T. K., Zhang, Q., Hunter, T. R., Ho, P. T. P., Torrelles, J. M., Moran, J. M., Gómez, J. F., & Anglada, G. 2005, Nature, 437, 109
- Reid et al. (2007) Reid, M. J., Menten, K. M., Greenhill, L. J., & Chandler, C. J. 2007, ApJ, 664, 950
- Rodríguez et al. (2007) Rodríguez, L. F., Zapata, L. A., & Ho, P. T. P. 2007, ApJ, 654, L143
- Rudolph et al. (1990) Rudolph, A., Welch, W. J., Palmer, P., & Dubrulle, B. 1990, ApJ, 363, 528
- Sandell et al. (2003) Sandell, G., Wright, M., & Forster, J. R. 2003, ApJ, 590, L45
- Schilke et al. (1997) Schilke, P., Walmsley, C. M., Pineau des Forets, G., & Flower, D. R. 1997, A&A, 321, 293
- Schneps et al. (1981) Schneps, M. H., Lane, A. P., Downes, D., Moran, J. M., Genzel, R., & Reid, M. J. 1981, ApJ, 249, 124
- Schreyer et al. (2006) Schreyer, K., Semenov, D., Henning, T., & Forbrich, J. 2006, ApJ, 637, L129
- Shepherd et al. (2001) Shepherd, D. S., Claussen, M. J., & Kurtz, S. E. 2001, Science, 292, 1513
- Sollins & Ho (2005) Sollins, P. K. & Ho, P. T. P. 2005, ApJ, 630, 987
- Sollins et al. (2004) Sollins, P. K., Zhang, Q., & Ho, P. T. P. 2004, ApJ, 606, 943
- van Dishoeck & Blake (1998) van Dishoeck, E. F. & Blake, G. A. 1998, ARA&A, 36, 317
- Wu et al. (2004) Wu, Y., Wei, Y., Zhao, M., Shi, Y., Yu, W., Qin, S., & Huang, M. 2004, A&A, 426, 503
- Xu et al. (2008) Xu, Y., Reid, M. J., Menten, K. M., Brunthaler, A., Zheng, X. W., & Moscadelli, L. 2008, ArXiv e-prints
- Zapata et al. (2008a) Zapata, L. A., Menten, K., Reid, M., & Beuther, H. 2008a, ArXiv e-prints
- Zapata et al. (2008b) Zapata, L. A., Palau, A., Ho, P. T. P., Schilke, P., Garrod, R. T., Rodríguez, L. F., & Menten, K. 2008b, A&A, 479, L25
- Zhang & Ho (1997) Zhang, Q. & Ho, P. T. P. 1997, ApJ, 488, 241
- Zhang et al. (1998) Zhang, Q., Ho, P. T. P., & Ohashi, N. 1998, ApJ, 494, 636
- Zhang et al. (1995) Zhang, Q., Ho, P. T. P., Wright, M. C. H., & Wilner, D. J. 1995, ApJ, 451, L71+
- Ziurys & Friberg (1987) Ziurys, L. M. & Friberg, P. 1987, ApJ, 314, L49