IRC+10216’S INNERMOST ENVELOPE – THE ESMA’S VIEW
Abstract
We used the Extended Submillimeter Array (eSMA) in its most extended configuration to investigate the innermost (within a radius of 290 from the star) circumstellar envelope (CSE) of IRC+10216. We imaged the CSE using HCN and other molecular lines with a beam size of 0.′′22 0.′′46, deeply into the very inner edge ( 15 ) of the envelope where the expansion velocity is only 3 km s-1. The excitation mechanism of hot HCN and KCl maser lines is discussed. HCN maser components are spatially resolved for the first time on an astronomical object. We identified two discrete regions in the envelope: a region with a radius of 15 , where molecular species have just formed and the gas has begun to be accelerated (region I) and a shell region (region II) with a radius of 23 and a thickness of 15 , whose expansion velocity has reached up to 13 km s-1, nearly the terminal velocity of 15 km s-1. The Si34S line detected in region I shows a large expansion velocity of 16 km s-1 due to strong wing components, indicating that the emission may arise from a shock region in the innermost envelope. In region II, the of the most copious mass loss direction was found to be ∘, which may correspond to the equatorial direction of the star. Region II contains a torus-like feature. These two regions may have emerged due to significant differences in the size distributions of the dust particles in the two regions.
1 INTRODUCTION
IRC+10216 (Neugebauer & Leighton 1969) is the most studied carbon star. Because of proximity (distance of 135 pc (Le Bertre 1997)), it shows a very rich spectrum of molecular and atomic lines particularly at millimeter and submillimeter wavelengths (e.g., Groesbeck et al. 1994). As such, IRC+10216 is an important target for circumstellar and interstellar chemistry. The carbon star is a red giant that is evolving toward the post asymptotic giant branch (AGB) phase. It has a high mass-loss rate of up to 10-5 yr-1, and is therefore enshrouded by optically thick circumstellar shells.
Observing maser transitions of various molecules towards evolved stars is a powerful tool to study their innermost circumstellar envelopes, in particular the recent mass-loss activities and history of such stars. Silicon monoxide (SiO), water (H2O) and hydroxyl (OH) maser transitions have been most frequently used to investigate the innermost mass-loss activities of oxygen rich evolved stars (Morris & Knapp, 1976; Reid & Muhleman, 1978; Moran et al., 1979; Diamond & Kemball, 2003; Shinnaga et al., 2004).
Hydrogen cyanide (HCN) is one of the most abundant molecular species in the circumstellar envelopes of carbon stars (Ridgway et al., 1978) and is known to show maser action in various vibrational states (e.g., Ziurys & Turner 1986 for 1; Izumiura et al. 1995 for =0). Since HCN is a linear triatomic molecule, it has three fundamental vibrational modes, (, , ); is the C–H stretching mode, is the doubly degenerate bending mode, and is the C–N stretching mode. Many observational studies have been done using HCN transitions in the circumstellar envelope of IRC+10216 and other carbon stars. Amazingly, some of the HCN maser lines are in very high energy levels (4000 K or above), far above than the temperature of the photosphere or the dust temperature of the region. The HCN component in the =(0, 11f, 1) state, which is one of the high energy level transitions, is known to perturb with the =(0, 40, 0) state through Coriolis interaction (Hocker & Javan, 1967; Chantry, 1971), first empirically identified by Gebbie et al. (1964). The (0, 11f, 1) and (0, 40, 0) system have a high amplification in the 336.5 and 310.9 m lines due to the fact that the vibrational transition moments are sharply peaked at (Lide & Maki, 1967). These rovibrational transitions were detected towards IRC+10216 (Schilke & Menten, 2003). This paper reports detections of two other lines at such high energy levels.
Lucas & Guilloteau (1992) used the Plateau de Bure interferometer to study the details of the inner circumstellar envelope of IRC+10216 with the =(0, 20, 0) transition at 3 mm and they confirmed that the emission may be weak maser emission occurring in an acceleration region of the circumstellar envelope. However, the components of the maser were not significantly resolved with their beam size of 2.4′′ 1.1′′.
The Extended Submillimeter Array (eSMA) is a heterogeneous array that combines the signals detected with the eight 6-meter Submillimeter Array (SMA) antennas, the Caltech Submillimeter Observatory (CSO) 10.4 meter telescope, and the James Clerk Maxwell Telescope (JCMT) 15 meter telescope, operating at short millimeter and submillimeter wavelengths. Including the CSO in the interferometer, one can extend the longest baseline up to 782 meters, which improves the spatial resolution by 40 %. The eSMA is one of the instruments that allows us to study the gas distribution and the kinematics of the innermost circumstellar envelope of this carbon star in detail where the acceleration of the gas is taking place. Here we report an observational study on the properties of the innermost circumstellar envelope of IRC+10216 using HCN and other molecular lines with the eSMA. We detected a few hot HCN lines including the one in the =(0, 11f, 1) state mentioned in previous paragraph.
2 OBSERVATION AND DATA REDUCTION
We observed IRC+10216 with HCN transitions in various vibrational states along with other molecular transitions with the eSMA (Bottinelli et al., 2008) on 2008 April 14 (UT). The total bandwidth of 4 GHz (2 GHz from each sideband, i.e., 264.357 266.337 GHz and 274.357 276.338 GHz) was covered with a frequency resolution of 812.5 kHz 111Note that JCMT’s receiver had a more limited frequency coverage from 264.770 to 266.338 GHz and from 274.357 to 275.927 GHz. . The data were taken under moderate weather conditions with zenith opacities of 0.15 – 0.18 measured at 225 GHz. Atmospheric opacities at the observing frequency were not measured during the observation, however, they are close to what we measured at 225 GHz because these frequencies are close. Integration time for one data point was 30 seconds. The track lasted 5.5 hours, and about 4 hours of on-source data were acquired. The SMA was configured in its very extended array (maximum baselines to 508 m); the eSMA then covered baselines ranging from 25 to 782 m ( 20 to 692 k or 0.′′2 to 10′′). The phase tracking center was set at RA = 9h 47m 57.s390, Decl. = 13∘16′43.′′898 (J2000). The synthesized beam size was 0.′′46 0.′′22 with a position angle of 39.9∘.
Data reduction and calibration were done using the MIR package222http://cfa-www.harvard.edu/cqi/mircook.html including passband and gain calibrations as well as continuum subtraction. IRC+10216 was observed together with quasars 3C273 and 1058+015. Passband calibration was done using the afore mentioned quasars.
To make the eSMA observations, we used half wave plates (HWPs) at the JCMT and at the CSO to try to match the polarization angles of the receiver mixers with those at the SMA antennas. Based on an aperture efficiency of 75% of the SMA antennas, the estimated aperture efficiencies of the JCMT and the CSO telescopes were found to be 40% and 30%, respectively. The CSO’s aperture efficiency is typically 60% when the telescope is used as a single-dish telescope. The degraded efficiency of the CSO telescope was due to a failure of the computer that controlled the HWP. The polarization angle of the CSO’s mixer on the sky was not matched to the SMA’s. The receiver temperatures of the SMA antennas and the CSO antenna ranged from 85 to 140 K, while the JCMT antenna’s receiver temperature was 290 K. The double sideband system temperature of the SMA antennas and the CSO telescope were ranging between 200 – 500 K, while the double sideband system temperature of the JCMT telescope was ranging between 300 – 600 K.
While the continuum emission of IRC+10216 is marginally resolved on the longest baselines (see Section 3.1), we have performed self-calibration of the visibility phase gains using the continuum, approximated by a point source, as our primary phase calibration step. Flux calibration was achieved by setting the continuum component of IRC+10216 to 1.18 Jy, consistent with well calibrated observations obtained in the SMA compact array in March 2008 whose beam size was about 3′′. Based on the estimated flux of 1.18 Jy for IRC+10216, the calculated flux of the quasar 1058+015 was 2.53 Jy, which was 9 % higher than the flux in the calibrator catalog333http://sma1.sma.hawaii.edu/callist/callist.html?data=1058%2B015 measured on the same date (2008 April 17). Since the quasar is linearly polarized by 25 – 30 % at this frequency, the 9% difference may be due to polarization. Note that, by applying self-calibration using the continuum component of IRC+10216, the data taken on the quasar 1058+015 showed that atmospheric decorrelation was eliminated significantly even on long baselines.
Image processing including clean was done using Astronomical Image Processing System (AIPS444http://www.aips.nrao.edu/) with natural weighting of the visibilities. Natural weighting was chosen to achieve a high signal-to-noise ratio for detecting and imaging weak components along with strong ones. Comparing the data taken with the SMA with the data taken with the eSMA, it was found that the inclusion of the CSO and JCMT antennas, i.e. the eSMA, improved the signal-to-noise ratio on the longest baselines by 40% compared to that of the SMA alone.
In order to estimate missing flux of the two HCN transitions in the =0 and (0, 11e, 0) states, we obtained a single-dish spectrum of the two HCN transitions with the JCMT on 2008 May 11th (UT). The spectrum was acquired at an elevation near 30∘. The main beam efficiency was measured to be 65% with a beam size of 19′′ at 266 GHz, by using the continuum emission of Saturn. We used 106.5 K for the main beam temperature of the planet. Note that the deep PH3 absorption feature (Weisstein & Serabyn, 1994) of the planet was taken into account when estimating the main beam temperature of the planet at 266 GHz. Conversion from the scale to flux density scale was achieved with a conversion factor of 32 Jy K-1 for the JCMT data.
3 RESULTS AND DISCUSSION
3.1 Continuum Component from Circumstellar Dust and the Stellar Photosphere
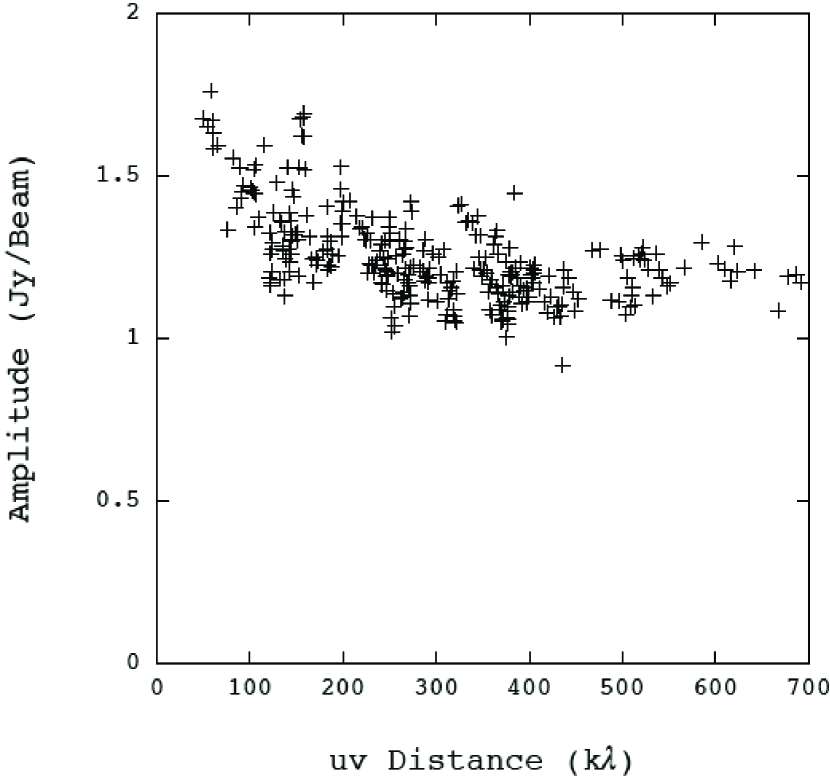
Continuum data were created from the portions of the spectra which appear to be free from line emission. Figure 1 shows visibility amplitude versus uv distance of the continuum component originating from the circumstellar dust, and photosphere of the central star, at 1.1 mm. The data points were averaged over every 5 k. The falloff of visibility amplitude with uv distance demonstrates that the continuum component is spatially extended and partially resolved. In Figure 1, one can find that the amplitude is flattened at 400 k. This means that there are components contributing to the continuum emission which are smaller than 27 or 62 AU in size. On the baselines shorter than 400 k, the amplitude of the continuum emission rises as going towards shorter baseline length, which means that there are continuum components which we resolved whose radii 27 . is estimated to be 500 = 3.5 1013 cm (Men’shchikov et al., 2001).
It is known that the continuum emission of IRC+10216 varies with a period of 635 days at submillimeter as well as optical wavelengths (Jenness et al., 2002). At 850m, the average flux is 8.8 Jy and it changes by 0.95 Jy due to the pulsation (Jenness et al., 2002). Taking the sinusoidal curve of Figure 7 in Jenness et al. (2002), at the time when the object was observed in 2008 March and April, the object is expected to be in the maximum phase (phase of 0.015 by counting from the maximum phase). Groenewegen et al. (1997) measured that the star’s continuum emission extends up to 50′′ at the 3 level of their measurements at 1.3 mm. The continuum emission measured from our JCMT observation was 3.7 Jy at 1.1 mm, which is consistent with measurements done by other authors (e.g., Dehaes et al. 2007). Sahai et al. (1989) estimated the continuum emission from the stellar photosphere would be 0.55 Jy at 1 mm. It suggests that about half of the total continuum emission imaged with the eSMA may be due to the emission of the stellar photosphere, considering the measured flux of the continuum component with the SMA was 1.18 Jy (see Section 2). The rest of the flux measured with the eSMA may come from circumstellar dust components and low-level line emission which were not individually detected.
3.2 HCN and Other Molecular Species Detected with the eSMA
Figure 2 shows the spectra of HCN transitions in the =0 and (0, 11e, 0) states over sky frequency () taken at the JCMT and at the eSMA, respectively. Figure 3 shows the comparison of the , (0, 11e, 0) lines observed with the JCMT and the eSMA more closely. The eSMA spectra shown in Figure 2 and 3 were produced from a spectral cube generated by the image processing. To create the spectrum, a region was specified which includes all emission of the transitions detected above 3 level in the total integrated intensity map of the transitions.
Ziurys & Turner (1986) observed HCN , =(0, 11e, 0) transition in 1986 March at the Kitt Peak 12m telescope. The stellar phase in 1986 March was near minimum. The peak flux observed in 2008 April was 25 % higher than that observed in 1986. The increased flux might be due to variability of the stellar luminosity.
While both the HCN , =0 and (0, 11e, 0) single-dish spectra show a typical parabolic-shape profile that traces the expanding envelope, the line profiles of the transitions taken with the interferometer have strange irregular shapes with a few peaky components. The fractions of the flux in the =0 and (0, 11e, 0) states detected by the eSMA are only 1 and 45 % of the emission detected by the JCMT. Please note that the size of the JCMT’s beam corresponds to 1.1 103 (= 2.6 103 AU). The rest, i.e., the missing components, probably originating in the expanding envelope, are resolved out with this array configuration. The size of the missing components is unknown because mapping observation using a single-dish telescope has not done.
For the line data sets, we discuss only the detected compact components. Physical properties estimated from the velocity widths follow in Sections 3.4 and 3.6.
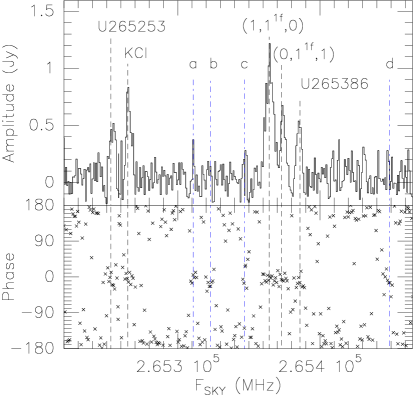
In addition to the two HCN transitions above, seven other molecular transitions are clearly detected (Figure 4). One of the detected HCN transitions is in the vibrational state of (0, 11f, 1), mentioned in Section 1. Molecular lines were identified mainly by comparing the observed frequencies with the line catalogs provided by NIST (SLAIM), JPL and Universitt zu Kln (CDMS). When there were multiple candidates for a spectral line feature, we checked the expected line strengths of the different transitions over the observed frequency ranges and identified most likely one. For the lines that don’t have other transitions in the band, we selected most likely one considering expected abundance in the circumstellar region.
Table 1 summarizes features of nine lines detected with the eSMA. It includes an isotopologue of silicon monosulfide, Si34S (=0), potassium chloride, KCl (), and two other HCN transitions in different vibrational states, =(1, 11f, 0) and (0, 11f, 1). The excitation temperatures of these transitions are about 5800 K and 4000 K, respectively. The HCN line has a relatively large shift to the red ( 2.7 MHz or 3 km s-1). This may be due to absorption from the hyperfine transitions (Morris et al., 1985) because of the nitrogen’s quadrapole coupling. The rest of the lines have smaller differences between the catalog and observed frequencies ( 700 kHz). The central velocities of molecular transitions may be slightly shifted because (1) some of the circumstellar shells are not perfect shells, (2) evolution of the molecular species, (3) optical depth of the molecular lines, and so on. The excitation of the HCN transitions will be discussed in Section 3.3. The distributions of these hot HCN transitions will be described in Section 3.4.
We detected the transition of KCl in the state. KCl was first detected at 3 mm by Cernicharo & Guelin (1987) along with other metals in the circumstellar envelope of IRC+10216. The transitions they detected were all in the state. This is the first detection of a KCl transition in a vibrationally excited state. The Si34S transition has a broader line width (full width at half maximum of 9.2 km s-1) with two peaks. It seems to have a wing component on the red-shifted side. The broad line feature of Si34S might be due to blending from other molecular line(s). However, the lines near the frequency were not found in the available catalogs. The line shapes of these transitions will be discussed in Section 3.6. The maps of these molecular transitions are shown in Section 3.4.
There were four other spectral features whose phases are tightly clustered within 50∘ from zero over 6 – 10 km s-1, signifying higher likelihood of detection, albeit at much lower amplitudes compared to the nine molecular lines described above. Their frequencies of 265.311, 265.323, 265.347, and 265.449 GHz, are marked as a, b, c and d in Figure 4. These four features are likely detections.
3.3 Excitation of the Hot HCN Lines and the KCl Lines
Excitation of the HCN lines in three different vibrational states and the KCl line are of interest because they exist in the innermost circumstellar envelope where dust and molecular species are forming and the molecular gas is being accelerated (see Section 3.6).
The excitation temperatures of the lower energy levels of these transitions, 5800 K for the =(1, 11f, 0) state and 4000 K for the =(0, 11f, 1) state, are much higher than the temperature at the inner edge of the envelope (600 – 1700 K; e.g., Men’shchikov et al. 2001 and references therein). It would be difficult to excite the transitions collisionally unless very high density gas ( 1010 cm-3 or so) is present in a large region ( 5′′ 700 AU or 300 ). It’s very unlikely that the condition is achieved for this case. The upper level of the molecules may be populated directly through the strong radiation of the stellar photosphere.
Figure 5 illustrates energy diagrams of selected transitions of HCN, H2, and CO. The observed rotational lines in three different vibrational states are drawn by thin horizontal lines and are magnified in the diagram. We propose that some of the HCN lines may be pumped through interaction with photons of some transitions of molecular hydrogen, those of CO lines, and the stellar radiation. The stellar luminosity of IRC+10216 is 2 104 L⊙ and the peak of the spectral energy distribution (SED) of the object is near 10 m (e.g. Cernicharo et al. 1999). In the near infrared band which is near the peak of the SED, such as at 2.5, 3.5, and 14 m, the molecules may be pumped to the vibrational states of HCN in the =(1, 11f, 0), (0, 11f.1), (0, 11e, 0), (1, 00, 0), and (0, 00, 1) states from the ground level to the exited states via the stellar radiation. Figure 5 also shows the excitation temperatures of H 1 state are close to that of the HCN (1, 11, 0) state and some of the transitions have energy levels very similar to that of HCN (1, 11, 0) state, indicating that a direct and rapid photon exchange can occur among the transitions. Furthermore, since CO transition is at 2.5 m, such photon exchange can occur with the HCN state as well.
The same excitation method, namely direct pumping from the strong infrared radiation at 14 m of the stellar photosphere, can explain the excitation of the KCl transition in the state.
These hot HCN lines and the KCl line may be maser lines as the stellar radiation must excite the transitions. If so, the maser lines of the transitions may not be fully saturated because their flux is not high.
3.4 Distribution of HCN, SiS, and KCl — the Properties of the Innermost Circumstellar Envelope
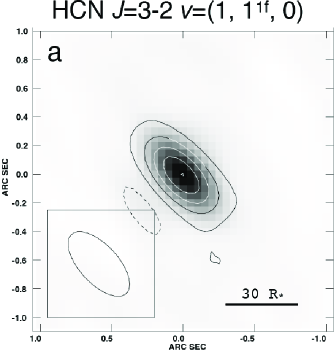
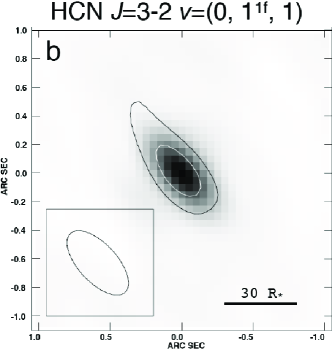
Integrated intensity maps of hot HCN emission in the =(1, 11f, 0) and =(0, 11f, 1) states are shown in Figure 6 (a) and (b) respectively. The distribution of the emission is not spatially resolved. The peak of the emission coincides with the stellar position. The radius of the distribution is less than 15 . The compact distribution supports the scenario that the pumping arises close to the stellar photosphere or at inner edge of the circumstellar envelope.
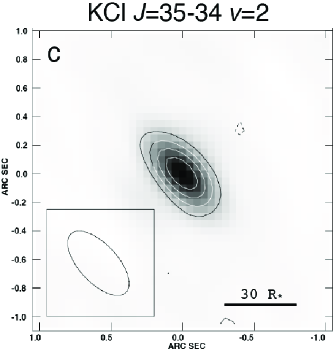
Figure 6 (c) and (d) show the integrated intensity maps of the transitions of KCl and Si34S. Both maps show that the emission originates from a region very close to the central star, very similar to the HCN maps of the =(1, 11f, 0) and =(0, 11f, 1) states. Both of the KCl component and the Si34S component are not significantly resolved. The Si34S emission is partially resolved. However, most of the emission originates from a compact region near the central star. The compact distribution of the Si34S transition and the peaky line features (Figure 4) may indicate that part of the emission arises from maser action. The distribution of KCl emission is very compact and the emission is not spatially resolved, most likely tracing inner edge of the envelope.
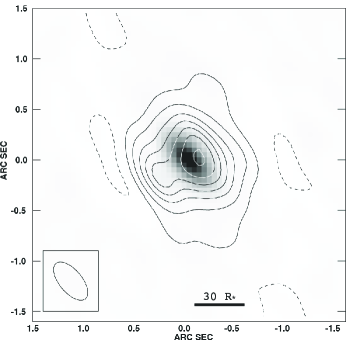
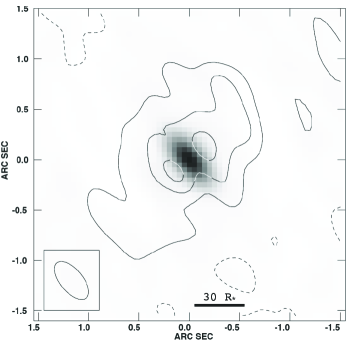
Total integrated intensity maps of the HCN =(0, 11e, 0) and transitions are shown in Figure 7. In contrast to the maps shown in Figure 6 that are not spatially resolved, the emission is much more extended. Most of the emission is found within a radius of 1′′, which corresponds to 60 . One can find two peaks along the northwest - southeast direction on both maps. The two peaks of both maps are displaced from the stellar position. The position angles () of the line drawing between two peak components in the =(0, 11e, 0) and in the states are 115∘ and 130∘, respectively. The distances of the two condensations of the =(0, 11e, 0) map are 90 mas and 300 mas from the central star. The two condensations of map are distributed more or less symmetrically at a distance of 200 mas from the central star. In the region at a distance of 200 mas from the star, the gas temperature is estimated to be a few 100 K (e.g., Keady et al. 1988).
Murakawa et al. (2005) reported that there are features with a low degree of linear polarization identified at 1.5 m in continuum emission. The authors concluded that low degree of linear polarization found inside the two features indicates that the density in the two regions is higher than that of the surrounding region. The two features called NW ellipse and SE fan by Murakawa et al. (2005) may be the same entities as the two HCN peaks traced with the HCN transition in the =(0, 11e, 0) state, because of their similarity in shapes, P.A., and the fact that both of them trace high density regions. However, comparing the locations of the polarization minima reported by Murakawa et al. (2005) and the HCN =(0, 11e, 0) peaks in Figure 7 (left) relative to the position of the central star, the HCN peaks are located at a distance from the central star only 60% of the distance between the polarization minima from the star. Please note that Murakawa et al. (2005) estimated the location of the central star based on their polarization map. It is not clear why the HCN peaks and the near infrared polarization minima lie on different locations. If it were due to time evolution, the two HCN peaks and the polarization minima might be tracing different entities because the HCN peaks are located closer compared to the polarization minima. It could be that the HCN peaks detected this time in 2008 might not have existed clearly when Murakawa et al made the observation in 2003 January. However, in that case, one can say that the direction of the most copious mass loss hasn’t changed over about 5 years.
From the two HCN peaks and those polarization features, we propose that this direction along the two HCN peaks of the HCN transitions may correspond to the direction of most conspicuous mass loss, and that this direction is the equatorial direction of the star. This proposition is consistent with the analysis of Murakawa et al. (2005) who discussed that the two linear polarization features may indicate the formation of an edge-on dust torus surrounding the carbon star. Discussion on the kinematics of the two HCN peaks and other surrounding components will follow in next section.
Note that there are a few other high angular resolution observations at near infrared (e.g., Weigelt et al. 2002; Menut et al. 2007). However, the location of the central star in their maps is uncertain so that it is difficult to compare their observed features with ours. In particular, we can’t find any of likely components that may correspond to the two HCN peaks/ the two polarization minima.
At near infrared (2.2m), Kastner & Weintraub (1994) and Skinner et al. (1998) identified a 10′′-size bipolar reflection nebula that is produced by scattering of radiation from the star by dust particles in the region. The axis of the bipolar reflection nebula is at of 30∘, which is almost perpendicular to that of the most conspicuous mass-loss direction described above. The axis of the bipolar reflection nebula supports the scenario that the mass loss is most copious in the direction of the two HCN peaks shown in the maps in Figure 7 and that infrared radiation can pass preferentially in the direction perpendicular to the most conspicuous mass-loss direction.
The significant difference in distribution between HCN emission in = 0/(0, 11e, 0) states and the HCN emission in the =(1, 11f, 0)/=(0, 11f, 1) states or KCl and Si34S emission leads us to conclude that there are two discrete regions in the innermost circumstellar envelope. One is a region of radius less than 15 where various molecular species have just formed and the gas is not accelerated by stellar radiation yet. We name this region region I. The other is a region outside of the region I, region II, where spectral lines indicate higher expansion velocity. These two discrete regions may have been created because the size distributions of the condensed dust particles are significantly different in these regions (see also Section 3.6). Dust nucleation may have further proceeded because temperature decreases rapidly as going outwards from the central star. We will discuss the properties of the region II in next section.
3.5 The Kinematics and The Distributions of the HCN =(0, 11e, 0) Maser Clumps
Figure 8 shows channel maps of the =(0, 11e, 0), transition that illustrate the detailed internal structures of the gas in region II. Note that the systemic velocity of the object is km s-1. The channel maps clearly show expanding shells. The expansion velocity of the shells, derived by fitting the spectrum integrated over the whole region, is up to 13 km s-1. The expanding shells are composed of many clumpy condensations.
There are a few prominent condensations along the most copious mass-loss direction. By following the maps at different velocities, one can identify shell-like features whose radii range from 11 to 22 . Partial shell structures are found in the channel maps at of 3.8 and 19.3 km s-1. The velocities are noted in the upper part of each panel. In other words, in these velocity ranges, the HCN maser condensations are distributed avoiding the stellar position. The radius of the shell is measured to be about 23 with a thickness of 15 . They may be the smallest shell-like structures identified to date in the circumstellar envelope of this star.
One can find one maser clump in the southeast side of the central star in the channel maps of 3.8 – 10.2 km s-1, noted in the upper part of each panel. Another maser clump is found in the channel maps of 15.7 – 19.3 km s-1 in the southeast side. Assuming these two clumps are located on the east side of the rim of the torus-like feature (see Section 3.4) and the clumps have had constant expanding velocities, the medium of the clumps may have departed from the central star 40 years ago. For the northeast side of the central star, a clump is seen in the channel maps of 4.7 – 13.8 km s-1, and another one is seen in the channel maps of 16.6 – 19.3 km s-1. Assuming a similar condition, i.e., the clumps are located on the west side of the rim of the torus-like feature (see Section 3.4) and the clump has had constant expanding velocities, the medium of the clumps may have been shed by the central star 100 years ago.
3.6 Acceleration of the Gas in the Innermost Circumstellar Envelope
One can gain insights on the acceleration of the gas due to the stellar radiation from the observed line widths and the spatial distribution. The molecular gas is accelerated through dust by sharing their momentum through dust-gas collisions as the dust particles receive the radiation pressure. Silicon carbide (SiC) can condense into dust particle very close to the stellar photosphere at a temperature of 1500 K (e.g. Men’shchikov et al. 2001) and they may evolve chemically as going away from the star, while graphite grains form at lower temperature of 600 – 1000 K or with radius of 5 – 20 R∗ (e.g. Men’shchikov et al. 2001). At the inner edge of the envelope, SiC may play a major role to accelerate the molecular gas outwards.
One can derive the expansion velocity by fitting line profiles. The line profiles were fitted assuming the envelope is spherically symmetric and expanding uniformly with the expansion velocity. We also assumed that the turbulence and thermal velocity is much smaller than the expanding velocity and the medium is ejected from the central star. Table 1 summarizes the expansion velocities and frequency differences between recommended frequencies and observed central velocities measured for each line.
The HCN transitions in the =0 and (0, 11e, 0) states have broad line widths of 13 km s-1, which is close to the terminal velocity of 15 km s-1 as observed from other molecular lines such as CO (Knapp & Morris, 1985) and CS (Young et al., 2004). In region II, both graphite grains and SiC concretion may contribute to the acceleration of the molecular gas. The eSMA resolved the emission in both vibrational states. The kinematics and distribution of the emission in the (0, 11e, 0) state are investigated in detail (Section 3.4).
It is very interesting that Si34S emission has the largest expansion velocity ( 16 km s-1) although the distribution is compact and is not significantly resolved (in Section 3.4). This expansion velocity is at the high end among the expansion velocities summarized in a detailed line survey study by Patel et al. (2008). Since the sublimation temperature of SiS is 1213 K (Hansen & Anderko, 1962), which may correspond to the temperature in an outer layer of the stellar photosphere, the SiS concretion mixtured with the SiS gas might receive the radiation pressure directly from the stellar radiation, rather than the SiS gas gains the momentum from surrounding dust particles in the region. The full width at half maximum of the Si34S line is only 9.2 km s-1. The large expansion velocity is due to the strong wing component in the redshifted side. It is known that the sulphur is involved in shock chemistry (e.g. Blake et al. 1987). It may arise from a shock region in the innermost envelope. The cause of the broad wing emission remains unsolved.
On the other hand, the rest of the lines which have lower expansion velocities of 7 km s-1, namely, HCN in the =(1, 11f, 0) and (1, 11f, 0) states, the emission of KCl in the =2 state, and all three unidentified lines, must be tracing the very innermost part of the envelope because the velocity becomes larger as a function of distance from the stellar photosphere (Goldreich & Scoville, 1976; Winters et al., 1994). The lowest expansion velocity is that for the HCN line in the =(1, 11f, 0) which has the highest energy level among the HCN lines. The small frequency/velocity shifts from the catalog frequencies of the narrow line width emission (see Table 1) also supports the scenario that the expansion velocities of those components must be very small because their velocities are close to the systemic velocity of the star. Even if the molecular components of these transitions have broken shells, since the expansion velocities are small, their central velocities should come to very close to the systemic velocity of the star.
4 SUMMARY
Using the eSMA, we investigated the properties of the innermost circumstellar envelope (CSE) of the bright carbon star, IRC+10216. HCN maser emission is spatially resolved for the first time in an astronomical object. KCl maser line in a vibrationally excited state is detected for the first time.
We identified two discrete regions in the innermost circumstellar envelope. One is a region with a radius of less than 15 where molecular species have just formed and the molecular gas has just started being accelerated by stellar radiation (region I). This region is traced by hot HCN and KCl lines, and Si34S line. Si34S line detected in region I shows a large expansion velocity of 16 km s-1with the broad wing emission unexpectedly. This might be partly because SiS is both in gas and solid phase and receives the radiation pressure directly from the strong radiation pressure from photosphere. It might be related to some kind of shock process in the innermost envelope. The other is a shell region with a radius of about 23 and with a thickness of 15 where the expansion velocity has reached up to 13 km s-1 (region II). These two discrete regions may have emerged because the size distributions of the condensed dust particles are significantly different in these regions, i.e., region II may hold larger dust particles or graphite grains. We identified the most copious mass loss direction using the HCN transition in the =(0, 11e, 0) and states. We propose that this direction corresponds to the equatorial direction of the star. The direction was found to be perpendicular to the near infrared bipolar reflection nebula and to be parallel to the features with a low degree of linear polarization identified at near infrared. The kinematics in region II are studied in detail using the HCN emission in the =(0, 11e, 0) state, which shows clumpy structures. Small shell-like features with a radius of 11 – 22 were identified in region II. A torus-like feature with a radius of 9 exists in region II. Assuming the expansion velocity has been constant, the medium of the most conspicuous HCN maser clumps may have been shed by the central star about 40 – 100 years ago.
We identified nine molecular transitions in total, including hot HCN maser transitions in the =(0, 11f, 1) and =(1, 11f, 0) states and KCl () and Si34S emission. These transitions may be excited directly by the strong infrared radiation from the stellar photosphere of the star and by line overlap of some of CO and H2 transitions for the HCN transition in the =(1, 11f, 0) state. From the observed line profiles, expansion velocities of each line are estimated. All the emission lines except for Si34S line have expansion velocities lower than the terminal velocity of the gas ( 15 km s-1) in the circumstellar envelope, which means that the observed emission traces the region where the acceleration due to strong stellar radiation is taking place. The HCN transition in the =(1, 11f, 0) state has the lowest expansion velocity of 3 km s-1, suggesting that it arises from the innermost part of the envelope among the lines detected in this observation. Region II has an expansion velocity of 13 km s-1.
Future observations with eSMA will allow us to constrain physical and chemical properties of the innermost circumstellar envelope further in detail and construct a concrete picture of the mass loss process in a transition phase from AGB to post AGB/proto-planetary nebula (PPN).
References
- Blake et al. (1987) Blake, G. A., Sutton, E. C., Masson, C. R., & Phillips, T. G. 1987, ApJ, 315, 621
- Bottinelli et al. (2008) Bottinelli, S. et al. 2008, Proc. SPIE, 7012, 7012-12
- Chantry (1971) Chantry, G.W., 1971, in Submillimeter Spectroscopy, ed. G.W. Chantry (London and New York: Academy Press), 241
- Cernicharo & Guelin (1987) Cernicharo, J., & Guelin, M. 1987, A&A, 183, L10
- Cernicharo et al. (1999) Cernicharo, J., Yamamura, I., González-Alfonso, E., de Jong, T., Heras, A., Escribano, R., & Ortigoso, J. 1999, ApJ, 526, L41
- Dehaes et al. (2007) Dehaes, S., Groenewegen, M. A. T., Decin, L., Hony, S., Raskin, G., & Blommaert, J. A. D. L. 2007, MNRAS, 377, 931
- Diamond & Kemball (2003) Diamond, P. J., & Kemball, A. J. 2003, ApJ, 599, 1372
- Gebbie et al. (1964) Gebbie, H. A., Stone, N. W. B., & Findlay, F. D. 1964, Nature, 202, 685
- Goldreich & Scoville (1976) Goldreich, P., & Scoville, N. 1976, ApJ, 205, 144
- Groesbeck et al. (1994) Groesbeck, T. D., Phillips, T. G., & Blake, G. A. 1994, ApJS, 94, 147
- Groenewegen et al. (1997) Groenewegen, M. A. T., van der Veen, W. E. C. J., Lefloch, B., & Omont, A. 1997, A&A, 322, L21
- Hansen & Anderko (1962) M. Hansen and K. Anderko, Constitution of Binary Alloys vol. 2, Metallurgizdat, Moscow (1962), p. 1122
- Hocker & Javan (1967) Hocker, L. O., & Javan, A. 1967, Physics Letters A, 25, 489
- Izumiura et al. (1995) Izumiura, H., Ukita, N., & Tsuji, T. 1995, ApJ, 440, 728
- Jenness et al. (2002) Jenness, T., Stevens, J. A., Archibald, E. N., Economou, F., Jessop, N. E., & Robson, E. I. 2002, MNRAS, 336, 14
- Kastner & Weintraub (1994) Kastner, J. H., & Weintraub, D. A. 1994, ApJ, 434, 719
- Keady et al. (1988) Keady, J. J., Hall, D. N. B., & Ridgway, S. T. 1988, ApJ, 326, 832
- Knapp & Morris (1985) Knapp, G. R., & Morris, M. 1985, ApJ, 292, 640
- Le Bertre (1997) Le Bertre, T. 1997, A&A, 324, 1059
- Lide & Maki (1967) Lide, D. R., Jr., & Maki, A. G. 1967, Applied Physics Letters, 11, 62
- Lucas & Guilloteau (1992) Lucas, R., & Guilloteau, S. 1992, A&A, 259, L23
- Menut et al. (2007) Menut, J.-L., et al. 2007, MNRAS, 376, L6
- Men’shchikov et al. (2001) Men’shchikov, A. B., Balega, Y., Blöcker, T., Osterbart, R., & Weigelt, G. 2001, A&A, 368, 497
- Moran et al. (1979) Moran, J. M., Ball, J. A., Predmore, C. R., Lane, A. P., Huguenin, G. R., Reid, M. J., & Hansen, S. S. 1979, ApJ, 231, L67
- Morris & Knapp (1976) Morris, M., & Knapp, G. R. 1976, ApJ, 204, 415
- Morris et al. (1985) Morris, M., Lucas, R., & Omont, A. 1985, A&A, 142, 107
- Murakawa et al. (2005) Murakawa, K., Suto, H., Oya, S., Yates, J. A., Ueta, T., & Meixner, M. 2005, A&A, 436, 601
- Neugebauer & Leighton (1969) Neugebauer, G., & Leighton, R. B. 1969, NASA SP, Washington: NASA, 1969
- Patel et al. (2008) Patel, N. A., et al. 2008, Ap.J. in press (arXiv:0811.2142)
- Pichamuthu (1974) Pichamuthu, J. P. 1974, Journal of Physics D Applied Physics, 7, 1096
- Reid & Muhleman (1978) Reid, M. J., & Muhleman, D. O. 1978, ApJ, 220, 229
- Ridgway et al. (1978) Ridgway, S. T., Carbon, D. F., & Hall, D. N. B. 1978, ApJ, 225, 138
- Sahai et al. (1989) Sahai, R., Claussen, M. J., & Masson, C. R. 1989, A&A, 220, 92
- Schilke & Menten (2003) Schilke, P., & Menten, K. M. 2003, ApJ, 583, 446
- Skinner et al. (1998) Skinner, C. J., Meixner, M., & Bobrowsky, M. 1998, MNRAS, 300, L29
- Shinnaga et al. (2004) Shinnaga, H., Moran, J. M., Young, K. H., & Ho, P. T. P. 2004, ApJ, 616, L47
- Weigelt et al. (2002) Weigelt, G., Balega, Y. Y., Blöcker, T., Hofmann, K.-H., Men’shchikov, A. B., & Winters, J. M. 2002, A&A, 392, 131
- Weisstein & Serabyn (1994) Weisstein, E. W., & Serabyn, E. 1994, Icarus, 109, 367
- Winters et al. (1994) Winters, J. M., Dominik, C., & Sedlmayr, E. 1994, A&A, 288, 255
- Young et al. (2004) Young, K. H., et al. 2004, ApJ, 616, L51
- Ziurys & Turner (1986) Ziurys, L. M., & Turner, B. E. 1986, ApJ, 300, L19
| aa Recommended frequency from catalog. | bb Observed center frequency. | cc Peak flux density observed with the interferometer. | Identification | ELdd Energy of the lower level of the transition relative to the ground state. | ee Expansion velocity. The numbers in parentheses represent one standard deviation in units of the last significant digit. | References for | |
|---|---|---|---|---|---|---|---|
| (MHz) | (MHz) | (Jy) | (K) | (km s-1) | (MHz) | Frequencies | |
| U264665 | … | 0.6 | 4.2 (6) | … | |||
| 264789.76 | 264790.50 | 0.8 | Si34S , | 88.9 | 16.3 (2) ff The line’s full width half maximum is 9.2 km s-1. | 0.7 | (1) |
| U265253 | … | 0.5 | 5.1 (3) | … | |||
| 265264.80 | 265265.43 | 0.8 | KCl , | 1012 | 4.1 (3) | 0.6 | (1) |
| 265364.36 | 265364.90 | 1.2 | HCN , =(0, 11f, 1) | 4045 | 6.8 (7) | 0.6 | (2) |
| 265373.12 | 265373.99 | 0.6 | HCN , =(1, 11f, 0) | 5773 | 3.2 (3) | 0.5 | (2) |
| U265386 | … | 0.5 | 3.5 (7) | … | |||
| 265852.71 | 265852.41 | 29 | HCN , =(0, 11e, 0) | 1036 | 12.8 (1) | +0.3 | (1) |
| 265886.19 | 265883.50 | 10 | HCN , =0 | 12.8 | 12.9 (1) gg The broadening effect due to hyperfine components is subtracted. | +2.7 | (1) |
Note. — References: (1) NIST catalog; (2) De Lucia and Helminger 1977.