Charge transport and magnetization profile at the interface between a correlated metal
and an antiferromagnetic insulator
Abstract
A combination of spectroscopic probes was used to develop a detailed experimental description of the transport and magnetic properties of superlattices composed of the paramagnetic metal CaRuO3 and the antiferromagnetic insulator CaMnO3. The charge carrier density and Ru valence state in the superlattices are not significantly different from those of bulk CaRuO3. The small charge transfer across the interface implied by these observations confirms predictions derived from density functional calculations. However, a ferromagnetic polarization due to canted Mn spins penetrates 3-4 unit cells into CaMnO3, far exceeding the corresponding predictions. The discrepancy may indicate the formation of magnetic polarons at the interface.
pacs:
73.21.Cd, 75.70.Cn, 73.20.-rRecent advances in the atomic-scale control of transition metal oxide interfaces offer new opportunities for the manipulation of strongly correlated electron systems. While first device applications are being explored ahn06 , there is growing awareness of the wealth of microscopic phenomena that need to be understood in order to arrive at a quantitative description of the electronic state at oxide interfaces. These include the polarity of the atomic layers comprising the interface nakagawa , lattice relaxations (which are particularly important for ferroelectric and quantum paraelectric materials) pentcheva , orbital reconstructions induced by misfit strain tebano and/or covalent bonding across the interface chakhalian1 , magnetic polarization due to the reduced coordination of magnetic atoms and/or exchange interactions across the interface chakhalian2 , and interface-specific disorder. This calls for simple model systems in which individual issues can be isolated, and the results of theoretical and experimental studies of buried interfaces can be quantitatively compared. A model system that has received particular recent attention is the weakly correlated metallic state at the interface between the band insulators SrTiO3 and LaAlO3, whose properties are controlled by interface polarity and lattice relaxations although there is still an ongoing debate about the role of defects (see Ref. huijbenrev, and references therein).
Another problem of fundamental interest is the interface between a correlated metallic state and an antiferroagnetic insulator, two of the most extensively investigated ground states of bulk transition metal oxides. As theoretical research is beginning to address the length scales for the intermixing of metallicity and antiferromagnetic order in this situation rosch ; nanda , the interface between the correlated paramagnetic metal CaRuO3 (Refs. kamal, ; lee, ; mazin, ) and the antiferromagnetic insulator CaMnO3 (Ref. neumeier, ) is emerging as a model system where these issues can be explored experimentally without interference from interface polarity, incipient ferroelectricity, extensive disorder or misfit strain, and orbital degeneracy. Whereas bulk CaMnO3 is a -type antiferromagnet (that is, the Mn spin orientation alternates along all nearest-neighbor bond directions of the nearly cubic perovskite lattice), prior magnetometry takahashi and magneto-optical yamada studies of CaRuO3-CaMnO3 superlattices revealed a ferromagnetic moment centered at the interface. Based on density functional calculations, this was attributed to leakage of a small number of itinerant electrons from CaRuO3 into the first atomic layer of CaMnO3, where they actuate a ferromagnetic double exchange interaction and induce canting of the Mn spins nanda .
In this Letter we combine several spectroscopic probes of CaRuO3-CaMnO3 superlattices including far-infrared (FIR) spectral ellipsometry, x-ray absorption spectroscopy (XAS), x-ray magnetic circular dichroism (XCMD), and x-ray resonant magnetic scattering (XRMS) in order to develop a comprehensive experimental description of the charge transport properties as well as the valence state and magnetic polarization of Ru and Mn atoms near the interface. We find that the charge transfer across the interface is small, and that the net magnetization of the superlattices arises mostly from canted Mn spins near the interface, confirming corresponding predictions of the density functional calculations nanda . Surprisingly, however, the penetration depth of the ferromagnetic polarization in CaMnO3 is 3-4 unit cells (u.c.), greatly exceeding the theoretically predicted length scale of 1 u.c. Based on an analogy to lightly doped bulk CaMnO3, we attribute the large ferromagnetic penetration depth to polaronic effects not included in the calculations.
A series of superlattices, LaAlO3 (001)/[CaMnO3(10 u.c.)/CaRuO3(N u.c.)]6, with to 10 consecutive CaRuO3 unit cells were grown by pulsed laser deposition with a KrF excimer laser ( = 248 nm, J=1 J/cm2) at a substrate temperature of 720∘C in 10 mTorr of pure oxygen, using stoichiometric sintered targets. Upon deposition, all samples were in-situ annealed in 50-100 mTorr of oxygen for 5-10 minutes, and then gradually cooled down to room temperature. Reflection high-energy electron diffraction (RHEED) oscillations observed in situ as well as spectroscopic data and XRMS profiles taken on the finished specimens demonstrate flat, atomically sharp interfaces. In agreement with prior work on this system takahashi ; yamada , magnetic susceptibility measurements on both samples indicate a net magnetization upon cooling below 120 K, coincident with the Néel temperature of bulk antiferromagnetic CaMnO3. The FIR experiments were conducted at beamline IR1 at the ANKA synchrotron in Karlsruhe, Germany, bernhard with angles of incidence ranging from 70 to 85∘. The XAS and XMCD measurements were performed at beamline 4-ID-C of the Advanced Photon Source, with magnetic fields of up to 7 T applied in the plane of the superlattices. The measurements were performed by monitoring the intensity, , of left () and right () circularly polarized x-rays absorbed by the specimen using the surface/interface sensitive total-electron-yield detection described previously chakhalian2 ; chakhalian1 . The sum, +, yields the XAS signal, while the XMCD signal is derived from the difference, . The XRMS experiments were carried out at the SIM beamline at the Swiss Light Source using the RESOXS chamber jaouen . The reflected intensities and were collected for two opposite directions of a magnetic field applied along the intersection of the superlattice and scattering planes. The amplitude of the magnetic field available in the chamber is 0.16 T, which sufficient to field cool the sample into a partially magnetized state with a net magnetization of 25% of the saturation value.
 |
 |
 |
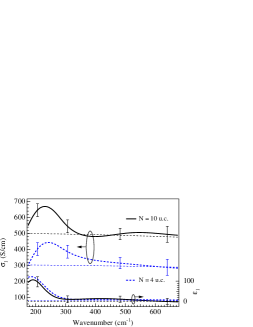
The charge transport properties of the CaRuO3-CaMnO3 superlattices were determined by FIR ellipsometry, which yields the frequency-dependent complex dielectric function, , without the need for reference measurements and Kramers-Kronig transformations. In contrast to dc transport experiments, this method is insensitive to the influence of substrate-induced steps or strain-induced dislocations on the current flow through the atomically thin layers, and it avoids complications arising from the attachment of electrical contacts. Fig. 1 shows the real parts of the dielectric function, , and the optical conductivity, , of the and 10 superlattices, which were extracted from the ellipsometric parameters measured at various angles of incidence using a nonlinear regression analysis tompkins . Both data sets are well described by a broad Drude response with a ratio of scattering rate and plasma frequency , which is typical for bulk single-crystalline CaRuO3 (dashed lines in Fig. 1). (Note that the parameters in the Drude fit are well constrained, because both and are available. ) The effective number of charge carriers per Ru atom extracted from a sum-rule analysis, = (where is the free-electron mass and the density of Ru atoms), is identical for both and 10 samples. It also agrees (within the measurement error) with the corresponding quantity reported for bulk CaRuO3 kamal ; mazin . These results indicate that even in the sample the conductivity of the metallic layers is not significantly disrupted by Ru-Mn interdiffusion, testifying to the high quality of the interfaces. They are also consistent with the theoretical prediction that only % of the charge carrier density in the CaRuO3 atomic layer closest to the interface is transferred across the interface. A reduction of the Drude weight corresponding to a charge transfer of this magnitude is within the error of the FIR data.
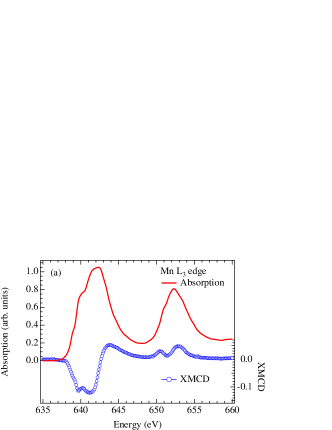
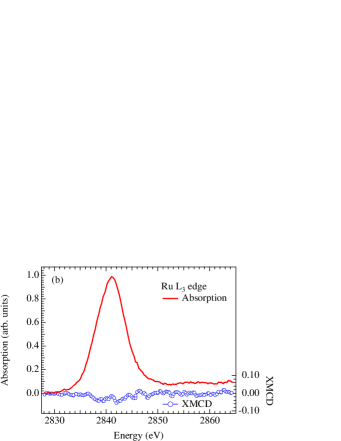
XAS measurements near the Ru and Mn L3 absorption edges yield complementary information on the charge transfer across the interface. From a comparison of the absorption profiles (solid lines in Fig. 2) to reference compounds abbate ; saitoh ; ruxas3 ; ruxas2 ; ruxas1 , we conclude that both Mn and Ru are close to the 4+ valence state. Specifically, in the sample (where half of the Ru atoms are at the interface) a substantial change in the Ru valence state due to charge transfer across the interface would result in a noticeable multiplet splitting of the Ru absorption peak due to population of orbitals, similar to that seen in compounds containing Ru4+-Ru5+ mixtures ruxas3 ; ruxas2 ; ruxas1 . From the absence of this splitting in the data of Fig. 2b we infer an interfacial Ru valence close to 4+, consistent with the FIR data and with the predictions of Ref. nanda, .
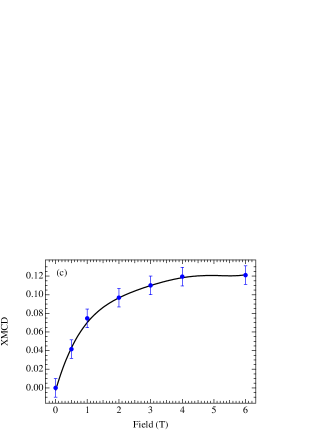
The XMCD signals from the polarized XAS measurements yield information about the contribution of each constituent transition metal ion to the net magnetization (see Fig. 2). While the Ru XMCD does not exceed 3%, a clear XMCD signal of % is observed at the Mn L-edge for both samples in a magnetic field of 7 T and does not seem to depend on , which is consistent with previous worktakahashi . Comparing with Ru XMCD references places an upper bound of on the net magnetic moment per Ru atom while the Mn XMCD corresponds to an average moment of 1 per Mn atomterai , which implies that the net magnetization is dominated by CaMnO3, consistent with the theoretical work of Ref. nanda, . The Mn XMCD data also provide two pieces of evidence supporting the theoretically predicted canted antiferromagnetic state localized near the interface. First, the XMCD signal is substantially lower than expected if the layers were fully ferromagneticterai , and it does not exhibit significant hysteresis effects. Second, the XMCD for both superlattices vanishes upon heating above 100-120 K, the Néel temperature of bulk CaMnO3, yet control measurements on an isolated CaMnO3 film grown on SrTiO3 (not shown) revealed no XMCD signal above background, which implies that the Mn magnetism is due to the CRO/CMO interface and not due to the entire CMO layer.
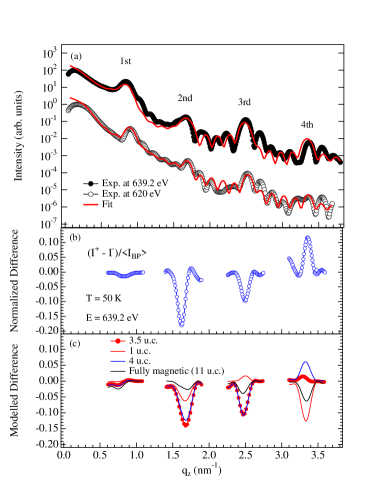
In order to determine the length scale of the interface-induced ferromagnetic polarization, we have performed XRMS measurements with circularly polarized x-rays at two photon energies in the vicinity of the Mn L3 absorption edge. The resonant reflectivity in the charge channel (+) exhibits a series of Bragg peaks characteristic of the superlattice periodicity, separated by interference fringes due the finite thickness of the sample (see Fig. 3(a)). The first photon energy (620 eV) was chosen off resonance allowing a structural analysis not relying on the knowledge of the resonant scattering factor (use of tabulated atomic scattering factor). The second one (639.2 eV, corresponding to the inflexion point of the edge) was chosen to reduce the x-ray absorption while maximizing the real part of the magnetic scattering factorchoi ; jwf . The analysis required knowledge of the structural parameters of the superlattices (thickness, roughness, and density of the layers) which were derived from a refinement of off-resonant reflectivity data recorded at 620 eV and confirmed by the refinement of the resonant reflectivity using the resonant scattering factor derived from the XAS measurementsstructure . Although the fits exhibit some discrepancies with the data between the Bragg peaks, the relative intensities of the Bragg peaks and the widths of the intense ones are well described.
The magnetic profile is probed by the the charge-magnetic scattering in the signalchoi ; jwf . Fig. 3(b) displays the difference measured on top of the first four Bragg peaks normalized to the corresponding peak intensity (upper panel), as well as the results of simulations of this quantity for several models of the magnetic profile (see Fig. 3(c)). For the case of a superlattice, the key point is the evolution due to the cross correlation of the charge and magnetic scattering in the XRMS signal. When the magnetic profile differs from the chemical profile, the sign varies depending on the thickness of the magnetic layer within the charge layer (see Fig. 3(c)). By considering a simple symmetric step profile for the magnetization in CaMnO3, composed of equally thick magnetic layers at the interfaces and a non-magnetic core layer, we can study the evolution of the sign and gain insight into the thickness of the magnetic layer near the interface.
The simulated and observed intensities show very good agreement for an interfacial thickness of 1.38 nm (3.5 u.c.). This model reproduces both the experimentally observed sign sequence of at the Bragg peaks and its relative amplitude. The absolute magnitude of the normalized difference was calculated with the constraint that its integral equals the XMCD signal discussed above (scaled for the lower applied magnetic field, see Fig. 2c). As shown in Fig. 3(c), the result also agrees closely with the experimental data. Despite its simplicity, the model therefore provides an excellent description of the salient features of the XRMS data. From this we conclude that the ferromagnetic polarization is not limited to the immediate vicinity of the interface, as theoretically predicted nanda , but extends further into the CMO layer. Specifically, a model in which the net magnetization arises entirely from the first CaMnO3 unit cell at the interface is ruled out by the behavior of at the third- and fourth-order Bragg peaks.
Prior work on lightly La-doped bulk CaMnO3 provides clues to the increased length-scale of the magnetic interface layer and the origin of the remarkably effective disruption of the antiferromagnetic order by a small density of electrons. Specifically, it was shown that this system exhibits a net magnetization of for each electron donated by La neumeier . Based on transport cohn and neutron scattering measurements argyriou as well as model calculations meskine , this effect was attributed to the formation of a magnetization cloud extending over Mn sites around the electron due to the ferromagnetic double exchange interaction it actuates between neighboring Mn spins, in conjunction with local lattice distortions. A closely related “orbital polaron” effect has also been investigated in lightly hole-doped manganates khaliullin . A similarly extended cloud of polarized Mn spins around electrons transferred across the CaRuO3-CaMnO3 interface would explain the large ferromagnetic penetration depth we observed. Further work is required to assess whether the magnetic polarons form a narrow band, or whether they localize in a charge-ordered state or in the vicinity of defects at the interface. In any case, our results suggest that magnetic polarons, which have been extensively investigated in bulk manganates and other transition metal oxides, strongly influence the physical properties of oxide interfaces and should therefore be considered in future theoretical work on this issue.
Work at Argonne, including the Advanced Photon Source, is supported by the U.S. Department of Energy, Office of Science, under Contract No. DE-AC02-06CH11357. We thank Y.-L. Mathis for the support at ANKA. JC was supported by DOD-ARO under the Contract No. 0402-17291 and NSF Contract No. DMR-0747808. HNL was sponsored by the Division of Materials Sciences and Engineering, U.S. Department of Energy. Work at SLS is supported by the European Commission under the 6th Framework Programme: Strengthening the European Research Area, Research Infrastructures. Contract no : RII3-CT-2004-506008.
References
- (1) C.H. Ahn et al. Rev. Mod. Phys. 78, 1185 (2006).
- (2) N. Nakagawa, H. Y. Hwang, and D.A. Muller. Nature Mat. 5, 204 (2006).
- (3) R. Pentcheva and W.E. Pickett, Phys. Rev. B 78, 205106 (2008).
- (4) A. Tebano et al., Phys. Rev. Lett. 100, 137401 (2008).
- (5) J. Chakhalian et al., Science 318, 1114 (2007).
- (6) J. Chakhalian et al., Nat. Phys. 2, 244 (2006).
- (7) M. Huijben et al., arXiv:0809.1068 (2008).
- (8) B.R.K. Nanda, S. Satpathy, and M. S. Springborg, Phys. Rev. Lett. 98, 216804 (2007).
- (9) R.W. Helmes, T.A. Costi, and A. Rosch, Phys. Rev. Lett. 101, 066802 (2008).
- (10) S. Kamal et al., Phys. Rev. B 74, 165115 (2006).
- (11) Y.S. Lee et al., Rev. B 66, 041104 (2002).
- (12) I.I. Mazin and D.J. Singh, Rev. B 56, 2556 (1997); ibid. 73, 189903 (2006).
- (13) J.J. Neumeier and J.L. Cohn, Phys. Rev. B 61, 14319 (2000).
- (14) K.S. Takahashi, M. Kawasaki, and Y. Tokura, Appl. Phys. Lett. 79, 1324 (2001).
- (15) H. Yamada et al., Appl. Phys. Lett. 92, 062508 (2008).
- (16) C. Bernhard et al., Thin Solid Films 455-456, 143 (2004).
- (17) N. Jaouen et al., J. Synchrotron Rad. 11, 353 (2004).
- (18) H.G. Tompkins and E.A. Irene, eds., Handbook of Ellipsomety (Springer, Germany, 2005); A.V. Tikhonravov and M.K. Trubetskov, Optilayer Thin Film Software, http://www.optilayer.com
- (19) M. Abbate et al., Phys. Rev. B 46, 4511 (1992).
- (20) T. Saitoh et al., Phys. Rev. B 51, 13942 (1995).
- (21) G.V.M. Williams, L.Y. Jang, and R.S. Liu, Phys. Rev. B 65, 064508 (2002).
- (22) R. S. Liu et al., Phys. Rev. B 63, 212507 (2001).
- (23) Z. Hu et al., Phys. Rev. B 61, 5262 (2000).
- (24) K. Terai et. al. Phys. Rev. B 77, 115128 (2008).
- (25) Y. Choi et al., Phys. Rev. B 70, 134420 (2004).
- (26) J.W. Freeland et al., J. Phys. Cond. Mat. 19, 315210 (2007).
- (27) The layer parameters derived from x-ray data for the nominally sample ( for CaMnO3, for CaRuO3, corresponding to , and an overall roughness of for both layers probably mostly originating from a low density of substrate steps) deviate slightly from those inferred from RHEED. This was taken into account in the analysis of the XRMS profiles.
- (28) J.L. Cohn, C. Chiorescu, and J.J. Neumeier, Phys. Rev. B 72, 024422 (2005); C. Chiorescu, J.L. Cohn, and J.J. Neumeier, ibid. 76, 020404(R) (2007).
- (29) C.D. Ling et al., Phys. Rev. B 68, 134440 (2003).
- (30) H. Meskine, T. Saha-Dasgupta, and S. Satpathy, Phys. Rev. Lett. 92, 056401 (2004); H. Meskine and S. Satpathy, J. Phys.: Condens. Matter 17, 1889 (2005).
- (31) R. Kilian and G. Khaliullin, Phys. Rev. B 60, 13458 (1999).