now at: ]Physikalisches Institut, Ruprecht-Karls-Universität Heidelberg, Philosophenweg 12, D-69120 Heidelberg, Germany
Photoassociation and coherent transient dynamics in the interaction of ultracold rubidium atoms with shaped femtosecond pulses - II. Theory
Abstract
Photoassociation of ultracold rubidium atoms with femtosecond laser pulses is studied theoretically. The spectrum of the pulses is cut off in order to suppress pulse amplitude at and close to the atomic resonance frequency. This leads to long tails of the laser pulse as a function of time giving rise to coherent transients in the photoassociation dynamics. They are studied as a function of cutoff position and chirp of the pulse. Molecule formation in the electronically excited state is attributed to off-resonant excitation in the strong-field regime.
pacs:
32.80.Qk,34.50.RkI Introduction
Cooling, trapping and manipulation of atoms and molecules in the ultracold regime (K) represents one of the most active research fields in contemporary atomic, molecular, and optical physics. Photoassociation is the formation of molecules when two colliding atoms are excited by laser light into bound vibrational levels of an electronically excited state. Using continuous-wave lasers, photoassociation of ultracold atoms can be employed to study collisional properties of ultracold atoms, in particular long-range potential energy curves Jones et al. (2006). If followed by spontaneous emission, it also serves to form ultracold molecules in their electronic ground state Masnou-Seeuws and Pillet (2001).
The use of short laser pulses for photoassociation of ultracold atoms has been suggested in theory work for about a decade Vardi et al. (1997); Vala et al. (2000); Luc-Koenig et al. (2004); Koch et al. (2006a, b, c); Shapiro et al. (2007); Poschinger et al. (2006). Initially, the main goal was to find a photoassociation scheme that would allow for larger formation rates of excited state molecules Vala et al. (2000); Luc-Koenig et al. (2004). In order to coherently produce ultracold molecules in their electronic ground state, the pump-dump scenario was adapted to photoassociation Koch et al. (2006a, b, c): A pump pulse creates a vibrational wavepacket on the electronically excited state which travels toward its inner turning point where it is sent to the ground state by the dump pulse. Other coherent control schemes such as adiabatic passage Shapiro et al. (2007) and pulse optimization using genetic algorithms were investigated as well Poschinger et al. (2006). Coherent photoassociation using short laser pulses is closely linked to the ultimate goal of ultracold molecule formation, the stabilization of the molecules into their vibrational ground state Danzl et al. (2008); Ni et al. (2008); Deiglmayr et al. (2008); Lang et al. (2008). This has been discussed in theory work in the context of optimal control Koch et al. (2004) and coherent pulse accumulation Pe’er et al. (2007).
In the theoretical studies on short-pulse photoassociation, pulses with a spectral bandwidth of a few wavenumbers were suggested. This choice is motivated by the requirement of exciting a narrow band of transitions with large free-bound Franck-Condon factors close to the atomic resonance without exciting atomic transitions. This spectral bandwidth corresponds to transform-limited pulse durations of a few picoseconds. However, pulse shaping capabilities for such pulses have yet to be developed.
Femtosecond pulses on the other hand can be shaped with a number of techniques, but they have a very broad spectrum, addressing both molecular and atomic transitions. Since the probability of atomic transitions is several orders of magnitude larger than that of photoassociation transitions, the pulse spectral amplitude at the atomic resonance frequency needs to be completely suppressed in order to record any molecular signal. This is most easily achieved by putting a knife edge into the Fourier plane of the pulse shaper Salzmann et al. (2006). The corresponding sharp cutoff in the spectrum of the femtosecond pulse leads to long tails of the pulse as a function of time and induces coherent transient dynamics Dudovich et al. (2002); Monmayrant et al. (2006). The transients are reflected in oscillations of the molecular population and can be measured by ionization detection of the excited state molecules Salzmann et al. (2008). Photoassociation of ultracold atoms with shaped femtosecond laser pulses has thus been demonstrated recently in a break-through experiment Salzmann et al. (2008).
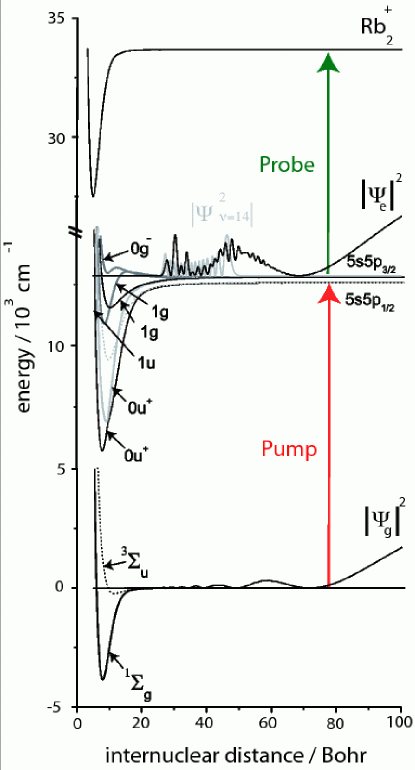
This paper presents a detailed explanation of the experimental results obtained by femtosecond photoassociation of ultracold rubidium atoms with shaped pulses based on theoretical calculations. The details of the experimental setup as well as the major part of the experimental results is found in Ref. Salzmann et al. (2009). Figure 1 depicts the proposed photoassociation mechanism including the potential energy curves considered in the calculations. A first laser field (the pump pulse, indicated by the red arrow) excites two atoms from their ground state (5s+5s) into long-range bound molecular levels of an electronically excited state (correlated to the 5s+5p1/2 or 5s+5p3/2 asymptotes). The initial scattering state with a relative scattering energy corresponding to the trap temperature of 100K is shown on the ground state. The excited state wavefunction after the pulse is over as well as one exemplary excited state vibrational wavefunction are displayed in the first excited state of Fig. 1. In order to detect the excited state molecules, a second laser field (the probe pulse, indicated by the green arrow) transfers them to the ionic state.
The paper is organized as follows: Section II briefly reviews the theoretical description of two rubidium atoms excited by a photoassociation laser pulse. The photoassociation mechanism based on strong-field off-resonant excitation is described in detail in Sec. III while the coherent transient dynamics are studied in Sec. IV. Theoretical and experimental results are compared in Sec. V and Sec. VI concludes.
II Theoretical Approach
In order to gain detailed insight into the mechanism of femtosecond photoassociation, the pump excitation step was simulated in quantum dynamical calculations of the light-molecule interaction. The pump pulse transfers population between the ground and first excited electronic states. The probe step was not explicitly taken into account. Rather, it was assumed that any population of the first excited state is ionized alike.
In a two-channel picture, the Hamiltonian describing two rubidium atoms subject to excitation by a laser field in the dipole and rotating-wave approximations is given by
| (1) |
Here, denotes the internuclear distance, the kinetic energy operator and the ground and excited state potential energy curves. The parameter =() represents the detuning of the pump pulse central frequency relative to the and asymptotes, respectively. The off-diagonal elements of the Hamiltonian describe the electric dipole coupling with denoting the transition dipole and the electric field of the pump pulse. The -dependence of the transition dipole was neglected which is justified for excitation at long range.
A two-channel picture assumes that no couplings between electronic states, for example due to spin-orbit interaction, play a role on the timescale of the dynamics. It is then possible to consider pairwise combinations of ground and excited electronic states in Eq. (1). An analysis of the dynamics has confirmed that this assumption is justified: The dynamics are purely long-range and dominated by electronic transitions due to the laser field.
The potential energy curves are taken from Ref. Park et al. (2001) and matched to the long-range dispersion potentials, with the coefficients found in Refs. Marte et al. (2002); Gutterres et al. (2002). Potential energy curves in the Hund’s case (c) representation were obtained by approximating the spin-orbit couplings by their asymptotic values and subsequent diagonalization, see e.g. Ref. Wang et al. (1997). Of all potential curves correlating to the and asymptotes, those with attractive character and dipole-allowed transitions were taken into account (, and correlating to the 5s+5p1/2 asymptote and , , and correlating to the 5s+5p3/2 asymptote). Moreover simulations were also performed for two repulsive potential energy curves, those of the and states. Note that the excited state potentials differ by their effective coefficients and strengths of transition dipole moment.
The Hamiltonian, Eq. (1), is represented on a mapped Fourier grid Kokoouline et al. (1999); Willner et al. (2004). Vibrational wavefunctions such as the one for of the excited state shown in Fig. 1 are obtained by diagonalizing the Hamiltonian with set to zero. The photoassociation dynamics were studied by numerically solving the time-dependent Schrödinger equation (TDSE),
| (2) |
using the Chebyshev propagator Kosloff (1988). denotes the ground (excited) state component of the time-dependent wavefunction. The initial state is taken to be the scattering state with scattering energy closest to where denotes the Boltzmann constant and the temperature of the trap. In principle an average over all thermally populated scattering states needs to be performed Koch et al. (2006c). However, since the dynamics are dominated by electronic transitions, the different nodal structures of the scattering states at very large distances do not play a role and simulations for a single initial state are sufficient.
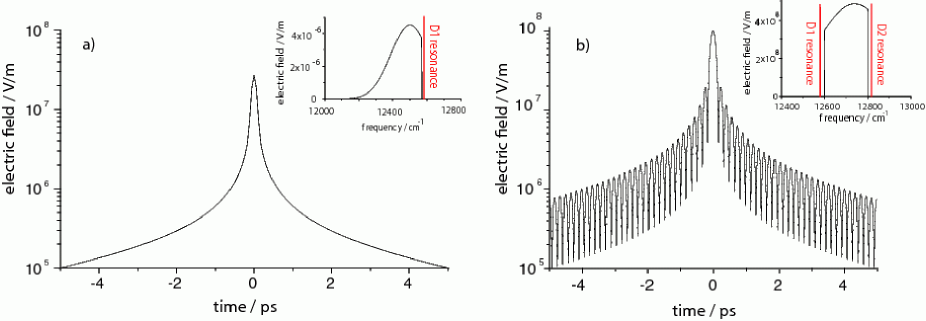
The pulses entering Eqs. (1) and (2) were obtained similar to the experimental procedure. In the experiment an optical low pass filter was employed in the Fourier plane of the zero dispersion compressor to manipulate the spectral shape of the pump pulse close to the D1 or D2 atomic line in such a way, that all frequencies above the chosen atomic resonance, the respective resonance frequency itself, and some frequencies below this particular line were cut off. This is done in order to prevent the loss of the captured atoms due to resonant three-photon ionization and photon pressure Salzmann et al. (2006). In the case of excitation near the D2 line, perturbing frequencies near the D1 atomic resonance due to the large spectral bandwith of the femtosecond pulse were also removed from the pump pulse spectrum. In order to model those experimental pump pulses, a Gaussian transform-limited laser field is subjected to one or two cuts of spectral amplitude in the frequency domain. The sharp cuts lead to very long transients of the pulse in the time-domain representation, cf. Fig. 2, i.e. the temporal behavior strongly deviates from a transform limited profile. The pulse has long tails, reaching out to a few picoseconds before and after the maximum as shown in Fig. 2. If two cuts are applied, the tails show a beat pattern that depends on the specific cut positions, cf. Fig. 2(b). Within the tails, the electric field oscillates with a frequency that matches the spectral cutoff frequency, cf. Fig. 4. The influence of the specific shape of the pump pulses in time and frequency domain on the dynamics will be discussed in Sec. IV. The parameters defining the pulse are the central wavelength, spectral width, energy, linear chirp rate and spectral cutoff positions.
The time-dependent population of the first electronically excited state is calculated as weighted sum of the possible transitions from the singlet ground and lowest triplet state with the ratio 1:3. In order to take the finite duration of the probe pulse into account, the measured ion signal was obtained by convoluting the time-dependent excited state population with a Gaussian of 500 fs full-width at half maximum (FWHM)111All full widths at half maximum are taken with respect to the intensity profile..
III Photoassociation
The photoassociation dynamics is illustrated in Fig. 1 by the nuclear wavefunctions, and , in the ground and excited state potentials, when the pulse is over, at about ps after the pump pulse maximum. The lowest triplet state and excited state were employed in this example. Pump pulse parameters like pulse energy and cutoff position correspond to those used in the actual experiment. Specifically, the cutoff positions for the example displayed in Fig. 1 and Fig. 3(b), were cm-1 and cm-1 below the D2 resonance, the central wavelength nm, spectral bandwidth nm, laser power mW, repetition rate kHz and beam radius m, corresponding to a peak field amplitude of 99 MV/m. Inspection of Fig. 1 reveals that no nuclear dynamics has taken place on the time scale of the pulse including its long tails: The excited state wave packet, created by the pump pulse, completely reflects the nodal structure of the initial scattering state at long range. This is not surprising since the vibrational periods of weakly bound excited state levels are on the order of several tens of picoseconds, while the ground state dynamics evolves even more slowly.
The excited state wave packet at a certain time can be projected onto the vibrational eigenfunctions of the corresponding excited state potential. This yields the vibrational distribution and proves that photoassociation, i.e. the excitation of free colliding atoms into bound levels of an excited state, has taken place. The vibrational distribution after the pulse is shown for the state in Fig. 3(a) and for the state in Fig. 3(b). The cutoff position was chosen to be cm-1 below the respective atomic resonance, i.e. below the D1 line frequency in Fig. 3(a) and below the D2 line frequency in Fig. 3(b).
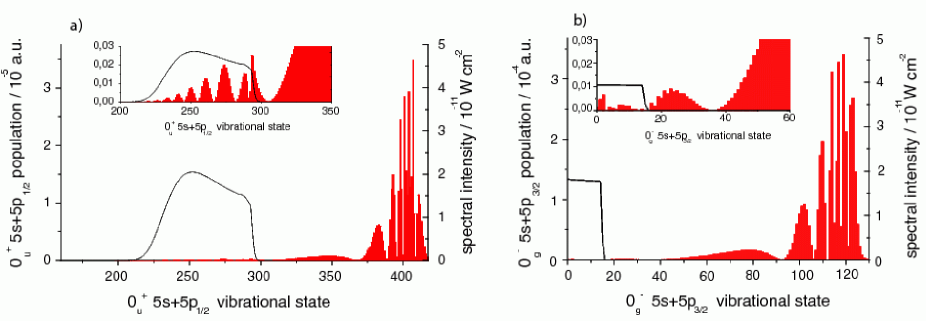
In Fig. 3(a), the vibrational distribution is characterized by a maximum near . These vibrational levels have large bond lengths on the order of and low binding energies of about 1 GHz or 0.03 cm-1. They lie energetically above the spectral cutoff of the pulse. Their population therefore necessarily arises from off-resonant excitation. This is caused by the high peak intensity of the pump pulse. Only a small fraction of the total excited state population resides in vibrational levels that are resonant within the pump pulse spectrum. For a spectral cutoff detuned by -15 cm-1 from the atomic line, resonant excitation occurs for vibrational levels below , cf. inset of Fig. 3(a). Compared to the weakly bound, long range levels around , their population is suppressed by two orders of magnitude. This is due to much smaller free-bound Franck-Condon factors. The distribution among these levels reproduces the weak-field result, i.e. it is proportional to the Franck-Condon factors multiplied by the spectral envelope of the pump pulse Poschinger et al. (2006); Shapiro and Brumer (2003). The apparant contradiction of producing within one calculation weak-field (below ) and strong-field (near ) results is easily resolved by noting that the decisive quantity is the Rabi frequency, i.e. the product of transition dipole and electric field. Since the Franck-Condon factors vary over several orders of magnitude, qualitatively different results are obtained for different regions of the excited state vibrational spectrum.
A pattern similar to that of the D1 line results is observed for the D2 line, cf. Fig. 3(a) and (b). In this case, the excited state potential, the purely long range state, is only about 28 cm-1 deep and resonant excitation occurs for vibrational levels below . Due to the shallowness of the potential, only a small part of the pulse spectrum serves for excitation, cf. the inset of Fig. 2(b). If an excited state potential with a deep minimum such as that of the state is employed (data not shown), a picture equivalent to Fig. 3(a) emerges. In both cases the vibrational spectrum is dominated by levels which are off-resonantly excited, above for the state (with binding energies of less than 0.05 cm-1 or 1.5 GHz). It is instructive to compare the amplitudes of the excited state vibrational level with and the excited state wave packet after the pulse, shown in Fig. 1, to the vibrational distributions of Fig. 3(b). The short range part of the wave packet at internuclear distances corresponds to vibrational levels with . The total excited state population is dominated by the weakly bound levels and electronically excited continuum states. Population of the latter, however, corresponds to excitation of the initial colliding atom pair to an excited pair of free atoms and cannot be regarded as photoassociation.
IV Coherent transient dynamics
Solving the time-dependent Schrödinger equation allows for a detailed study and analysis of the dynamics induced by the pump pulse. Figure 4 displays the excited state population, , and the frequency of the induced dipole, i.e. the derivative of the time-dependent phase, , of (red dashed lines in Fig. 4 a, c, d, f) as a function of time and compares them to the envelope and the instantaneous frequency of the pump pulse (black solid lines in Fig. 4 a, c, d, f).
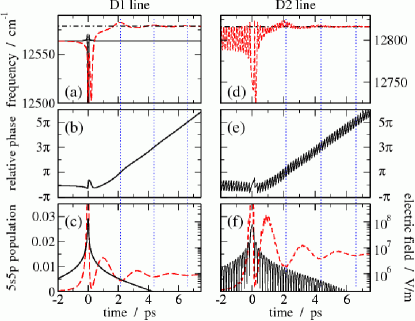
Also shown is the relative phase between the transition dipole and the field, i.e. (solid black line in Fig. 4 b). Characteristic oscillations of the excited state population are observed which are due to the long tails of the electric field with cut spectrum, cf. Fig. 4 c. They correspond to the coherent transients Shapiro and Brumer (2003) that have been observed before in the excitation of atoms with short pulses, see e.g. Refs. Dudovich et al. (2002); Monmayrant et al. (2006). Note that in our case, a molecular signal is observed in the ionization detection Salzmann et al. (2009).
The transient interaction of the weakly bound molecule and the pulse is governed by the induced transition dipole, in particular by the relative phase between the induced dipole and the field. The dynamics obtained for a single spectral cut, i.e. for excitation below the D1 line (left-hand side of Fig. 4), is discussed first. In this case, the instantaneous frequency of the laser pulse, shown by the black solid line in Fig. 4 a, coincides with the cutoff frequency before and after the pulse maximum but dips to 12250 cm-1 during the main part of the pulse. The depth of the dip is determined by the spectral bandwidth of the pulse. The temporal tails to both sides of the main pulse peak lead to significant field amplitude that oscillates with the cutoff frequency, cf. black solid line in Fig. 4 a. During the main peak of the pulse, around , a dipole is induced by off-resonant excitation. It is at first driven by the strong electric field and follows its oscillation. After the main peak of the pulse is over, the coupling is reduced and the dipole oscillates with its intrinsic frequency close to the D1 resonance frequency, cf. red dashed line in Fig. 4 a. This is due to the excited state population being dominantly in vibrational levels close to the dissociation limit, cf. Section III. The oscillation of the excited state population goes through one period as the relative phase between dipole and field changes by 2, see the dotted blue lines and the red dashed curve in Fig. 4 c. The dotted blue lines indicate the times when the relative phase crosses odd integer multiples of . These times coincide with the minima in the oscillation of the excited state population. In the long pulse tail, this oscillation results from a beating between the transition dipole and the field that is oscillating with the cutoff frequency. As the long tail of the pump pulse decays (black solid line in Fig. 4 c), the oscillations of the transition dipole subside as well. This damps effectively the oscillations in the excited state population since the energy exchange between pulse and molecule vanishes.
The dynamics observed for a pulse to which two spectral cuts are applied, i.e. for excitation below the D2 resonance frequency (right-hand side of Fig. 4), is overall similar to that obtained for excitation below the D1 resonance frequency. However, two spectral cuts lead to a distinct beat pattern in the amplitude and phase of the electric field which carries over to the dynamical observables transition dipole and excited state population. The beat pattern is determined by the positions of the two cuts relative to the carrier frequency of the field. The induced dipole oscillates around the cut position before the main peak of the pulse. This oscillation is of little relevance, however, since the amplitude of the induced dipole which is related to the excited state population is extremely small. It dips down to 12725 cm-1 during the main peak of the pulse and oscillates with its intrinsic frequency close to the D2 resonance superimposed with the fast beat pattern after the main peak is over. While the beat patterns are easily resolved in the calculations where a time step of 1 fs was employed (the results shown in Fig. 4 are not convoluted with a Gaussian representing the effect of the probe pulse), they require a probe pulse with FWHM of 100 or less and a sufficiently good signal-to-noise ratio to be observed experimentally in e.g. the excited state population. In the experiment discussed here the comparatively long duration of the probe pulse does not allow for the observation of this beat pattern.
The coherent transients are solely due to electronic transitions as explained in detail below in Section V. Their dynamics can therefore also be modelled in the framework of dressed states of a two-level system. This approach has the advantage of yielding analytic expressions which describe the coherent interactions causing the dipole modulations Albert et al. (2008).
V Comparison of theoretical and experimental results
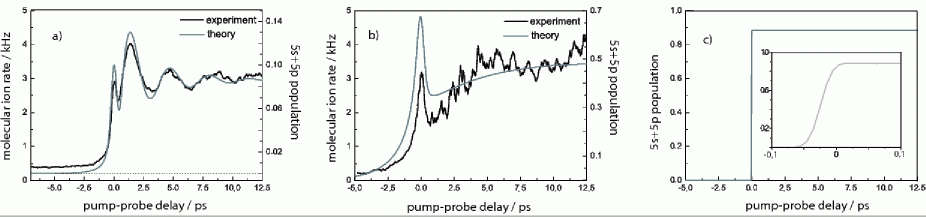
A detailed comparison of the quantum dynamical calculations to the experimental results is presented in the following. A typical pump-probe signal recorded in an experiment with excitation frequency near the D2 line is depicted by the black curves in Fig. 5, while the grey curves represent the excited state population obtained in the calculations after convolution with the probe pulse (cf. Sec. II). For a chosen cutoff position below the D2 resonance (here 10 cm-1), a constant molecular ion signal is measured at negative time delays where the probe pulse precedes the pump pulse, cf. Fig. 5a. For zero delay, the pump and probe pulses coincide in time and a peak of about 0.5 ps width is observed. For positive time delays where the pump pulse precedes the probe pulse, an increased molecular ion signal occurs with characteristic oscillations that are fully damped after a few picoseconds. An excellent agreement between the measured pump-probe data and the simulated excited state population in the attractive potentials of the is observed for positive delays. The finite offset of the experimental signal at negative delays is absent in the theoretical curve. The calculations are done for a single pump pulse, while the experiments operate with a high repetition rate, 100 kHz. The signal at negative delays is therefore attributed to molecules in the electronic ground state that were produced by the previous pump pulse and spontaneous emission Salzmann et al. (2008). This effect is not taken into account in the calculations.
When the atomic resonance is included in the pump pulse spectrum, Fig. 5b, the total pulse energy needs to be reduced by 50% with an optical gray filter to avoid a too strong perturbation of the ultracold cloud. In this case, a higher ion signal compared to that obtained with a cut to the red of the resonance frequency is observed for positive time delays. The characteristic oscillations at positive delay disappear almost completely, cf. Fig. 5b. When a transform-limited pulse is considered in the calculation, the population is quickly transferred to the excited state, and no oscillations are observed in Fig. 5c (the inset shows a zoom of 200 fs around zero delay). In the experiment, a transform-limited pulse led to a destruction of the sample. Fig. 5 illustrates that the transient oscillations depend strongly on the spectral cutoff of the pump pulse spectrum.
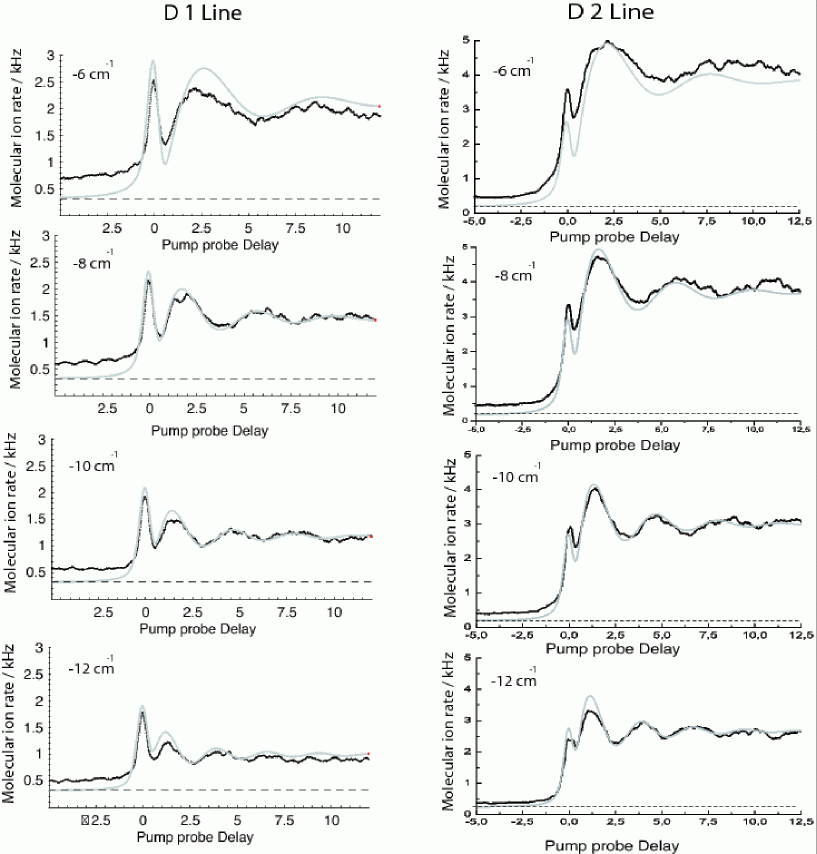
Fig. 6 shows the time-resolved molecular ion signal for different spectral cutoffs below the D1 and D2 line resonances in comparison with the corresponding quantum dynamical calculations. Generally, the pump-probe spectra obtained by exciting the ultracold ensemble near the D1 and D2 line resonances are very similar. A notable difference is observed in the Rb count rate which is larger for excitation near the D2 line and positive delays. This is attributed to the larger dipole moment for the transition. When the sample is irradiated by the probe pulse only, a constant level of molecules is detected. This signal is due to molecules that are produced by the trapping light. It is subtracted as background from each pump-probe spectrum.
In Fig. 6 the ’detuning’ of the spectral cut position with respect to the atomic resonance increases from top to bottom. A decreasing mean ion signal at positive time delays is observed for increasing cutoff position for excitation close to both the D1 and D2 line resonance. Moreover, the characteristic oscillations at positive time delay decrease in their period and amplitude as the cutoff position is moved further away from the resonance. The decrease in oscillation period is explained in terms of the instantaneous frequency of the pump pulse. A linear dependence of the oscillation frequency on the frequency of the cutoff position was recorded, cf. Fig. 2 of Ref. Salzmann et al. (2008). This is due to the laser field oscillating with an instantaneous frequency that corresponds to the cutoff position, cf. Sec. IV. The decrease in amplitude with increasing cutoff detuning is attributed to the most important frequencies being excluded from the pulse. Moreover, the pulse energy is reduced when more frequency components are removed from the pump pulse spectrum. Then the instantaneous intensity and hence the coupling between the field and and the molecular dipole become smaller.
One might expect nuclear dynamics of the excited state wavepacket to show up as oscillations in the molecular ion signal. However, the vibrational periods of the excited state levels that are populated, cf. Fig. 3, are at least one order of magnitude larger than the oscillation periods observed in Fig. 6. Moreover, one would expect to see wave packet revivals in the vibrational dynamics which have not been observed even when scanning the delay for very long times (up to 250 ps). In the calculations, vibrational dynamics should yield slightly different oscillation periods for the various potentials due to the different effective coefficients. However, identical oscillation periods were obtained for all potentials, independent of their character. All these observations clearly rule out molecular vibrational dynamics as origin of the observed oscillations and support their purely electronic character.
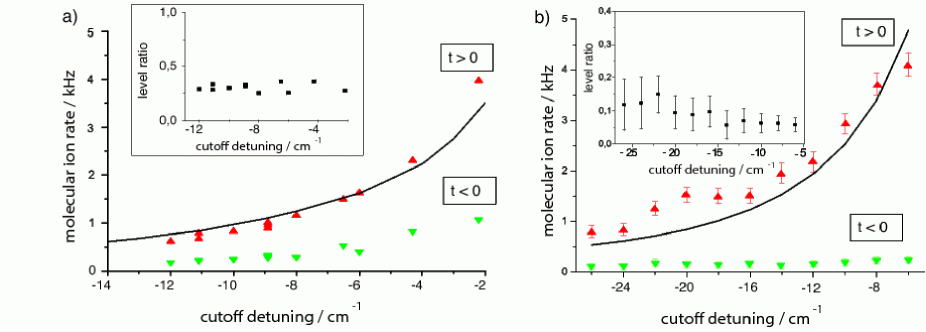
Fig. 7 displays the variation of the averaged asymptotic pump-probe signals with the cutoff position. Asymptotic refers to delay times for positive delay () where the oscillatory behavior is fully damped and to delay times before the signal rise for negative delay (). The measured data are shown as upward triangles for positive delay and as downward triangles for negative delay. The results of the calculation were scaled to match the experimental data and are represented by a grey line (positive delay only). The insets display the ratio of the asymptotic pump-probe signals at positive and negative delay versus the cutoff position. This ratio is obtained to be about 0.3 at the D1 line and about 0.1 at the D2 line. As discussed in detail in Ref. Salzmann et al. (2009), the nearly constant ratio indicates that the signal at negative delay, when the probe precedes the pump pulse is related to molecules that were photoassociated by a previous pump pulse and have undergone spontaneous decay to the electronic ground state. The experimental result for positive delay is well reproduced by the calculation. In particular, in accordance with the results of Fig. 6 an increase of the excited state population is observed as the cutoff position approaches the resonance frequency.
The influence of a linear frequency chirp on the pump-probe signals is discussed with the help of Fig. 8.
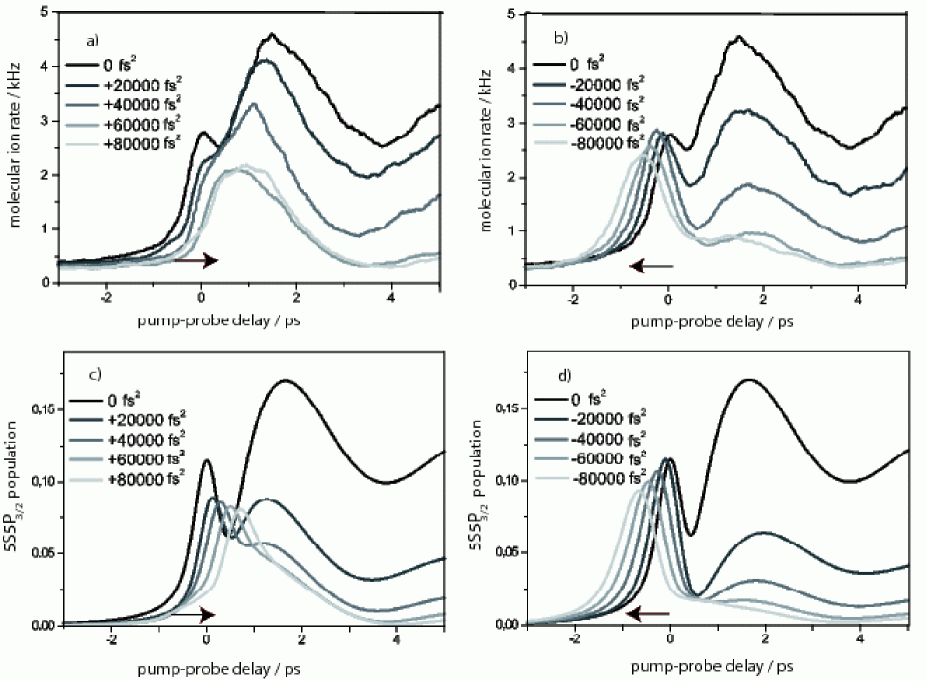
Measured (calculated) pump-probe spectra are shown for different positive chirps in Fig. 8a (c) and for negative chirps in Fig. 8b (d) for an excitation near the D2 line resonance and a cutoff position of 8 cm-1 below the resonance frequency. The spectral cutoff in combination with the applied quadratic phase shift causes strong distortions of amplitude and frequency behavior during the pulse compared to the transform-limited and spectrally cut, but unchirped pulses. A frequency chirp conserves the spectral bandwidth but prolongs the pulse. Since the pulse energy remains unchanged, the peak intensities are decreased. This leads to a reduction of the detected ion signal compared to an unchirped pump pulse for both negative and positive time delays, cf. the black and grey lines in Fig. 8. Coherent transients are present also in the pump-probe spectra for chirped pump pulses. The chirp does not change their period, but it induces a shift of the zero delay peak, as indicated by the arrows in Fig. 8. This behavior is well reproduced by quantum dynamical calculations. For a positive (negative) chirp, the larger instantaneous frequencies occur after (before) the smaller ones during the pulse. The larger instantaneous frequencies are more likely to cause the off-resonant excitation of population into the excited state than the smaller ones. This explains the shift of the zero delay peak toward later (earlier) times for positive (negative) chirps.
In previous calculations with chirped pulses, e.g. Vala et al. (2000); Luc-Koenig et al. (2004) an enhanced efficiency was proposed for chirped pulses. Here, an enhancement of the excited state population by using linearly chirped pump pulses was not observed. This is due to the off-resonant character of the excitation, cf. Sec. III. References Vala et al. (2000); Luc-Koenig et al. (2004) describe resonant excitation, i.e. only levels with free-bound transition frequencies within the spectrum of the pulse were addressed. Moreover, picosecond pulses were considered where some vibrational dynamics occurs during the pulse. The proposed enhancement then results from an interplay between the wavepacket rolling down the potential and the coupling with the field. This cannot be expected in our case. Note that such an interplay between nuclear and electronic dynamics has been recently observed for nanosecond pulses, demonstrating coherent control of ultracold collisions with frequency-chirped light Wright et al. (2007). In addition to reducing excitation efficiency, the linear chirps affect the dynamics of the induced dipole. This can be seen in the shift of the first peak relative to the oscillations indicated by the arrows in Fig. 8 for positive and negative chirps. As discussed above, the oscillations arise from the energy exchange between the induced dipole and the electric field of the pulse. They can therefore be expected to be very sensitive to phase manipulations of the pulse which also affect the relative phase between dipole and field.
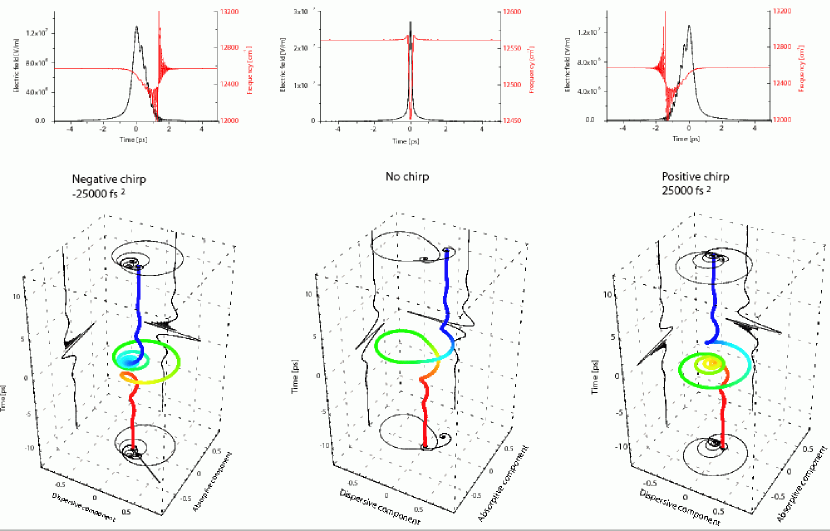
Since the molecular dynamics is reduced to the electronic dynamics, i.e. to that of a two-level system, the interaction between the molecule and the field can also be analyzed in terms of the evolution of the Bloch vector Albert et al. (2008). Fig. 9 shows the dispersive and absorptive components, and , of the Bloch vectors for chirped and unchirped pulses versus time 222The inversion component, , plotted vertically in the Bloch sphere, is small throughout the interaction.. For unchirped pulses, cf. middle graph in Fig. 9, the Bloch vector moves merely through a single loop in the plane during the main pulse peak. For chirped pulses the Bloch vectors perform rapid rotations in the plane during the main pulse peak as the instantaneous frequency of the pulse varies, cf. Fig. 4a. For negative (positive) chirps, cf. the left (right) graph of Fig. 9, the rapid rotations occur before (after) . As a result the final position of the Bloch vector in the plane is different for different sign of the chirp. The modulations on the absorptive component that are responsible for the energy exchange between molecule and field then oscillate with a phase offset compared to zero chirp.
VI Conclusions
We have presented theoretical calculations describing femtosecond pump-probe photoassociation experiments Salzmann et al. (2008, 2009). Two colliding rubidium atoms in their electronic ground state are excited by the pump pulse into bound levels and continuum states near the and asymptotes. They are ionized by a second, time-delayed probe pulse and detected by a mass spectrometer. The model considers only the pump pulse explicitly while accounting for the finite width of the probe pulse by convolution with a Gaussian. The pump pulse was modeled according to the experimental conditions. In particular, spectral cuts of amplitude and quadratic spectral phases were considered. Photoassociation is observed as excitation of the two atoms into weakly bound molecular levels, mostly very close to the dissociation limit. It is attributed mainly to off-resonant excitation. The spectral cutoff produces pulses in time with very long tails giving rise to transient oscillations of the ion signal, respectively excited state population. Coherent transients were analyzed in terms of the field-induced dipole and the relative phase between system and field. Pump pulses obtained for different cut positions and linear chirps were employed. The oscillation period of the coherent transients is directly related to the cutoff position. A negative (positive) chirp simply shifts the zero peak delay to shorter (larger) delay times. Calculations were performed for a number of different excited state potential energy curves correlating to both the and dissociation limits yielding, however, identical oscillation periods of the coherent transients. This indicates a purely electronic character of the observed oscillations. The analysis of the two-level dynamics was further confirmed by inspection of the system’s Bloch vector.
The experiments modelled in this paper have provided the first evidence for femtosecond photoassociation. The off-resonant excitation of molecular levels and the coherent transients both clearly demonstrate that the observed phenomena are beyond the sudden approximation. However, the molecules created by the femtosecond pump pulse are extremely weakly bound – they do not provide a suitable starting point for the application of a dump pulse in order to create ultracold molecules in their electronic ground state. In future experiments, the pulses should therefore be better adapted to the timescales of the problem. In particular, a bandwidth of a few wavenumbers should be best to create a spatially localized excited state wavepacket Luc-Koenig et al. (2004) that can subsequently be dumped to the electronic ground state Koch et al. (2006a, b).
Theoretical estimates predict a moderate photoassociation efficiency of about one molecule per pulse for a magneto-optical trap (MOT) Koch et al. (2006c). The efficiency is limited by the comparatively small pair density at the distances where photoassociation is effective. Future experiments on short-pulse photoassociation should therefore be combined with efforts to increase the pair density. Two routes can be pursued towards this goal. (i) The atoms can be cooled further to reach the quantum degenerate regime. Compared to the highest possible densities in a MOT, about three orders of magnitude can be gained this way. (ii) External fields can be employed to enhance the pair density at short and intermediate distances. For example, an increase in the photoassociation efficiency of up to five orders of magnitude is predicted for magnetic field control in Feshbach-optimized photoassociation Pellegrini et al. (2008). Pursuing one of these routes or a combination thereof, an efficiency of molecules per pulse or more is to be expected in photoassociation with picosecond pulses.
Acknowledgements.
This work was supported by the Deutsche Forschungsgemeinschaft in the framework of SFB 450, SPP 1116, and the Emmy Noether programme (RA and CPK).References
- Jones et al. (2006) K. M. Jones, E. Tiesinga, P. D. Lett, and P. S. Julienne, Rev. Mod. Phys. 78, 483 (2006).
- Masnou-Seeuws and Pillet (2001) F. Masnou-Seeuws and P. Pillet, Adv. in At., Mol. and Opt. Phys. 47, 53 (2001).
- Vardi et al. (1997) A. Vardi, D. Abrashkevich, E. Frishman, and M. Shapiro, J. Chem. Phys. 107, 6166 (1997).
- Vala et al. (2000) J. Vala, O. Dulieu, F. Masnou-Seeuws, P. Pillet, and R. Kosloff, Phys. Rev. A 63, 013412 (2000).
- Luc-Koenig et al. (2004) E. Luc-Koenig, R. Kosloff, F. Masnou-Seeuws, and M. Vatasescu, Phys. Rev. A 70, 033414 (2004).
- Koch et al. (2006a) C. P. Koch, E. Luc-Koenig, and F. Masnou-Seeuws, Phys. Rev. A 73, 033408 (2006a).
- Koch et al. (2006b) C. P. Koch, R. Kosloff, and F. Masnou-Seeuws, Phys. Rev. A 73, 043409 (2006b).
- Koch et al. (2006c) C. P. Koch, R. Kosloff, E. Luc-Koenig, F. Masnou-Seeuws, and A. Crubellier, J. Phys. B 39, S1017 (2006c).
- Shapiro et al. (2007) E. A. Shapiro, M. Shapiro, A. Pe’er, and J. Ye, Phys. Rev. A 75, 013405 (2007).
- Poschinger et al. (2006) U. Poschinger, W. Salzmann, R. Wester, M. Weidemüller, C. P. Koch, and R. Kosloff, J. Phys. B 39 (2006).
- Danzl et al. (2008) J. G. Danzl, E. Haller, M. Gustavsson, M. J. Mark, R. Hart, N. Bouloufa, O. Dulieu, H. Ritsch, and H.-C. Nägerl, Science 321, 1062 (2008).
- Ni et al. (2008) K.-K. Ni, S. Ospelkaus, M. H. G. de Miranda, A. Pe’er, B. Neyenhuis, J. J. Zirbel, S. Kotochigova, P. S. Julienne, D. S. Jin, and J. Ye, Science 322, 231 (2008).
- Deiglmayr et al. (2008) J. Deiglmayr, A. Grochola, M. Repp, K. Mörtlbauer, C. Glück, J. Lange, O. Dulieu, R. Wester, and M. Weidemüller, Phys. Rev. Lett. 101, 133004 (2008).
- Lang et al. (2008) F. Lang, K. Winkler, C. Strauss, R. Grimm, and J. H. Denschlag, Phys. Rev. Lett. 101, 133005 (2008).
- Koch et al. (2004) C. P. Koch, J. P. Palao, R. Kosloff, and F. Masnou-Seeuws, Phys. Rev. A 70, 013402 (2004).
- Pe’er et al. (2007) A. Pe’er, E. A. Shapiro, M. C. Stowe, M. Shapiro, and J. Ye, Phys. Rev. Lett. 98, 113004 (2007).
- Salzmann et al. (2006) W. Salzmann, U. Poschinger, R. Wester, M. Weidemüller, A. Merli, S. M. Weber, F. Sauer, M. Plewicki, F. Weise, A. Mirabal Esparza, et al., Phys. Rev. A 73, 023414 (2006).
- Dudovich et al. (2002) N. Dudovich, D. Oron, and Y. Silberberg, Phys. Rev. Lett. 88, 123004 (2002).
- Monmayrant et al. (2006) A. Monmayrant, B. Chatel, and B. Girard, Phys. Rev. Lett. 96, 103002 (pages 4) (2006).
- Salzmann et al. (2008) W. Salzmann, T. Mullins, J. Eng, M. Albert, R. Wester, M. Weidemüller, A. Merli, S. M. Weber, F. Sauer, M. Plewicki, et al., Phys. Rev. Lett. 100, 233003 (2008).
- Salzmann et al. (2009) W. Salzmann, T. Mullins, S. Götz, M. Albert, J. Eng, R. Wester, M. Weidemüller, A. Merli, S. M. Weber, F. Sauer, et al. (2009).
- Park et al. (2001) S. J. Park, S. W. Suh, Y. S. Lee, and G.-H. Jeung, Journal of Molecular Spectroscopy 207, 129 (2001).
- Marte et al. (2002) A. Marte, T. Volz, J. Schuster, S. Dürr, G. Rempe, E. G. M. van Kempen, and B. J. Verhaar, Phys. Rev. Lett. 89, 283202 (2002).
- Gutterres et al. (2002) R. Gutterres, C. Amiot, A. Fioretti, C. Gabbanini, M. Mazzoni, and O. Dulieu, Phys. Rev. A 66, 024502 (2002).
- Wang et al. (1997) H. Wang, P. L. Gould, and W. C. Stwalley, J. Chem. Phys. 106, 7899 (1997).
- Kokoouline et al. (1999) V. Kokoouline, O. Dulieu, R. Kosloff, and F. Masnou-Seeuws, J. Chem. Phys. 110, 9865 (1999).
- Willner et al. (2004) K. Willner, O. Dulieu, and F. Masnou-Seeuws, J. Chem. Phys. 120, 548 (2004).
- Kosloff (1988) R. Kosloff, J. Phys. Chem. 92, 2087 (1988).
- Shapiro and Brumer (2003) M. Shapiro and P. Brumer, Principles of the quantum control of molecular processes (Wiley Interscience, 2003).
- Albert et al. (2008) M. Albert, T. Mullins, S. Götz, W. Salzmann, R. Wester, and M. Weidemüller, J.Mod.Opt. 55, 3359 (2008).
- Wright et al. (2007) M. J. Wright, J. A. Pechkis, J. L. Carini, S. Kallush, R. Kosloff, and P. L. Gould, Phys. Rev. A 75, 051401 (2007).
- Pellegrini et al. (2008) P. Pellegrini, M. Gacesa, and R. Côté, Phys. Rev. Lett. 101, 053201 (2008).