The evolution of the mass-metallicity relation in SDSS galaxies uncovered by astropaleontology
Abstract
We have obtained the mass-metallicity (–) relation at different lookback times for the same set of galaxies from the Sloan Digital Sky Survey, using the stellar metallicities estimated with our spectral synthesis code starlight. We have found that this relation steepens and spans a wider range in both mass and metallicity at higher redshifts. We have modeled the time evolution of stellar metallicity with a closed-box chemical evolution model, for galaxies of different types and masses. Our results suggest that the – relation for galaxies with present-day stellar masses down to is mainly driven by the history of star formation history and not by inflows or outflows.
keywords:
galaxies: evolution – galaxies: statistics – galaxies: stellar content.1 Introduction
Since the study by Lequeux et al. (1979), who found a luminosity-metallicity relation for irregular galaxies, many papers have reported the existence of a luminosity-metallicity or mass-metallicity (–) relation for all kinds of galaxies: The more massive galaxies are also the ones with more metal-rich interstellar medium (ISM).
Considerable work has also been devoted to explaining the – relation. For instance, Tremonti et al. (2004) find that outflows play an important role in shaping the – relation, as the weaker gravitation potential well of less massive galaxies makes them more prone to lose enriched gas via galactic winds or supernovae explosions. Finlator & Davé (2008) claim that inflows of pristine gas could also be a sound explanation, as the same amount of gas falling into galaxies would have a greater impact on the chemical composition of less massive ones. Köppen et al. (2007) advocate the role of an integrated initial mass function: Massive galaxies comprise more massive clusters which may contain more massive stars that enrich the ISM faster.
The – relation derived from emission lines has been found to change with redshift (Savaglio et al., 2005; Maiolino et al., 2008). The comparison between – at low and high redshifts is, however, not straightforward. Different populations of galaxies live at different redshifts, and this alone can affect the derivation of the nebular metallicity, even if one were to apply the same calibrations for both samples (see Stasińska, 2008). Nevertheless, at least qualitatively, the observed results are in agreement with what is expected for the evolution of galaxies.
This brings us to another concern in – studies: the bias in the derivation of the nebular metallicity from emission lines. The evolution of the mass-metallicity relation is usually studied in terms of the abundance of oxygen in the ISM gas. As known (see e.g. Kewley & Ellison, 2008), the measurement of nebular abundances is very dependent on the method and calibrations used.
With our stellar population synthesis code starlight, we can determine the stellar metallicities, , and the total masses in stars, , at different epochs for any given galaxy (Cid Fernandes et al., 2007). We can thus follow the evolution of the – relation for the same set of galaxies at different redshifts. Panter et al. (2008) used similar techniques and discussed the nebular metallicities with respect to stellar metallicities. In this study, we rely on stellar metallicities alone because, although they have their own problems, they are free from the biases affecting nebular abundance determinations. The use of also allows us to explore more massive galaxies, for which the nebular metallicity estimates are not possible, such as AGN hosts and galaxies which have stopped forming stars.
Since starlight allows the determination of the star formation histories (SFHs), we can go one step further and construct a simple chemical evolution model using these SFHs and see under what conditions it reproduces the observed time evolution of . Savaglio et al. (2005) made a similar study, but using a theoretical SFH with e-folding time, related to galaxy mass, and for nebular metallicity instead of . Here we use the SFH obtained directly for each galaxy.
2 Data

Our parent sample is composed of all objects spectroscopically classified as galaxies from 5th Data Release of the Sloan Digital Sky Survey (SDSS)(Adelman-McCarthy et al., 2007). We exclude duplicate observations, and impose the following selection criteria: (from the Main Galaxy Sample definition), -band aperture covering factor (to reduce aperture effects and avoid intragalactic sources), at 4750 Å (to provide reasonable stellar population fits), and a narrow range in redshift (to be able to transform stellar ages into redshift in a simple way). The central redshift of 0.1 was chosen to maximize the number of objects and thus ensure reliable statistics over the whole range of ages considered in the analysis. We adopt a , and cosmology where appropriate. There are 82662 objects in the resulting sample.
We use the same data processing as outlined in Cid Fernandes et al. (2005) and Mateus et al. (2006). Our code starlight recovers the stellar population content of a galaxy by fitting a pixel-by-pixel model to the spectral continuum. This model is a linear combination of 150 simple stellar populations (SSP) extracted from Bruzual & Charlot (2003, hereafter BC03) with ages 1 Myr 18 Gyr, and metallicities , as in Cid Fernandes et al. (2007). Emission lines are then measured in the residual spectra, which reduces the contamination by stellar absorption features.
We divide our parent sample into three sub-samples: star-forming (SF), retired (R) and Seyfert (S) galaxies. For both the SF and S samples, we select objects with in the [O iii]5007, H, [N ii]6584 and H emission lines, i.e., all the lines involved in the Baldwin, Phillips, & Terlevich (1981, BPT) diagram. The SF sample is composed by the objects below the line proposed by Stasińska et al. (2006) to separate SF galaxies from AGN hosts. The Seyfert sample is defined as the galaxies with and above the line defined by Schlickmann (2008) in the BPT diagram to separate Seyferts from LINER-like galaxies: .
The R sample is composed of galaxies with little evidence of either nuclear or star-forming activity, which includes passive galaxies, galaxies with very weak emission lines and even some which would be traditionally classified as LINERs (see Stasińska et al., 2008). Therefore, we impose the following cuts for the R sample: in the 4 BPT lines and [O ii]3727 (“passive”); or in [O iii] and/or H, but in [N ii] and H, and (“weak emission lines”); or in the 4 BPT lines, , below the line defined by Schlickmann (2008), and H emission predicted by old stellar populations equal or greater than the observed value (“retired mimicking LINERs”)
We have also divided our sample and sub-samples into six present-day stellar mass bins centered in (A), 10.3 (B), 10.6 (C), 10.9 (D), 11.2 (E) and 11.5 (F), each one 0.30 dex wide. In the same vein as our previous works (Cid Fernandes et al., 2007; Asari et al., 2007), defining bins allows us to alleviate the problem of the mass completeness of the sample. We consider narrow mass bins in order to have very similar galaxies inside each bin. Although the starting sample contained a small proportion of galaxies with masses smaller than , we do not consider them in the current analysis. Indeed, due to the redshift cut we imposed, only the most luminous low-mass objects are present and they are not representative of the bulk of galaxies of their mass range.
3 Galaxy histories in mass bins
As explained in Cid Fernandes et al. (2007), starlight recovers the fraction that each SSP contributes to the total light of a galaxy in the spectral range covered by the SDSS. We can translate into the mass fraction presently locked into stars, , or the fraction of mass ever converted into stars, .
The stellar mass history can be followed as a function of lookback time by summing up the converted-mass fractions:
| (1) |
The mean stellar metallicity at a lookback time is defined as the total mass in metals locked in stars divided by the total stellar mass at a given time:
| (2) |
Another way to look at the metallicity evolution would be to consider the average metallicity of all the stars born at the same epoch, for each value of . This, however, is a much less robust quantity, and we found that SSP bases at hand nowadays do not allow such detailed definition.
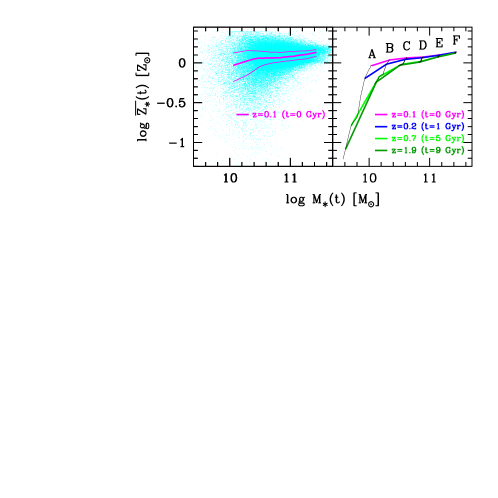
Figure 1 shows the median values of and versus for mass bins A–F of our sample. As previous studies have already shown (e.g. Cid Fernandes et al., 2007; Panter et al., 2008, for SF galaxies only – here we extend the study for all galaxies), there is a clear downsizing effect: The less massive galaxies are slower in converting their mass into stars and in building up their metal content.
4 The observed – evolution
Figure 2 shows the mass-metallicity relation. The left panel shows the present-day – relation for all the galaxies in our sample. The right panel depicts the evolution of the – relation for the galaxies in mass bins A–F (black lines): vs. , where is the stellar mass integrated from the epoch of galaxy formation until a lookback time , assuming that the stars always pertain to the galaxies where they were born. The resulting – relations for different redshifts are plotted in bold lines. One can see that the mass-metallicity relation evolves.
As lookback time increases, the – relation steepens and covers a larger range of values. As investigated by Panter et al. (2008), using stellar modelling codes other than that of BC03 changes the values of and , but the general behaviour seen in the present paper as well as in Panter et al. (2008) remains. One should note that the – relation and evolution is significantly sample-dependent, which makes difficult any quantitative comparison between works by different authors.
5 A simple chemical evolution model
We now investigate the behaviour of the – relations shown in Fig. 2 with the help of a simple model of chemical evolution of galaxies. We assume a closed box with initial metallicity equal to zero, and use an instantaneous recycling approximation and a constant yield. The mass-weighted average mass fraction of metals at lookback time is then given by (Edmunds, 1990, eq. 35):
| (3) |
where is the gas mass fraction and is the ratio of the mass of metals released per stellar generation to the total stellar mass locked in remnants. The gas mass fraction is given by:
| (4) |
where is the total mass of the galaxy (stars and gas), SFR is the star formation rate, is the returned mass fraction due to stellar winds and supernovae and is the age of the oldest SSP in the base. The star formation rate SFR can be obtained from the results of the starlight synthesis:
| (5) |
| (6) |
where is the present-day gas mass fraction. Knowing the value of , one can use Eqs. 3 and 6 with given by starlight to find what value of is needed to reproduce the observed evolution of the mean stellar metallicity .
Unfortunately, is not well known. The measured stellar metallicities are mainly sensitive to the abundance of iron, and the Fe/O ratio is expected to vary with time. For our simple approach, we assume that all the metals vary in lockstep and simply speak of the “metal yield”. We determine an empirical value of by applying our model to the highest mass bin of the SF sample, using the Schmidt-Kennicutt law (Kennicutt, 1998)111We use the Schmidt-Kennicutt law for normal disk galaxies (bivariate least-squares regression in fig. 2 of Kennicutt, 1998) for a Chabrier (2003) initial mass function, and including the contribution of helium in the gas mass fraction. to derive the value of from the extinction-corrected H luminosity. This procedure should give a reasonable value of the metal yield, since it is for the highest mass bin that the closed box model is expected to be the most relevant. We obtain . This value is in satisfactory agreement with the value () obtained for a Chabrier (2003) stellar initial mass function by multiplying the oxygen yield from Woosley & Weaver (1995) by the Solar metal-to-oxygen mass fraction.
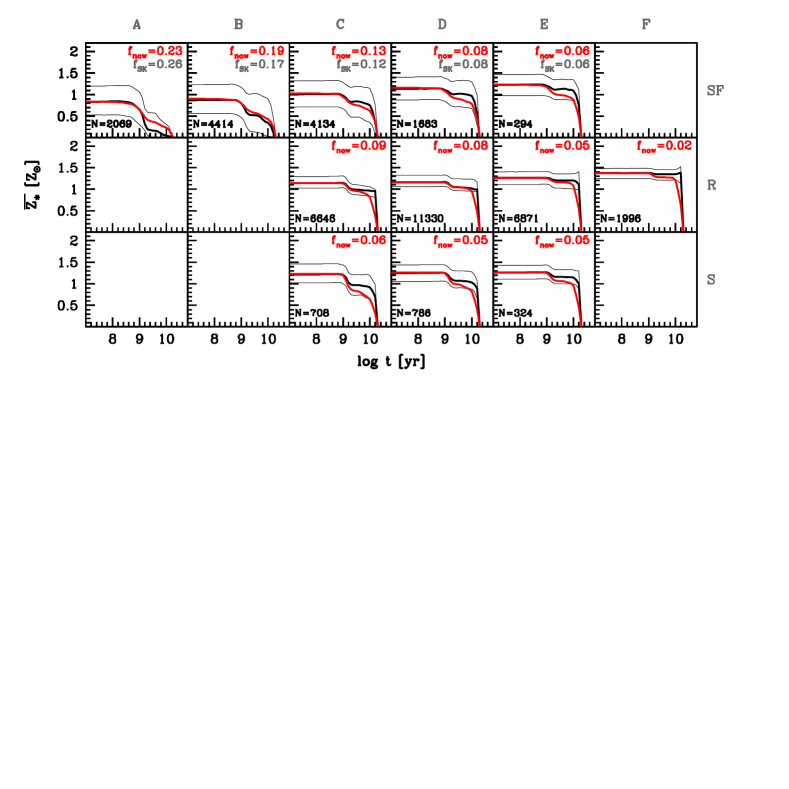
We therefore adopt and apply our model to try to reproduce the observed metallicity evolution for all the mass bins. Figure 3 shows as a function of for bins A–F of our SF, R and S galaxy samples. The black lines represent the median and quartiles of the observed distributions. The red lines are the model results for the values of indicated at the top of each panel. The models were adjusted by eye to reproduce well at least the last 1 Gyr of the observed . For the SF sample, we also indicate the median value of obtained from the Schmidt-Kennicutt law. This figure shows that this simple model can reproduce the observed metallicity evolution reasonably well, given the crudeness of our approach. The discrepancies for ages above yr are at least partly due to the known problems faced by spectral synthesis in this range (Gomes, 2005; Koleva et al., 2008). In particular, the jumps in both and at Gyr are artifacts related to the spectral libraries used in BC03 (Cid Fernandes et al., 2008). New evolutionary synthesis models with more accurate stellar spectra should improve the recovery of SFHs in this range.
It is worth of noting that is at least qualitatively in agreement with expectations: it is larger for SF galaxies than for retired galaxies, and decreases with increasing . As a matter of fact, for all the mass bins of the SF sample is compatible with the values derived from the Schmidt-Kennicutt law (bin E is compatible by construction). Seyferts also shows little residual gas mass. The chemical evolution of Seyferts is (within our resolution) similar to the evolution of non-Seyfert galaxies.
To sum up, for present-day stellar masses down to and within the current limitations of astropaleontology, the closed box model explains the present-day – relation and its evolution quite well if one uses the SFR obtained directly from the spectral synthesis of each galaxy. This is not to say that infall or outflow do not play a role. What we want to stress is that it is the star formation history which is the main driver of the mass-metallicity relation and its evolution.
6 Summary and discussion
Until recently, the – relation in galaxies had been mostly studied using abundances derived from emission lines. Exploiting the stellar metallicities obtained with our spectral synthesis code starlight, we have obtained the – relation at different lookback times for the same set of galaxies. The use of stellar metallicities, even if those are not very accurate, has several merits. It allows one to probe metallicities at different epochs of a galaxy evolution. It makes it possible to study galaxies in a larger mass range. Galaxies without emission lines or galaxies with an active nucleus do not have to be discarded. Finally, with stellar metallicities, one avoids the biases that affect the statistical methods used to derive metallicities from emission lines.
Our main results are the following. We have found that the – relation steepens and spans a wider range in both mass and metallicity at higher redshifts. The more massive galaxies show very little evolution since a lookback time of 9 Gyr. This means that they evolved very fast in a distant past, supporting the downsizing scenario. This is in agreement with other studies of the build-up of metals in SDSS galaxies as revealed by fossil records, e.g., Cid Fernandes et al. (2007) and Panter et al. (2008).
We have modeled the observed time evolution of the mean stellar metallicity using a closed-box, instantaneous recycling chemical evolution model, for galaxies of different types and masses. We find that this model is compatible with the observations. This suggests that, in the mass range studied here (from to 11.65), the – relation is mainly driven by the history of star formation and not by inflows or outflows. By comparing the nebular and stellar metallicities of SDSS galaxies, Gallazzi et al. (2005) had argued that galaxies are not well approximated by closed-box models and that winds may be important. Our study suggests that those processes are not dominant, although they may play a role in the scatter of the – relation in our mass range.
Low-mass galaxies are not present in our sample because of our selection in redshift. They would require a dedicated study to be compared to the result found by Tremonti et al. (2004) and Garnett (2002) that such galaxies do suffer strong outflows. As a matter of fact, Garnett finds that outflows are important for galaxies with -band magnitude . Only 6 out of the 82662 objects in our sample have -band magnitude . Using the Schmidt-Kennicutt law to compute the effective yields for each galaxy (i.e., the yield calculated from the observed nebular metallicities assuming a closed box model), Tremonti et al. (2004) concluded that galactic winds are ubiquitous and very effective in removing metals from galaxies. This however concerns only galaxies with masses up to , which are not present in our sample. Our work emphasizes that there is a large range of galaxy masses – almost two decades – where the closed box model seems to give a valid representation of the chemical evolution of galaxies.
Our models are parametrized by the present-day gas mass fraction, . We have found that the values of that allow us to reproduce the observed histories are larger for less massive galaxies, in agreement with expectations. For galaxies of similar masses, they are larger for star-forming galaxies than for retired galaxies. The values of we find for SF galaxies are compatible with those obtained from the Schmidt-Kennicutt law. This sound result supports the validity of our interpretation.
Within our uncertainties, Seyfert galaxies have as little gas as retired galaxies.
ACKNOWLEDGMENTS
The starlight project is supported by the Brazilian agencies CNPq, CAPES, FAPESP, by the France-Brazil CAPES-COFECUB program, and by Observatoire de Paris. We thank Laerte Sodré, Cristina Chiappini and Nikos Prantzos for their helpful comments on the manuscript. We are also grateful to the referee for interesting suggestions.
The Sloan Digital Sky Survey is a joint project of The University of Chicago, Fermilab, the Institute for Advanced Study, the Japan Participation Group, the Johns Hopkins University, the Los Alamos National Laboratory, the Max-Planck-Institute for Astronomy, the Max-Planck-Institute for Astrophysics, New Mexico State University, Princeton University, the United States Naval Observatory, and the University of Washington. Funding for the project has been provided by the Alfred P. Sloan Foundation, the Participating Institutions, the National Aeronautics and Space Administration, the National Science Foundation, the U.S. Department of Energy, the Japanese Monbukagakusho, and the Max Planck Society.
References
- Adelman-McCarthy et al. (2007) Adelman-McCarthy et al., 2007, ApJS, 172, 634
- Asari et al. (2007) Asari N. V., Cid Fernandes R., Stasińska G., Torres-Papaqui J. P., Mateus A., Sodré L., Schoenell W., Gomes J. M., 2007, MNRAS, 381, 263
- Baldwin et al. (1981) Baldwin J. A., Phillips M. M., Terlevich R., 1981, PASP, 93, 5
- Bruzual & Charlot (2003) Bruzual G., Charlot S., 2003, MNRAS, 344, 1000
- Chabrier (2003) Chabrier G., 2003, PASP, 115, 763
- Cid Fernandes et al. (2007) Cid Fernandes R., Asari N. V., Sodré L., Stasińska G., Mateus A., Torres-Papaqui J. P., Schoenell W., 2007, MNRAS, 375, L16
- Cid Fernandes et al. (2005) Cid Fernandes R., Mateus A., Sodré L., Stasińska G., Gomes J. M., 2005, MNRAS, 358, 363
- Cid Fernandes et al. (2008) Cid Fernandes R., Schoenell W., Gomes J. M., Asari N., Schlickmann M., Mateus A., Stasinska G., Sodre L., Torres-Papaqui J. P., for the SEAGal collaboration, 2008, ArXiv e-prints
- Edmunds (1990) Edmunds M. G., 1990, MNRAS, 246, 678
- Finlator & Davé (2008) Finlator K., Davé R., 2008, MNRAS, 385, 2181
- Gallazzi et al. (2005) Gallazzi A., Charlot S., Brinchmann J., White S. D. M., Tremonti C. A., 2005, MNRAS, 362, 41
- Garnett (2002) Garnett D. R., 2002, ApJ, 581, 1019
- Gomes (2005) Gomes J. M., 2005, MSc Thesis, Universidade Federal de Santa Catarina
- Kennicutt (1998) Kennicutt Jr. R. C., 1998, ApJ, 498, 541
- Kewley & Ellison (2008) Kewley L. J., Ellison S. L., 2008, ApJ, 681, 1183
- Koleva et al. (2008) Koleva M., Prugniel P., Ocvirk P., Le Borgne D., Soubiran C., 2008, MNRAS, 385, 1998
- Köppen et al. (2007) Köppen J., Weidner C., Kroupa P., 2007, MNRAS, 375, 673
- Lequeux et al. (1979) Lequeux J., Peimbert M., Rayo J. F., Serrano A., Torres-Peimbert S., 1979, A&A, 80, 155
- Maiolino et al. (2008) Maiolino et al., 2008, A&A, 488, 463
- Mateus et al. (2006) Mateus A., Sodré L., Cid Fernandes R., Stasińska G., Schoenell W., Gomes J. M., 2006, MNRAS, 370, 721
- Panter et al. (2008) Panter B., Jimenez R., Heavens A. F., Charlot S., 2008, MNRAS, 391, 1117
- Savaglio et al. (2005) Savaglio et al., 2005, ApJ, 635, 260
- Schlickmann (2008) Schlickmann M., 2008, MSc Thesis, Universidade Federal de Santa Catarina
- Stasińska (2008) Stasińska G., 2008, in IAU Symposium, Vol. 255, IAU Symposium, pp. 375–380
- Stasińska et al. (2006) Stasińska G., Cid Fernandes R., Mateus A., Sodré L., Asari N. V., 2006, MNRAS, 371, 972
- Stasińska et al. (2008) Stasińska G., Vale Asari N., Cid Fernandes R., Gomes J. M., Schlickmann M., Mateus A., Schoenell W., Sodré Jr. L., 2008, MNRAS, 391, L29
- Tremonti et al. (2004) Tremonti et al., 2004, ApJ, 613, 898
- Woosley & Weaver (1995) Woosley S. E., Weaver T. A., 1995, ApJS, 101, 181