Degree distributions in mesoscopic and macroscopic functional brain networks
Abstract
We investigated the degree distribution of brain networks extracted from functional magnetic resonance imaging of the human brain. In particular, the distributions are compared between macroscopic brain networks using region-based nodes and mesoscopic brain networks using voxel-based nodes. We found that the distribution from these networks follow the same family of distributions and represent a continuum of exponentially truncated power law distributions.
pacs:
87.19.If, 02.10.Ox, 87.18.Sn, 89.75.DaSmall-world networks are a class of networks characterized by highly interconnected neighborhoods and efficient long-distance connections, connecting any two nodes in a network with just a few intermediary connections Watts and Strogatz (1998). Since the introduction of small-world networks, these small-world properties have been observed in many social, technological, and biological networks Strogatz (2001). The network organization of the human brain has also been demonstrated as a small-world network Stam and Reijneveld (2007); Bullmore and Sporns (2009); small-world properties have been verified in both anatomical Gong et al. (2009); He et al. (2007); Hagmann et al. (2008); Iturria-Medina et al. (2008) and functional Achard et al. (2006); Bassett et al. (2006); Cecchi et al. (2007); Eguiluz et al. (2005); van den Heuvel et al. (2008); Stam (2004) brain networks. A small-world structure is advantageous for brain networks since it can support both localized processes specific to different brain regions as well as distributed processes encompassing multiple brain regions at once. Some studies have also reported that functional brain networks are scale-free networks Cecchi et al. (2007); Eguiluz et al. (2005); van den Heuvel et al. (2008), networks characterized by mega-hubs with extremely large node degrees and by the degree distribution following a power law distribution Barabasi and Albert (1999).
Interestingly, scale-free properties have been observed in brain networks using voxels (3D pixels in 3D brain images) as network nodes Cecchi et al. (2007); Eguiluz et al. (2005); van den Heuvel et al. (2008), but not in brain networks modeled using anatomical regions as nodes Achard et al. (2006); Bassett et al. (2006); Gong et al. (2009); He et al. (2007); Iturria-Medina et al. (2008). The distribution from a region-based network is not truly scale-free but follows an exponentially truncated power law distribution Achard et al. (2006); Gong et al. (2009); He et al. (2007). This discrepancy is rather surprising since both types of networks describe the same biological system, the human brain. Although the reason for the difference is unclear, it may be due to differences in data processing steps in constructing the brain network Bullmore and Sporns (2009). Another possible reason for the discrepancy is the difference in the scale of these networks; while voxel-based networks represent a finer mesoscopic organization of the brain, region-based networks represent a coarser macroscopic organization of the brain. Thus, to examine the effects of data processing and the network scale on the node degree distribution, we constructed region-based and voxel-based networks based on the same functional MRI (fMRI) data. We compared the degree distribution from both types of networks describing the organization of the same set of brains.
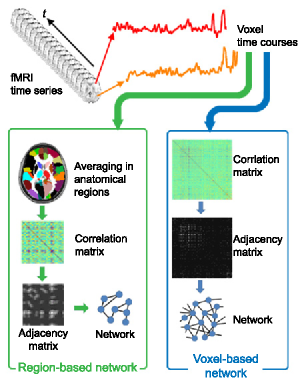
The data set for this study consisted of fMRI experiment data from 5 subjects. For each subject, a series of MRI images measuring neurological activities were acquired every 2.5 sec. for 5 minutes, resulting in 120 images, each with voxels of size mm. FIG 1 displays the schematic of the data processing steps. To construct a voxel-based network, each of 20,000 brain voxels was treated as a node. For a region-based network, the voxel time courses were averaged for voxels within each anatomical region, resulting in time courses corresponding to approximately 100 nodes of anatomical regions. In both networks, the correlation coefficient was calculated between the time courses of two nodes, producing a correlation matrix. If the correlation coefficient exceeded a correlation threshold , these nodes were considered to be functionally connected. By applying a threshold to the correlation matrix, a binary matrix was formed, known as an adjacency matrix, with 1 indicating existence of an edge connecting two nodes and 0 otherwise. To facilitate a comparison of degree distributions across subjects, was adjusted for each subject so that the average node degree for the network was similar across subjects. The average degree was (SD) for the voxel-based networks and for the region-based networks.
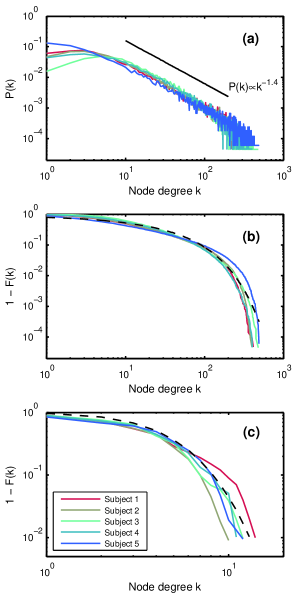
FIG 2 show the degree distributions resulting from the voxel-based and region-based networks. FIG 2(a) shows the degree distributions of the voxel-based networks plotted on a log–log scale. For all the subjects, the degree distribution seems to follow a straight line as seen in other voxel-based networks Cecchi et al. (2007); Eguiluz et al. (2005); van den Heuvel et al. (2008), indicative of a power law distribution with . However, the tail of the distributions exhibit increased uncertainty, giving an appearance of a fuzzy tail. To understand the distribution profile better Keller (2005), we calculated the cumulative distribution and plotted the complementary cumulative distribution on a log–log scale in FIG 2(b). If the distribution were truly a power law distribution, then the plot of would also follow a straight line Keller (2005). Instead, the distributions decay faster than a power law distribution, and follow an exponentially truncated power law distribution with and (dashed curve, FIG 2(b)).
FIG 2(c) shows the log-log plots of from the region-based networks. The distributions are curved, showing an accelerated decay for higher . These distributions follow a gamma distribution , which is another parameterization of an exponentially truncated power law distribution with the exponent instead of . As a reference, FIG 2(c) also shows the best-fit gamma distribution, with and (dashed curve). These parameters are within a similar range as other region-based functional and anatomical brain networks Achard et al. (2006); Bassett et al. (2006); Gong et al. (2009); He et al. (2007); Iturria-Medina et al. (2008).
The results from both types of networks demonstrate that the degree distribution follows an exponentially truncated power law distribution. This is not surprising since both networks are modeling functional connectivities of the same brains, although scales are different. As a comparison, we also fitted other distributions, namely a power law distribution and an exponential distribution , but neither approximated the distribution better than an exponentially truncated power law distribution. It is interesting that the degree distributions from voxel-based networks appear to follow a power law distribution as previously reported by other studies. However, the plots of the cumulative distributions indicate otherwise. Therefore the scale-free properties seen in other voxel-based networks Cecchi et al. (2007); Eguiluz et al. (2005); van den Heuvel et al. (2008) may simply be an artifact of data display. Since there are very few nodes with high , the empirical estimation of based on a histogram is very unstable as noted by Keller Keller (2005), and a straight line can be erroneously fitted to other distributions Li et al. (2005).
Interestingly, the characteristics of the exponentially truncated power law distribution are different between the region-based and voxel-based networks. In particular, in a voxel-based network, the degree distribution has a form with , whereas in a region-based network, . In a voxel-based network, decreases as increases, and the decay is further accelerated by the exponential truncation . On the other hand, in a region-based network, increases as increases, but this increase is attenuated and eventually overcome for by the exponential truncaton . If , then the distribution is an exponential distribution characterized by a single cut-off parameter .
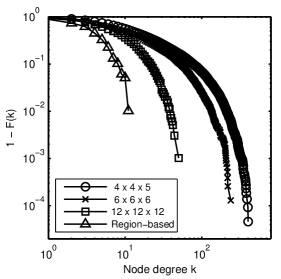
Since the sign of the exponent is the only distinction between the degree distributions of the two types of networks, it is plausible that the degree distribution of a brain network is from a continuum of exponentially truncated power law distributions, with dependent on the scale at which the network is formed. To verify this, the voxel-based data for one of the subjects were down-sampled to larger voxel sizes (mm and mm) and the corresponding voxel-based networks were formed at these coarser resolutions. FIG 3 shows the degree distributions for voxel-based networks at different voxel resolutions, as well as that of the region-based network. They all follow exponentially truncated power law distributions. Table 1 shows the parameter estimates of and of at different network scales, as well as the number of nodes and the average node degree. As the network resolution increases from a coarse macroscopic representation of the region-based network to a finer mesoscopic representation of the voxel-based network, the exponent decreases from positive to negative. The cut–off parameter on the other hand increases as the number of nodes increases in finer representations of the network. Our finding with the mm scale network is consistent with a previous study of region-based networks with 1,000 nodes demonstrating a clear characteristic of positive in the distribution (see Figure S1 of Hagmann et al. (2008)).
| Network | |||||
|---|---|---|---|---|---|
| Voxel-based network | |||||
| mm voxel | 21585 | 29.4 | 63.3 | ||
| mm voxel | 7727 | 20.1 | 37.4 | ||
| mm voxel | 980 | 9.97 | 0.42 | 7.01 | |
| Region-based network | 98 | 4.49 | 1.93 | 1.54 | |
Our results above indicate that the scale at which the network is formed is important. The higher the resolution, the smaller becomes, resembling more closely a power law distribution . This means that the network resembles scale-free networks more as its scale becomes finer. This may be because connections and edges that are represented by a single edge or a single node in a coarse network can be represented with multiple edges and nodes in a finer network. A single low degree node of a coarse network may be represented by distinct low degree nodes in a finer network. Similarly, the edges at a hub in a coarse network may be resolved as collections of edges in a finer network, increasing the degree at the hub dramatically. A large number of low degree nodes and a very small number of extremely high degree hubs are characteristics of scale-free networks Barabasi and Albert (1999). It is important to note that in an exponentially truncated power law distribution does not become smaller than as in a power law distribution of a true scale-free network , . However, it is possible to approximate a power law distribution by modeling the distribution with two curves: for and for Grove et al. (1998); Mossa et al. (2002). In such a parameterization, the tail above the cut-off parameter is modeled as an exponentially truncated power law distribution showing accelerated decay, but the distribution of the vast majority of nodes, nodes with degree , is modeled by a power law distribution.
It is interesting to note that exponentially truncated power law distributions have been observed not only in the brain network but also other types of networks, including ecological Lusseau and Newman (2004), social Newman (2001); Amaral et al. (2000), and technological Amaral et al. (2000); Mossa et al. (2002) networks. Such networks may occur due to limitations in processing capability of nodes or restrictions in network growth. Mossa et al. Mossa et al. (2002) generated networks with information filtering, or a limitation on nodes’ information processing capability, and observed a truncation in the node degree distribution. Similarly, Amaral et al. Amaral et al. (2000) speculated that the cost of additional connections to a node functioning near its capacity may limit the occurrence of mega-hubs commonly seen in a scale-free network. A scale-free network can be formed as a result of a process known as preferential attachments Barabasi and Albert (1999), in which a new node introduced to a network preferentially attaches itself to a high-degree node, resulting a very small number of mega hubs. However this preferential attachment process may be realistic only when the network growth is unrestricted. Such a condition is not feasible for the brain network since there are physiological, anatomical, and functional constraints. However, there may be some advantages for the brain network not being scale-free. A scale-free network is an ideal structure for efficiently transmitting information to the entire network, but this also means unnecessary or unwanted information can be spread throughout the network very easily. Such an uncontrollable spread has been observed in epidemiological networks in which a disease spreads to the entire network without any threshold for epidemics Pastor-Satorras and Vespignani (2001); Boguna et al. (2003). On the other hand, an exponentially truncated power law network is resistant against such massive epidemics, with a non-zero threshold for an epidemic Mossa et al. (2002). In the context of the brain network, a scale-free structure could cause extensive synchronization often seen in epilepsy patients, while an exponentially truncated network may prevent such over synchronization. This may also allow localized processing in a certain module of the brain without involving the entire brain network unless the demand of a cognitive process exceeds a certain threshold.
In summary, degree distributions of macroscopic and mesoscopic functional brain networks were examined, through constructing region-based and voxel-based networks, respectively, on the same subjects. It was found that the degree distributions of both networks follow exponentially truncated power law distributions, and not power law distributions as previously reported on voxel-based networks. The discrepancy in the literature is likely due to the fact that prior studies of voxel-based networks plotted the degree distributions whereas all region-based network analyses plotted the cumulative distribution . Due to sensitivity to noise in the extreme tail of the degree distribution, the cumulative distribution plots are preferred. It was also found that the distributions of region-based and voxel-based networks belong to the same continuum of exponentially truncated networks, and finer scales of the network result in networks more similar to scale-free networks. The results from this study suggest the importance of modeling the brain network at resolutions as fine as data would allow.
This work was supported by the Translational Scholar Award to S. H from the Translational Science Institute of Wake Forest University. Data collection for this work was supported by the National Institute of Health (NS042658), as well as the Roena Kulynych Memory and Cognition Research Center and the General Clinical Research Center (RR07122) of Wake Forest University. We would like to thank Drs. Ann Peiffer and Christina Hugenschmidt for collecting the data.
References
- Watts and Strogatz (1998) D. J. Watts and S. H. Strogatz, Nature (London) 393, 440 (1998).
- Strogatz (2001) S. H. Strogatz, Nature (London) 410, 268 (2001).
- Stam and Reijneveld (2007) C. J. Stam and J. C. Reijneveld, Nonlinear Biomedical Physics 1, 3 (2007).
- Bullmore and Sporns (2009) E. Bullmore and O. Sporns, Nature Review Neuroscience 10, 186 (2009).
- Gong et al. (2009) G. Gong, Y. He, L. Concha, C. Lebel, D. W. Gross, A. C. Evans, and C. Beaulieu, Cerebral Cortex 19, 524 (2009).
- He et al. (2007) Y. He, Z. J. Chen, and A. C. Evans, Cerebral Cortex 17, 2407 (2007).
- Hagmann et al. (2008) P. Hagmann, L. Cammoun, X. Gigandet, R. Meuli, C. J. Honey, V. J. Wedeen, and O. Sporns, PLoS Biology 6, e159 (2008).
- Iturria-Medina et al. (2008) Y. Iturria-Medina, R. C. Sotero, E. J. Canales-Rodriguez, Y. Aleman-Gomez, and L. Melie-Garcia, Neuroimage 40, 1064 (2008).
- Achard et al. (2006) S. Achard, R. Salvador, B. Whitcher, J. Suckling, and E. Bullmore, Journal of Neuroscience 26, 63 (2006).
- Bassett et al. (2006) D. S. Bassett, A. Meyer-Lindenberg, S. Achard, T. Duke, and E. Bullmore, Proceedings of the National Academy of Sciences 103, 19518 (2006).
- Cecchi et al. (2007) G. A. Cecchi, A. R. Rao, M. V. Centeno, M. Baliki, A. V. Apkarian, and D. R. Chialvo, BMC Cell Biology 8 Suppl 1, S5 (2007).
- Eguiluz et al. (2005) V. M. Eguiluz, D. R. Chialvo, G. A. Cecchi, M. Baliki, and A. V. Apkarian, Phys Rev Lett 94, 018102 (2005).
- van den Heuvel et al. (2008) M. P. van den Heuvel, C. J. Stam, M. Boersma, and H. E. Hulshoff Pol, Neuroimage 43, 528 (2008).
- Stam (2004) C. J. Stam, Neuroscience Letters 355, 25 (2004).
- Barabasi and Albert (1999) A. L. Barabasi and R. Albert, Science 286, 509 (1999).
- Keller (2005) E. F. Keller, Bioessays 27, 1060 (2005).
- Li et al. (2005) L. Li, D. Alderson, J. C. Doyle, and W. Willinger, Internet Mathematics 2, 431 (2005).
- Grove et al. (1998) J. E. Grove, W. N. Johnson, R. A. Kroeger, K. McNaron-Brown, J. G. Skibo, and B. F. Phlips, Astrophys J 500, 899 (1998).
- Mossa et al. (2002) S. Mossa, M. Barthelemy, H. E. Stanley, and L. A. N. Amaral, Phys Rev Lett 88, 138701 (2002).
- Lusseau and Newman (2004) D. Lusseau and M. E. J. Newman, Proc R Soc B 271, S477 (2004).
- Newman (2001) M. E. J. Newman, Phys Rev E 64, 016131 (2001).
- Amaral et al. (2000) L. A. N. Amaral, A. Scala, M. Barthelemy, and H. E. Stanley, Proceedings of the National Academy of Sciences 97, 11149 (2000).
- Pastor-Satorras and Vespignani (2001) R. Pastor-Satorras and A. Vespignani, Phys Rev Lett 86, 3200 (2001).
- Boguna et al. (2003) M. Boguna, R. Pastor-Satorras, and A. Vespignani, Phys Rev Lett 90, 028701 (2003).