History of Galaxy Interactions and their Impact on Star Formation over the Last 7 Gyr from GEMS
Abstract
We perform a comprehensive estimate of the frequency of galaxy mergers and their impact on star formation over 0.24–0.80 (lookback time 3–7 Gyr) using 3600 ( ) galaxies with GEMS , COMBO-17, and Spitzer data. Our results are: (1) Among 790 high mass ( ) galaxies, the visually-based merger fraction over 0.24–0.80, ranges from 9% 5% to 8% 2%. Lower limits on the major merger and minor merger fraction over this interval range from 1.1% to 3.5% , and 3.6% to 7.5%, respectively. This is the first, albeit approximate, empirical estimate of the frequency of minor mergers over the last 7 Gyr. Assuming a visibility timescale of 0.5 Gyr, it follows that over 3–7 Gyr, 68% of high mass systems have undergone a merger of mass ratio 1/10, with 16%, 45%, and 7% of these corresponding respectively to major, minor, and ambiguous ‘major or minor’ mergers. The average merger rate is a few galaxies Gyr-1 Mpc-3. Among 2840 blue cloud galaxies of mass , similar results hold. (2) We compare the empirical merger fraction and merger rate for high mass galaxies to three CDM-based models: halo occupation distribution models, semi-analytic models, and hydrodynamic SPH simulations. We find qualitative agreement between observations and models such that the (major+minor) merger fraction or rate from different models bracket the observations, and show a factor of five dispersion. Near-future improvements can now start to rule out certain merger scenarios. (3) Among 3698 galaxies, we find that the mean SFR of visibly merging systems is only modestly enhanced compared to non-interacting galaxies over 0.24–0.80. Visibly merging systems only account for a small fraction ( 30%) of the cosmic SFR density over 3–7 Gyr. This complements the results of Wolf et al. (2005) over a shorter time interval of 6.2–6.8 Gyr, and suggests that the behavior of the cosmic SFR density over the last 7 Gyr is predominantly shaped by non-interacting galaxies.
1 Introduction
Hierarchical cold dark matter (CDM) models provide a successful paradigm for the growth of dark matter on large scales. The evolution of galaxies within CDM cosmogonies depends on the baryonic merger history, the star formation (SF) history, the nature and level of feedback from supernovae and AGN, the redistribution of angular momentum via bars or mergers, and other aspects of the baryonic physics. Empirical constraints on the fate of the baryonic component, in particular their merger and SF history, are key for developing a coherent picture of galaxy evolution and testing galaxy evolution models (e.g., Kauffmann et al. 1993; Somerville & Primack 1999; Navarro & Steinmetz 2000; Murali et al. 2002; Governato et al. 2004; Springel et al. 2005a,b; Maller et al. 2006). Such constraints can help to resolve several major areas of discord between observations and CDM models of galaxy evolution, such as the angular momentum crisis, the problem of bulgeless and low bulge-to-total () ratio galaxies (Navarro & Benz 1991; D’Onghia & Burkert & 2004; Kautsch et al. 2006; Barazza, Jogee, & Marinova 2008; Weinzirl et al. 2009), and the substructure problem.
The merger history of galaxies impacts the mass assembly, star formation history, AGN activity and structural evolution of galaxies. Yet, the merger rate has proved hard to robustly measure for a variety of reasons. Initially, small samples hindered the first efforts to measure merger rates (Patton et al. 2000; Le Fevre et al. 2000; Conselice et al. 2003). Later studies drew from larger samples, and have used a variety of methods to characterize the interaction history of galaxies at . Studies based on close pairs report a major merger fraction of 2% to 10% over z 0.2 to 1.2 (Lin 2004; Kartaltepe et al. 2007; de Ravel et al. 2008) and 5% for massive galaxies at z 0.4 to 0.8 (Bell et al. 2006).
Among these studies, the estimated fraction of galaxies, which have experienced a major merger since 1.2 differ. Lin et al. (2004) find that 9% of the massive early type galaxies experienced a major merger since 1.2, while Bell et al. (2006) report that 50% of all galaxies with present-day stellar masses above have undergone a major merger since 0.8. This difference of a factor of five between the two studies is addressed by Bell et al. (2006; see their footnote 9) and is traced primarily to differences in the following factors: the dataset used, the redshift integration method, the way in which the authors handle the relative number density of the parent population from which pairs are drawn and that of the remnant population, the assumed visibility timescale, and the fraction of pairs estimated to be true gravitationally bound pairs.
Studies based on Gini-M20 coefficients report a fairly constant fraction ( 7 0.2 %) of disturbed galaxies over z 0.2 to 1.2 among bright galaxies (Lotz et al. 2008) in the AEGIS survey. Similar trends are found from early results based on visual classification and asymmetry parameters of high mass galaxies (e.g., Jogee et al. 2008). The study by Cassata et al. (2005) based on both pairs and asymmetries report a mild increase in the merger rate with redshift up to z 1, with the caveat of a small sample size. The merger rate/fraction at remains highly uncertain, owing to relatively modest volumes and bandpass shifting effects, but there is general trend towards higher merger fractions at higher redshifts (e.g., Conselice et al. 2003; Cassata et al. 2005).
Studies to date have brought important insights but face several limitations. In the case of studies based on close (separation 5 to 30 kpc) pairs, the translation of the pair frequency into a merger rate is somewhat uncertain due to several factors. The uncertainties in the spectrophotometric redshifts for some of the galaxies in pairs can cause us to overestimate or underestimate the true close pair fraction, with the latter effect being more likely. Corrections for this effect are uncertain and depend on the shape of the spectrophotometric redshift errors (e.g., see Bell et al. 2006 for discussion). Secondly, even pairs with members at the same redshift may not be gravitationally bound, and may therefore not evolve into a merger in the future: this effect causes the close pair fraction to be upper limits for the merger fraction. Thirdly, gravitationally bound pairs captured by this method sample different phases of an interaction depending on the separation, and any merger rate inferred depends on the separation, orbital eccentricity, and orbital geometry.
In the case of studies, which use automated parameters, such as CAS asymmetry and clumpiness parameters (Conselice et al 2000; Conselice 2003) or Gini-M coefficients (e.g., Lotz et al. 2004) to identify merging galaxies can fail to pick stages of both major and minor mergers where distortions do not dominate the total light contribution ( 3.4). Comparison with simulations suggest that the CAS criterion ( 0.35 and ; Conselice 2003) capture major mergers about 1/3 of the time, while the eye is sensitive to major merger features over twice as long (e.g., Conselice 2006; 3.4). To complicate matters, automated asymmetry parameters can also capture non-interacting galaxies hosting small-scale asymmetries that are produced by stochastic star formation ( 4.2). Thus, it is important to use several methods to assess the robustness of results and identify the systematics.
In this paper, we present a complementary study of the frequency of mergers and their impact on the SF activity of galaxies over 0.24–0.80 (lookback times of 3–7 Gyr111 We assume a flat cosmology with = 1- = 0.3 and H0 = 70 km s-1 Mpc-1 throughout.) using ACS, COMBO-17, and Spitzer 24 m data of 3600 galaxies in the GEMS survey. The outline of the paper is given below and describes how this study complements existing work:
- 1.
-
2.
Two independent methods are used to identify merging galaxies: a physically-driven visual classification system complemented with spectrophotometric redshifts and stellar masses ( 3.2 to 3.3), as well as automated CAS asymmetry and clumpiness parameters ( 3.4). This allows one of the most extensive comparisons to date between CAS-based and visual classification results ( 4.2).
-
3.
We design the visual classification system in a way that allows merger fractions and rates from observations and theoretical models to be readily compared. We classify as mergers those systems that show evidence of having experienced a merger of mass ratio 1/10 within the last visibility timescale. Throughout this paper, we use the standard definition whereby major mergers are defined to have stellar mass ratio (1/4 1/1), while minor mergers have (1/10 1/4). We set lower limits on the major and minor merger fraction ( 4.1). To our knowledge, this is the first, albeit approximate, empirical estimate of the frequency of minor mergers over the last 7 Gyr. While many earlier studies focused on major mergers, it is important to constrain minor mergers as well, since they dominate the merger rates in CDM models, and play an important role in building the bulges of massive galaxies (e.g., Weinzirl et al. 2009).
-
4.
We compare the empirical merger fraction and rate to a suite of CDM-based simulations of galaxy evolution, including halo occupation distribution models, semi-analytic models, and hydrodynamic SPH simulations ( 4.5). To our knowledge, these extensive comparisons have not been attempted to date, and are long overdue.
-
5.
The idea that galaxy interactions generally enhance the star formation rate (SFR) of galaxies is well established from observations (e.g., Larson & Tinsley 1978; Joseph & Wright 1985; Kennicutt et al. 1987; Barton et al 2003) and simulations (e.g., Negroponte & White 1983; Hernquist 1989; Barnes & Hernquist 1991, 1996; Mihos & Hernquist 1994, 1996; Springel, Di Matteo & Hernquist 2005b). However, simulations cannot uniquely predict the factor by which galaxy mergers enhance the SF activity of galaxies over the last 7 Gyr, since both the SFR and properties of the remnants in simulations are highly sensitive to the stellar feedback model, the bulge-to-disk () ratio, the gas mass fractions, and orbital geometry (e.g., Cox et al 2006; di Matteo et al. 2007). This motivates us in 4.6 to empirically investigate the impact of interactions on the average UV-based and UV+IR-based SFR of high mass ( ) and intermediate-to-high mass ( ) galaxies over 0.24–0.80.
-
6.
The SF properties of merging and non-interacting galaxies since is of great astrophysical interest, given that the cosmic SFR density is claimed to decline by a factor of 4 to 10 since 1 (e.g., Lilly et al. 1996; Ellis et al 1996; Flores et al. 1999; Haarsma et al. 2000; Hopkins 2004; Pérez-González et al. 2005; Le Floc’h et al. 2005). In 4.7, we set quantitative limits on the contribution of visibly merging systems to the UV-based and UV+IR-based SFR density over 0.24–0.80. Our study covers a 4 Gyr interval ( 3–7 Gyr or 0.24–0.80) and extends the earlier studies carried out over a smaller 0.6 Gyr interval ( 6.2–6.8 Gyr or 0.65–0.75) by Wolf et al. (2005) and Bell et al. (2005) on the UV and IR luminosity density, respectively. Our study also complements IR-based studies by Lotz et al. (2008), Hammer et al. (2005; l95 galaxies at ) and Melbourne et al. (2005; 800 galaxies) in terms of better number statistics and the use of both UV-based and IR-based SFR indicators.
2 Dataset and Sample Selection
This study uses data from the Galaxy Evolution from Morphology and SEDS (GEMS; Rix et al. 2004) survey, which provides high resolution Hubble Space Telescope (HST) Advanced Camera for Surveys (ACS) images in the F606W and F850LP filters over an 800 arcmin2 () field centered on the Chandra Deep Field-South (CDF-S). Accurate spectrophotometric redshifts [/(1 + ) 0.02 down to = 24] and spectral energy distributions, based on 5 broad bands () and 12 medium band filters, are available from the COMBO-17 project (Wolf et al. 2004). The ACS data reach a limiting 5 depth for point sources of 28.3 and 27.1 AB mag in F606W and F850LP, respectively (Rix et al. 2004; Caldwell et al. 2008). The effective point spread function (PSF) in a single F606W image is , corresponding to 260 pc at 0.24 and 520 pc at 0.80. The PSF of combined drizzle images is . In addition to ACS imaging, the GEMS field has panchromatic coverage which includes (Rieke et al. 2004; Papovich et al. 2004) and data (Alexander et al. 2003; Lehmer et al. 2005).
We use stellar masses from Borch et al. (2006). We refer the reader to the latter publication for a detailed description and provide a summary here. Using the 17-passband photometry from COMBO-17, objects were classified as main sequence, stars, white dwarfs, galaxies, and quasars using color indices and their photometric redshifts were estimated using simple dust-reddened single-burst SED templates (Wolf et al. 2004). For galaxies and quasars, the joint probability of a given redshift and a given rest-frame SED is derived and this procedure provides a minimum error variance estimation of both the redshift and the SED template. Once the redshfit has been estimated, the SEDs in 17 bands were fitted with a new set of template SEDs with more plausible SF histories in order to derive a stellar (Borch et al. 2006). The library of SEDs is built using the PEGASE stellar population synthesis model (see Fioc & Rocca-Volmerange 1997 for an earlier version of the model) and the underlying SF histories are parameterized by the three-component model, with a Kroupa (Kroupa et al. 1993) initial mass function (IMF) adopted in the mass regime 0.1–120 . We note that the stellar masses are consistent within 10% with the masses that would be estimated using a different Kroupa (2001) or Chabrier (2003) IMF 222We adopt a Chabrier (2003) IMF when exploring the contribution of mergers to the cosmic SFR ( 4.6 and 4.7).. The reddest templates have smoothly-varying exponentially-declining star formation episodes, intermediate templates have a contribution from a low-level constant level of star formation, while the bluer templates have a recent burst of star formation superimposed. Random stellar mass errors are dex on a galaxy-by-galaxy basis, and systematic errors in the stellar masses were argued to be at the 0.1 dex level (Borch et al. 2006). Bell & de Jong (2001) argued that galaxies with large bursts of recent star formation could drive down stellar M/L values by up to 0.5 dex at a given color, but we note that the Borch et al. (2006) templates do include bursts explicitly, thus compensating for the worst of the uncertainties introduced by bursting star formation histories.
We present the results based on the visual classification and CAS (Conselice 2003) parameters ( 3) of GEMS F606W, rather than F850LP images, for the following reasons. The F606W images are 1.2 AB magnitude deeper than the GEMS F850LP images and allow more reliable characterization of morphological features in the presence of cosmological surface brightness dimming at the rate of (1+)-4 (e.g., Barden et al. 2007). Furthermore, the low signal to noise in the F850LP images leads to large error bars on the asymmetry and clumpiness parameters generated by the CAS code, effectively making it impractical to use these values in CAS merger diagnostics ( 3.4). When using the F606W images, we only include results over the redshift range 0.24–0.80 in order to ensure that the rest-frame wavelength stays primarily in the optical band and does not shift well below the 4000 Å break. In the fourth redshift bin ( 0.6 to 0.8) shifts to the violet/near-UV (3700 Å to 3290 Å), but as we show in 4.1, this does not significantly impact the results. We discard the last redshift bin at where shifts into the far-UV. These steps lead to a sample of 4766 galaxies selected down to 24, over 0.24–0.80 ( 3–7 Gyr).
In this paper, we present results for two samples of astrophysical interest, which are derived by applying stellar mass cuts to the above sample of 4766 galaxies The first sample (henceforth sample S1) focuses on galaxies with high stellar mass ( ; Table 1). The sample size is originally 804 galaxies, out of which 798 (99.2%) could be visually classified. For this stellar mass range, the red sequence and blue cloud galaxies are both complete out to the highest redshift bin 0.62–0.80 for our sample, and we have theoretical predictions for comparison (see 4.5) from semi-analytical models (e.g, Somerville et al. 2008; Hopkins et al. 2007; Khochfar & Burkert(2005); Bower et al. 2006), -body (D’Onghia et al. 2008), and hydrodynamical SPH simulations (e.g., Maller et al. 2006). Note that the survey has few galaxies above (Fig. 1), and hence the high mass ( ) sample primarily involves galaxies in the range to .
We also present selected results for the sample S2 of 3698 galaxies with and visual classes. Although this sample includes the 790 high mass galaxies in sample S1, it is dominated by systems of intermediate mass (). For the mass range , the blue cloud is complete in our sample out to 0.80, while the red sequence is incomplete in the higher redshift bins. Where appropriate, we will therefore present results for the blue cloud sample only (e.g., lower part of Table 2). The rest-frame color is plotted versus the stellar mass for the sample S2 in Figure 1. The redshift interval is divided into four 1 Gyr bins. The diagonal line marks the separation of the red sequence and the blue cloud galaxies (BCG) at the average redshift of the bin. We use the definition in Borch et al. (2006) and Bell et al. (2004) for CDF-S:
| (1) |
The vertical lines on Figure 1 marks the mass completeness limit (Borch et al. 2006) for the red sequence galaxies. The blue cloud galaxies are complete well below this mass (Borch et al. 2006).
3 Methodology: Identifying Mergers and Non-Interacting Galaxies
3.1 Overview of the Methodology
Galaxy mergers with a mass ratio 1/10 can have a significant impact on galaxy evolution. According to simulations, major mergers (defined as those with mass ratio 1/4 1/1) typically destroy stellar disks, transforming them via violent relaxation, into systems with a steep or r1/4 de Vaucouleurs-type stellar profile, such as ellipticals (e.g., Negroponte & White 1983; Barnes & Hernquist 1991; Mihos & Hernquist 1996; Struck 1997; Naab & Burkert 2001; but see Robertson et al. 2004). Simulations further suggest that recent major mergers at are typically associated with arcs, shells, ripples, tidal tails, large tidal debris, highly asymmetric light distributions, double nuclei inside a common body, galaxies linked via tidal bridges of light, and galaxies enclosed within the same distorted envelope of light.
Minor mergers (defined as those with 1/10 1/4) of two spirals will not destroy the disk of the larger spiral (e.g., Hernquist & Mihos 1995; Smith et al. 1997; Jogee et al. 1999). Typically, the smaller companion sinks via dynamical friction, may excite warps, bars, spirals, and other non-axisymmetric perturbations, and leads to vertical heating, arcs, shells, ripples, tidal tails, tidal debris, warps, offset rings, highly asymmetric light distributions, etc (e.g., Quinn et al. 1993; Hernquist & Mihos 1995; Mihos et al. 1995; Quinn, Hernquist, & Fullagar 1993; Smith et al. 1994; Jogee 1999; Jogee et al. 1998, 1999; review by Jogee 2006 and references therein).
One goal of this paper is to identify systems whose morphology and other properties suggest they they have recently experienced a merger of mass ratio 1/10. We employ two methods: a physically-driven visual classification system ( 3.2 to 3.3) complemented with spectrophotometric redshifts and stellar masses, and a method based on quantitative asymmetry (), and clumpiness () parameters ( 3.4) derived using the CAS code (Conselice 2003). While many studies use only automated methods or visual classification, we choose to use both methods in order to better assess the systematics, and to test the robustness of our results.
3.2 Visual Classification of Mergers
The visual classification system we adopted for identifying mergers was aimed at setting a procedural framework that allows merger fractions and rates from observations and the theoretical models (outlined in 4.5) to be defined in similar ways and to be readily compared.
Specifically the theoretical models described in 4.5 track systems which have a stellar mass and have experienced a merger of a certain mass ratio within the last visibility timescale , between times ( - ) and . Here is the time corresponding to the observed redshift ; is the timescale over which morphological distortions remain visible after a merger and we adopt a nominal value of 0.5 Gyr (see 4.3); is the cutoff mass for the merger, which is for the high mass sample S1 and for the intermediate mass sample S2 ( 2). In the models, major mergers are associated with a mass ratio of 1/4 1/1, minor mergers with 1/10 1/4, and major+minor mergers with 1/10.
Analogous to the theoretical models, the goal of the visual classification system is to identify systems with , which show evidence of having experienced a merger of mass ratio 1/10 within the last visibility timescale . In this paper, we refer to such systems either as interacting galaxies or as mergers. These mergers are denoted as having visual type ‘Int’ in the figures of this paper and examples are shown in Figure 2. In practice, they consist of three types of mergers, which we denote as Int-1, Int-2a, and Int-2b, and define in 3.2.1 and 3.2.2. These three types of systems encompass young to advanced mergers, and are identified/handled in different ways, as described below.
3.2.1 Mergers of type Int-1
Mergers of type Int-1 primarily represent advanced mergers of mass , which appear as a single system in ACS images, and are likely associated with a merger of mass ratio 1/10 that occurred betwen times ( - ) and . Systems of type Int-1 are identified empirically based on the following criteria:
-
1.
They have and show morphological distortions, which are similar to those seen in simulations of mergers of mass ratio 1/10, and remain visible over the visibility timescale . The distortions include arcs, shells, ripples, tidal tails, large tidal debris, highly asymmetric light distributions, double nuclei inside a common body, etc. The presence of such distortions is considered indicative of a past merger that occurred between times ( - ) and . We also make an extra test to verify that the distortions are caused by a past merger, rather than a present tidal interaction, by verifying that such systems do not have a distorted companion of similar spectrophotometric redshift within 40 kpc.
-
2.
They appear as a single distorted system, rather than 2 individually recognizable galaxies, in the ACS images of PSF (corresponding to 380 pc at 0.24 and 750 pc at 0.80). This suggests the system is an advanced merger where the 2 progenitor galaxies have had time to coalesce into a single ACS system by time .
Such advanced mergers have a single redshift (Wolf et al. 2004), stellar mass (Borch et al. 2006), and UV-based star formation rate (Bell et al. 2005, 2007) determined from the COMBO-17 ground-based data of resolution . The lack of resolved COMBO-17 data for the individual progenitor galaxies that led to the remnant is not a problem because we are only concerned in the analysis with the stellar mass and SFR of the merger. Furthermore, the condition is expected to apply to the merger, and not to the progenitors, in both model and observations.
The majority of the mergers we identify are of type Int-1. Examples in Figure 2 are cases 2, 3, 4, 5, 6, 7, 9, 10 11, and 12.
For mergers of type Int-1 with a single redshift and stellar mass, the evidence for a merger of mass ratio 1/10 does not come from a measured stellar mass ratio , but instead is inferred from the presence of the afore-mentioned morphological distortions, which are seen in simulations of mass ratio 1/10.
Without individual stellar masses and , the further separation of these mergers into major and minor is not possible in every case, since the morphological disturbances induced depend not only on the mass ratio of the progenitors, but also on the orbital geometry (prograde or retrograde), the gas mass fraction, and structural parameters (e.g., Mihos & Hernquist 1996; Struck 1997; Naab & Burkert 2001; Mihos et al. 1995, di Matteo et al. 2007). Instead, we can only separate such mergers into three groups: clear major mergers clear minor mergers, and ambiguous cases of ‘major or minor’ merger as follows:
- 1.
-
2.
The class of clear minor merger includes the merger systems where the outer disk (identified based on the presence of disk features, such as spiral arms and bars) has clearly survived the recent past merger. Examples include case 2 of a warped disk in Fig. 2. The reasoning behind classifying such remnants as a minor merger is that the outer disk of a galaxy survives a minor merger, but not a major merger. While major mergers of extremely gas-rich disks with low star formation efficiency can lead to a remnant with an extended stellar disk (Robertson et al. 2004), such mergers are unlikely to be relevant for our study, which focuses on fairly massive systems (with stellar masses ) at .
One further criterion is applied. When identifying minor mergers through the presence of a distorted surviving outer disk, we take care to check that the candidate is not in the early phases of a merger, which would destroy the disk in the near future, on a timescale . We do this by avoiding those galaxies, which have both a distorted outer disk and a close companion of similar redshift (within the photometric redshift accuracy) and of mass ratio 1/4.
-
3.
The class of ambiguous ’major or minor’ merger is assigned to systems hosting distortions, which could be due to both a major and a minor merger. Examples in Fig. 2 are cases 3, 4, 5, 7, 8, 10, and 11.
3.2.2 Mergers of type Int-2
Mergers of type Int-2 primarily represent young mergers, which appear as very close pairs of overlapping galaxies (VCPOG) in ACS images, have , and are likely associated with a merger of mass ratio 1/10 that occurred betwen times ( - ) and .
Systems of type Int-2 are identified empirically based on the following criterion: ACS images show 2 individually recognizable galaxies whose bodies overlap to form a common continuous envelope of light, and whose centers have a small separation 20 kpc. One or both of the galaxies often have morphological distortions. These properties suggest that the 2 progenitor galaxies have recently merged, at a time close to , but have not yet coalesced into a single ACS system of type Int-1.
It is important to note that we are not concerned here with pairs of galaxies with a wide separation (where is the relative speed between the 2 progenitor galaxies), because such systems represent potential future mergers that will occur in the next discrete time step of ( + ). Instead, we are only interested in very close overlapping pairs of galaxies with separation , which represent young mergers that have occurred at a past time close to , and which will likely coalesce into a single ACS system well before the next discrete time step of ( + ). For of 0.5 Gyr and 100 km/s, translates to 50 kpc. We thus only consider VCPOG where the galaxies overlap and have a separation 20 kpc, which corresponds to at 0.24 and at 0.80.
One caveat in handling systems of type Int-2 is that some of the VCPOGs may be chance projections rather than real gravitationally bound mergers. However, this uncertainty does not significantly affect our result as the vast majority ( 80%) of the mergers in our study are of type Int-1 rather than Int-2. Furthermore, the likelihood of chance projection is mitigated due to the fact that we are considering pairs of very small separation.
The COMBO-17 ground-based data of resolution will resolve a fraction of the VCPOG that make up systems of type Int-2. Thus, we divide the latter systems into sub-classes Int-2a and Int-2b:
-
1.
Mergers of type Int-2a: These very close pairs of overlapping galaxies are not resolved by COMBO-17 data. Thus, only one stellar mass, redshift, and UV-based SFR are available for the pair. The lack of resolved COMBO-17 data for each galaxy in the the pair is not a problem because we are only concerned with the mass and SFR of the progenitor. Furthermore, the condition is expected to apply to the merger, and not to the progenitors, in both model and observations.
Since only one mass is available for the entire merged system, the evidence for a merger of mass ratio 1/10 in systems of type Int-2a does not come from a measured mass ratio, but instead is deduced from the presence of morphological distortions, which are seen in simulations of mass ratio 1/10. Essentially, the same approach described for systems of type Int-1 in 3.2.1 is used here.
-
2.
Mergers of type Int-2b: These VCPOG are resolved by COMBO-17 data such that stellar masses and , as well as redshifts and UV-based SFRs, are available for both galaxies in the pair. An example is case 1 in Fig. 2). For systems of type Int-2b, the evidence for a merger of mass ratio 1/10 comes directly from the measured mass ratio . The SFR and mass of the merger is considered as the sum of that of its two progenitor galaxies
One caveat should be noted concerning the completeness of mergers of type Int-2b. Strictly speaking, the criterion applies to the merger mass () rather than to or individually. For counting all major mergers of type Int-2b with 1/4 1/1, requires our sample to be complete down to for 1:1 major mergers, and down to for 1:3 major mergers. Similarly, counting all minor mergers of type Int-2b with 1/10 1/4 requires our sample to be complete down to for 1:4 minor mergers, and down to for 1:9 minor mergers. For the blue cloud, where we are complete down to , our count of mergers of type Int-2b is complete, but there will inevitably be incompleteness on the red sequence, particularly among minor mergers. The impact of this incompleteness on our results is mitigated by the fact that most of the galaxies in our sample is on the blue cloud (see Fig. 1) rather than on the red sequence, and the vast majority ( 80%) of the mergers in our study are of type Int-1 rather than Int-2.
3.3 Visual Classification of Non-Interacting Galaxies
Systems that do not satisfy the criteria in 3.2 and show no evidence of a recent merger of mass ratio 1/10 are classified as non-interacting. These systems may harbor very subtle distortions, but none of the kind shown by the mergers of type ‘Int-1 and ‘Int-2’. The non-interacting systems are divided into two sub-groups: non-interacting E-to-Sd and non-interacting Irr1. These are shown in Figure 3 and described below.
-
1.
‘Non-Interacting Irr1’: It is important to note that even non-interacting galaxies have some inherent level of small-scale asymmetries in optical light due to star formation activity. In the case of low mass galaxies, further asymmetries may also arise due to the low ratio of rotational to random velocities, as is commonly seen in Im and Sm. These internally-triggered asymmetries due to SF in non-interacting galaxies differ in scale (few 100 pc vs several kpc) and morphology from the externally-triggered distortions typical of the ‘Int-1’ class. We classify non-interacting galaxies with such internally-triggered asymmetries as ‘Irr1’ (see Figure 3). Such systems may get erroneously classified as mergers in automated asymmetry-based codes (see 4.2).
-
2.
‘Non-Interacting E-to-Sd’: Galaxies are assigned the ‘E to Sd’ class if they are fairly symmetric, have Hubble types in the range E-to-Sd, and are not associated with any overlapping or contact companion.
In this paper, we are primarily concerned about the differences between three groups: the mergers in class ‘Int’, the non-interacting E-to-Sd galaxies, and the non-interacting Irr1 galaxies. The details of how E-to-Sd galaxies are further sub-divided into individual Hubble types do not have any major impact on our main results. We nonetheless briefly describe this sub-classification as it is of interest to other studies and relevant for the test presented at the end of 4.1. We use conventional definitions (Binney & Merrifield 1998) for individual Hubble types (E, S0, Sa, Sb-Sc, and Sd). We assign an elliptical (E) type if a galaxy exhibits a smooth featureless appearance, shows no disk signatures, such as a bar or spiral arms, and appears to be a pure spheroid. We assign an S0 class if a galaxy hosts a smooth central brightness condensation, surrounded by an outer component, which is relatively featureless (without spiral arms) and has a less steeply declining brightness profile. We assign Sa, Sb-Sc, and Sd types using primarily visual estimates of the ratio, and secondarily the smoothness/clumpiness of the disk. At intermediate redshifts, where the faint smooth arms of Sa galaxies are not easily discernible, the distinction between E, S0, and Sa becomes blurred (see also 4.1). However, this ambiguity between Es, S0s and Sas is not a problem for the subsequent analyses in this paper, since galaxies are grouped together either as ‘E+S0+Sa’ or ‘E-to-Sd’.
The fraction of interacting systems (i.e., mergers), ‘non-interacting E-to-Sd’ galaxies, and ‘non-interacting Irr1’ galaxies is shown in Table 1 for the high mass sample, and in Table 2 for the intermediate mass sample. Further results and tests on the merger history from visual classes are presented in 4.1 and 4.3.
3.4 CAS
We derived the concentration , asymmetry , and clumpiness (CAS) parameters by running the the CAS code (Conselice 2003) on the F606W images. As is standard practice, the segmentation maps produced during the original source extraction (Caldwell et al. 2008) are used to mask neighbors on each ACS tile. The CAS code derives the asymmetry index (Conselice 2003) by rotating a galaxy image by 180 deg, subtracting the rotated image from the original image, summing the absolute intensities of the residuals, and normalizing the sum to the original galaxy flux. CAS improves the initial input center with the IRAF task ‘imcenter’ and then performs a further refinement within a grid, picking the center that minimizes . The CAS concentration index (Bershady et al. 2000) is proportional to the logarithm of the ratio of the 80% to 20% curve of growth radii within 1.5 times the Petrosian inverted radius at ( = 0.2), normalized by a logarithm
| (2) |
The clumpiness index (Conselice 2003) is defined as the ratio of the amount of light contained in high-frequency structures to the total amount of light in the galaxy. In order to compute , the CAS code first smooths the galaxy image with a filter of size equal to 1/6 of the Petrosian radius to produce a lower resolution image whose high-frequency structure has been washed out. The latter image is then subtracted from the original image to produce a residual map that contains only the high-frequency components of the galaxy’s stellar light. The flux of this residual light is then summed and divided by the sum of the original galaxy image flux to obtain a galaxy’s clumpiness () value. Tests on the interaction history from CAS are presented in 4.2.
It has been argued that the criterion 0.35 and (henceforth referred to as the CAS merger criterion) captures galaxies that exhibit large asymmetries produced by major mergers (Conselice 2003). We will assess this in 4.2.
4 Results and Discussion
4.1 The merger fraction from visual classes
Fig 4 compares the fraction of systems with evidence of a recent merger of mass ratio 1/10, based on visual classification by 3 classifiers (SJ, SM, KP). Results are shown for both the high mass ( ) sample S1 and the intermediate mass ( ) sample S2. On this figure, the plotted error bar for the merger fraction only includes the binomial term [(1-)/]1/2, for each bin of size . The same trend is seen for all 3 classifiers and the maximum spread / in the four bins is 15%, 17%, 26%, and 26%, respectively. In subsequent analyses, we adopt a conservative error bar on that includes in quadrature both the binomial term and a dispersion of 26% to capture the inherent subjectivity in the visual classification.
Another key test is to assess the impact of redshift-dependent systematic effects, such as bandpass shifting. When using the F606W filter whose pivot wavelength is 5915 Å, the rest frame wavelength () corresponds to the rest-frame optical at the mean redshift of the first 3 bins, but shifts to the rest-frame violet/near-UV (3700 Å to 3290 Å) in the last bin ( 0.6 to 0.8). Galaxies tend to look slightly more asymmetric at near-UV wavelengths due to the prominence of young stars. In order to quantitatively test the impact of bandpass shift on our visual classes, we use the redder F850LP images from the GOODS survey, which overlaps with the central 20% of the GEMS survey area. The F850LP filter has a pivot wavelength of 9103 Å and traces the rest-frame optical (7340 Å to 5057 Å) in all four redshift bins out to 0.8. The F850LP images also have 5 times longer exposures than the GEMS F850LP and F606W images. Figure 5 shows GEMS F606W and GOODS F850LP images of typical disturbed and normal galaxies in the last 2 redshift bins ( 0.47 to 0.8).
While the GOODS images have higher S/N, and trace redder older stars, they do not reveal dramatically different morphologies from those in the GEMS F606W images (Fig 5). Furthermore, the 855 intermediate mass ( ) galaxies in the GEMS/GOODS overlap area, were classified using both GOODS F850LP and GEMS F606W images by the 3 classifiers. We find that the ratio of (/) ranges from 0.8 to 1.2 across the 3 classifiers (Table 3), where and are the fraction of merging systems based on the GEMS F606W and GOODS F850LP images, respectively. The mean changes by only 6% (Table 3). In effect, over of the systems classified as mergers (‘Int’) in the GEMS F606W images retain the same visual class in the GOODS F850LP. Among the remaining objects, some classified as non-interacting in GEMS F606W get reclassified as disturbed in GOODS F850LP, and vice-versa. The fact that does not change by a large amount between GEMS F606W and GOODS F850LP is not surprising, since the rest-frame wavelength of GEMS F606W in the last bin shifts only to the violet/near-UV, rather than to the far-UV, where morphological changes are more dramatic. We conclude that our results are not highly impacted by bandpass shifting, and any effect is accounted for by our error bars of in .
Another redshift-dependent systematic effect is surface brightness dimming at the rate of (1+)-4 (e.g., Barden et al. 2008). This leads to surface brightness dimming by a factor of 1.0 to 2.5 magnitude over the redshift range 0.24 to 0.80. This is mitigated in part by two factors: galaxies are on average 1.0 magnitude brighter in surface brightness by 0.8 (e.g., Barden et al. 2005), and the average SFR rises by a factor of 4 out to 0.8 (e.g., see 4.6). Two approaches can be adopted to assess the impact of surface brightness dimming. The first is to artificially redshift disturbed galaxies in the lowest redshift bin ( 0.24) out to 0.8, either assuming passive evolution or adding in a 1 magnitude of brightening in surface brightness. However, this approach suffers from the limitation that it implicitly assumes that galaxies at 0.8 are similar to those at 0.24 and evolve passively with time. A better approach, which does not make such assumptions, is to repeat the analysis and visual classification using deeper images of the galaxies and assess the resulting change in visual classes. The above-described test performed using the deep GOODS F850LP image (Fig. 5) is an example of such a test, and indicates that the eye-ball morphologies do not change within the error bars of in . We note however that quantitative CAS parameters can change with the deeper GOODS images (e.g., Conselice et al. 2008).
Finally, as an extra test, we checked the distribution of Sérsic indices for single-component Sérsic fits (Barden et al. 2005) for the visual classes of the sample S2 of intermediate mass galaxies (Fig. 6). Non-interacting disk-dominated systems are expected to have 2.5, while massive ellipticals and bulge-dominated systems typically have higher Sérsic indices. We indeed find that over 85% of the systems visually classified as Sb-Sd and Irr1 have 2.5 in the intermediate mass ( ) sample. Furthermore, as expected, the vast majority of the systems typed as Sa have 4. However, the systems typed as E and S0 span a broad range in : most of them have , but there is a tail of lower values. This is not surprising given the previously described difficulties ( 3.3) in separating E, S0, and Sa galaxies at intermediate redshifts. However, this ambiguity between E, S0, and Sa systems is not a problem for the subsequent analyses in this paper, since galaxies are grouped together either as ‘E+S0+Sa’ or ‘E-to-Sd’. In fact, as stressed in 3.3, the main results presented in this paper depend only on the differences between three groups: mergers (‘Int’), non-Interacting E to Sd galaxies, and non-interacting Irr1 galaxies.
4.2 The merger fraction from CAS
It has been argued that the CAS merger criterion ( 0.35 and ) captures systems that exhibit large asymmetries produced by major mergers (Conselice 2003). This criterion is based on calibrations of the CAS system at optical rest-frame wavelengths ( 4500 Å). However, there are several caveats: a) The CAS criterion ( 0.35 and ) will miss out interacting galaxies where the morphological distortions contribute to less than 35 % of the total galaxy flux. (b) Calibrations of with N-body simulations (Conselice 2006) shows that during major mergers with mass ratios 1:1 to 1:3, the asymmetry oscillates with time. Typically, it exceeds 0.35 for 0.2 Gyr in the early phases when the galaxies start to interact, falls to low values as the galaxies separate, rises for 0.2 Gyr as they approach again for the final merger, and eventually tapers down as the final remnant relaxes. On average, the 0.35 criterion is only satisfied for one third of the merger timescale in these N-body simulations. For minor mergers of mass ratios 1:5 and below, the asymmetries are too low to satisfy 0.35. (c) To complicate matters, automated asymmetry parameters can also capture non-interacting galaxies whose visible light shows small-scale asymmetries due to star formation (e.g., Miller et al. 2008; Lotz et al. 2008).
Visual tests that verify how well the CAS criterion ( 0.35 and ) works at intermediate redshifts have been performed using spot checks and small-to-moderate samples (e.g., Mobasher et al 2004; Conselice 2003; Conselice et al. 2003; Conselice et al. 2005). However, what has been missing to date is a quantitative estimate, based on a large sample of galaxies, of the recovery fraction of CAS (i.e., the fraction of visually-classified mergers that the CAS criterion picks up), and the contamination level of CAS (i.e., the fraction of visually-classified non-interacting galaxies that the CAS criterion picks up). Both the recovery fraction and contamination level might be expected to depend on the rest-frame wavelength used, the mass and SFR of the galaxies, etc. In this paper, we perform one of the most extensive comparisons to date, at intermediate redshifts ( 0.24 to 0.80), between CAS-based and visual classification results for both high mass ( ) and intermediate mass ( ) galaxies. We assess the effectiveness of the CAS merger criterion ( 0.35 and ) over this interval, where the rest-frame wavelength rest varies from 4770 Å to 3286 Å. We note that the rest-frame wavelength range here extends to somewhat bluer wavelengths than the range ( 4500 Å) over which the CAS system was calibrated.
Fig 4 compares the merger fractions that would be obtained using the CAS criterion (), as opposed to visual classification (). For the high mass ( ) galaxies, visually based and CAS-based merger fractions agree within a factor of two, with being higher than at , and being lower at (top panel of Fig 4). However, for the intermediate mass ( ) galaxies (lower panel of Fig 4), at the CAS-based merger fraction can be systematically higher by a factor 3 than the visually based . The reason for this discrepancy, as we show below, is that at bluer rest-frame wavelengths (i.e., higher redshifts), the CAS criterion picks up a significant number of non-interacting dusty, star-forming galaxies.
Fig. 7 plots the CAS asymmetry and clumpiness parameter for galaxies in the four redshift bins covering the interval 0.24–0.80. Galaxies satisfying the CAS criterion ( 0.35 and ) lie in the upper left hand corner. One can see that while the CAS criterion captures a fair fraction of the mergers (coded as orange stars), it also picks up a large number of non-interacting galaxies.
We define the recovery fraction () of CAS as the fraction of visually-classified mergers (‘Int’), which are picked up by the CAS criterion ( 0.35 and ). For the high mass sample ( ) sample, the recovery fractions in the four redshift bins are 50% (2/4), 14% (1/7), 42% (8/19), and 56% (20/36) respectively, with low number statistics dominating the first two bins. For the intermediate mass ( ) sample, the recovery fractions in the four redshift bins are 50% (13/26), 69% (30/43), 59% (49/83), and 73% (85//116), respectively, as illustrated in the top panel of Fig. 8. We inspected the visually-classified mergers missed out by the CAS criterion ( 0.35 and ) and show typical cases in the top panel of Fig. 9. The missed cases include galaxies where tidal or accretion features in the main disk of a galaxy contribute less than of the total light (e.g., case 3 in Fig. 9); galaxies with close double nuclei (e.g., case 2 in Fig. 9) where CAS might refine the center to be between the two nuclei, thereby leading to a low ; and pairs of fairly symmetric galaxies whose members have similar redshifts within the spectrophotometric error, appear connected via weak tidal features, and have a stellar mass ratio (e.g., case 1 in Fig. 9 where 0.25).
We define the contamination fraction of CAS as the fraction of those systems which satisfy the CAS criterion ( 0.35 and ) and are therefore considered as likely major mergers by CAS, but yet are visually classified as non-interacting. For the high mass sample ( ) sample, the CAS contamination fractions in the four redshift bins are 34%, 75%, 72%, and 67% respectively, with low number statistics dominating the first two bins. For the intermediate mass ( ) sample, the corresponding CAS contamination fractions are 44%, 53%, 76%, and 82% respectively, as shown in the lower panel of Fig. 8. On the latter figure, represents the total number of galaxies satisfying the CAS criterion ( 0.35 and ) in the four redshift bins. Plotted on the y-axis is the fraction of different visual types (mergers, non-interacting E-Sd, and non-interacting Irr1) among these “CAS mergers”. Across the four redshift bins, the non-interacting E-Sd and Irr1 make up 44%, 53%, 76%, and 82% of the CAS systems. Typical cases are shown in the lower panel of Fig. 9. They include non-interacting actively star-forming systems where SF induces small-scale asymmetries in the optical blue light (e.g., cases 4 and 6 in Fig. 9); systems where is high due to the absence of a clearly defined center (e.g., case 8 in Fig. 9) or due to the center being blocked by dust (e.g., cases 4 and 9 in Fig. 9); and compact or edge-on systems where the light profile is steep such that small centering inaccuracies can lead to large (e.g., case 9 in Fig. 9).
In summary, we find that the CAS-based merger fraction agrees within a factor of two with visually based one for high mass ( ) galaxies, but can overestimate the merger fraction at 0.5 by a factor 3 for intermediate mass ( ) galaxies. For the latter mass range, the systems counting toward are a mixed bag: the CAS criterion misses about half of the visually-classified mergers, but picks up a dominant number of non-interacting dusty, star-forming galaxies. We thus conclude that the CAS merger criterion is ill-suited for use on -band images at 0.5, where the rest frame wavelength falls below Å, particularly in the case of intermediate mass galaxies with significant SF, gas, and dust. Modified CAS criteria in the near-UV based on morphological k-corrections (Taylor et al. 2007) might alleviate this problem.
4.3 Interaction history of massive and intermediate mass galaxies
Based on the tests in 4.1 and 4.2, we decided to adopt the mean merger fraction based on visual classes for our two samples of interest. For the high mass ( ) sample, which is complete on both the blue cloud and red sequence ( 2), the results are shown on in Table 1. The error bar shown on the merger fraction in both tables now includes the sum in quadrature of a binomial term [(1-)/]1/2 for each bin of size , along with a fractional error of 26% to capture the dispersion between classifiers, and uncertainties due to bandpass shifting and surface brightness dimming.
From Table 1 and Fig 4, it can be seen that the merger fraction among high mass ( ) galaxies does not show strong evolution over lookback times of 3–7 Gyr, ranging from 9% 5% at 0.24–0.34, to 8% 2% at 0.60–0.80, as averaged over every Gyr bin. As discussed in 3.2, the merger fraction refers to systems with evidence of a recent merger of mass ratio 1/10.
As outlined in 3.2, these mergers were further subdivided among 3 classes: clear major merger, clear minor merger, and ambiguous ‘major or minor merger’ cases. The first two classes are used to set lower limits on the major and minor merger fraction. The lower limit on the major ( 1/4) merger fraction, determined in this way, ranges from 1.1% to 3.5% over 0.24–0.80. The corresponding lower limit on the minor (1/10 1/4) merger fraction ranges from 3.6% to 7.5%. To our knowledge, this is the first, albeit approximate, empirical estimate of the frequency of minor mergers over the last 7 Gyr. The ambiguous cases of ‘major or minor merger’ make up a fraction between 1.2% to 2.0%.
When converting the observed fraction of galaxy mergers into a merger rate , we must bear in mind that in any observational survey of galaxies, mergers can only be recognized for a finite time , which is the timescale over which a merging galaxy will appear morphologically distorted. This timescale depends on the mass ratio of the merger as well as the gas fraction of the progenitors: –0.8 for gas-rich galaxies, and –0.4 Gyr for gas-poor galaxies (T.J. Cox, private communication). This timescale will also depend on many observational factors such as the method used to identify mergers (e.g. visual classification vs. CAS or other statistical methods) and the depth of the imaging used. We assume a representative value of Gyr here, but we must keep in mind that there are at least factors of two uncertainty in this number. The merger rate is given by
| (3) |
where is the comoving number density of galaxies above a certain mass limit in the redshift bin.
For the sample of high mass ( ) galaxies, our measured merger fraction and assumed value of 0.5 Gyr lead to a corresponding merger rate of a few galaxies Gyr-1 Mpc-3. Assuming a visibility timescale of 0.5 Gyr, it follows that on average, over 3–7 Gyr, 68% of high mass systems have undergone a merger of mass ratio 1/10. Of these, we estimate that 16%, 45%, and 7% correspond respectively to clear major mergers, clear minor mergers, and ambiguous cases of ‘major or minor’ mergers.
At intermediate masses ( ) where we are only complete in mass for the blue cloud ( 2), we consider to be meaningful only for the intermediate mass blue cloud sample. Results for this sample are shown in the lower part of Table 2. The fraction of blue cloud galaxies having undergone recent mergers of mass ratio 1/10 ranges from 7% 2% to 15% 5% over 0.24–0.80. The corresponding merger rate ranges from to galaxies Gyr-1 Mpc-3 . For an assumed visibility time of 0.5 Gyr, we estimate that on average, over 3–7 Gyr, 84% of intermediate mass blue cloud galaxies have undergone a merger of mass ratio 1/10, with 5%, 22%, and 57% corresponding respectively to clear major mergers, clear minor mergers, and ambiguous cases of ‘major or minor’ mergers
4.4 Comparison with other studies
When comparing our observed merger fraction in the high mass ( ) sample over 0.24–0.80 with published studies, several caveats must be borne in mind. Many studies have small samples and large error bars at (e.g., Conselice 2003; Fig. 10). Others focus on bright galaxies and luminosity-selected samples (e.g., Lotz et al. 2008; Casatta et al. 2005 ) rather than stellar mass selected sample, because the data to derive stellar masses were unavailable. Different studies target different systems, ranging from morphologically distorted systems to close pairs with separation 5 to 40 kpc. Finally, many studies focus only on major mergers, while the interacting galaxies identified in our study are candidates for a merger of mass ratio 1/10 ( 3.2), and include both minor and major mergers. Nonetheless, we attempt approximate comparisons.
Fig. 10 shows the merger fraction based primarily on morphologically distorted galaxies (filled circles), as well as the close pair fraction (open squares), as a function of redshift. The Lotz et al. (2008) study shows the fraction of morphologically disturbed systems based on Gini-M20 parameters among -20.5 and 0.4 galaxies in the Extended Groth Strip. This study does not present any results for a high mass sample, and thus we effectively are comparing their bright galaxies to our high mass galaxies. Over 0.2–0.80, our results are in very good agreement, within a factor of less than two, with . The CAS-based results from Conselice (2003) are derived from a small sample in the Hubble Deep Field and have error bars that are too large to set useful constraints at (Fig. 10). Our results of a fairly flat evolution of the merger rate out to 0.8 also agree with the results of Cassata et al. (2005), which are based on both pairs and asymmetries.
Fig. 10 also shows the result from three studies based on close pairs. The major merger fraction of massive galaxies ( ) in close ( 30 kpc) pairs, based on the 2-point correlation function in COMBO-17, is 5% 1% averaged over at 0.4 0.8 (Bell et al. 2006). This value is lower than our merger fraction (), which represent likely mergers of mass ratio 1/10, and it is higher than the fraction of cases we see as clear major mergers (). The study of luminous ( 0.4 ) pairs at projected separations of 5–20 kpc in the COSMOS field (Kartaltepe et al. 2007) finds a galaxy pair fraction of 1%–3% over 0.24–0.80, corresponding to a galaxy merger fraction of 2%–6% . Our observed fraction of 9% 5 to 8% 2% over 0.24–0.8 is slightly higher and flatter than this study.
The differences we see through these comparisons are already known (see 1). Studies based on close pairs tend to show moderate to fairly strong evolution in the major merger rate out to 1.2 (e.g., Kartaltepe et al 2007; Bell et al 2006; Lin 2004), while studies based on asymmetries (e.g., Lotz et al. 2008; this study), and studies based on both pairs and asymmetries (Cassata et al. 2005) tend to report only mild evolution of the merger rate with redshift up to z 1.
It is not fully understood why these different methods yield different results, but several factors likely play a part. First, it should be noted that the claim of strong evolution in the close pair fraction out to 1.2 in the C0SMOS study by Kartaltepe et al. (2007) comes about when the low redshift 0 point from the SDSS pair catalog (Allam et al. 2004) is included in their analysis. The evolution within the internally consistent dataset from COSMOS over 0.15 to 1.05 shows much weaker evolution (Fig. 10). The drop in close pair fraction seems primarily to occur at , but it is unclear how reliable the low 0 points are due to the small volume sampled and systematic effects between studies. A further reason for the difference could be due to the fact that the methods used in these studies trace different phases of an interaction, with the pair method tracing the potential pre-merger phase, while the method based on the distorted galaxies trace the later phases, including the merger and post-merger phases.
Another point is that both pair and asymmetry methods are imperfect ways of tracing the merger fraction. Methods tracing morphologically disturbed galaxies may capture some fly-by tidal interactions rather than mergers, and this effect would cause the fraction of interacting galaxies to overestimate the merger fraction. However, this effect is not a dominant one due to the following reason: interaction signatures typically persist for a visibility timescale of 0.5 Gyr (), and a fly-by companion causing the distortion would still be within 100 kpc of the disturbed galaxy, assuming an escape speed of 200 km/s. The distorted galaxies we identify do not typically have such a fly-by companion, of mass ratio and similar spectrophotometric redshift. In studies based on close pairs, one source of uncertainty is that even pairs with members at the same redshift may not become gravitationally bound in the future. This effect might cause pairs to overestimate the true major merger fraction. On the other hand, erroneous spectrophotometric redshifts can cause us to either overestimate or underestimate the true close pair fraction, with the latter effect being more likely. Corrections for this effect are uncertain and depend on the shape of the spectrophotometric redshift errors (e.g., see Bell et al. 2006 for discussion).
4.5 Comparison of galaxy merger history with CDM models
We compare our empirical merger fraction (Fig. 11) and merger rate (Fig. 12) to predictions from different theoretical models of galaxy evolution in the context of a CDM cosmology, including the halo occupation distribution (HOD) models of Hopkins et al. (2007); semi-analytic models (SAMs) of Somerville et al. (2008), Bower et al. (2006), and Khochfar & Silk (2006); and the cosmological smoothed particle hydrodynamics (SPH) simulations from Maller et al. (2006). The models were provided to us directly by the authors or co-authors of these individual studies.
We first briefly describe the general problem of calculating galaxy merger rates. Predicting the rate of mergers per comoving volume and per unit time between isolated dark matter (DM) halos within a CDM model is relatively straightforward via semi-analytic methods or N-body simulations (e.g. Lacey & Cole 1993; Gottlöber et al. 2001; Fakhouri & Ma 2008; Neistein & Dekel 2008; D’Onghia et al. 2008). However, making a direct prediction of the galaxy merger rates is more complicated due to a number of factors, including the difference between the galaxy and halo merger timescales, tidal heating and stripping of halos and sub-halos, the effect of a dense core of baryons on merging satellites, and the non-linear relation at low mass between DM halo (or sub-halo) mass and galaxy mass (van den Bosch et al. 2007). Thus, attempts to extract a galaxy merger rate from CDM simulations also must attempt to model the relationship between dark matter and galaxy properties. The three main methods for making this connection are HOD models, SAMs, and hydrodynamic simulations. We summarize below how these three types of models differ.
HOD models specify the probability that a DM halo of a given mass harbors galaxies above a given mass or luminosity. The parameters of this function are determined by requiring that statistical observed quantities, such as galaxy mass or luminosity functions and galaxy correlation functions, be reproduced. The merger rate of galaxies within their host halos is calculated via standard or improved dynamical friction formulae. In the HOD models of Hopkins et al. (2007) used here, different modified formulae can be used, which include the effect of a gravitational capture cross section, stripping of DM halos, and calibration factors from -body simulations. The predicted model rate can vary by a factor of two depending on model assumptions for sub-halo structure and mass functions, the halo occupation statistics, and the dynamical friction formulae used.
In SAMS, merger trees of DM halos are either extracted from cosmological N-body simulations or derived using analytic methods (e.g., Somerville & Kolatt 1999). Calibrated modified versions of the Chandrasekhar dynamical friction approximation (e.g. Boylan-Kolchin et al. 2008) are used to compute the galaxy merger rate. Simplified analytic formulae are used to model the cooling of gas, star formation, supernova feedback, and more recently, AGN feedback (e.g., Somerville et al. 2008; Bower et al. 2006; Croton et al. 2006; Benson et al. 2005; Cole et al. 2000; Somerville & Primack 1999). The free parameters in these formulae are normalized to reproduce observations of nearby galaxies, such as the galaxy mass or luminosity function. Fig. 12 shows results of three independent SAMs from Khochfar & Silk (2006), Bower et al. (2006), and Somerville et al. (2008).
Cosmological hydrodynamic simulations attempt to model the detailed physics of gas hydrodynamics and cooling as well as gravity by explicitly solving the relevant equations for particles or grid cells. SPH methods are most commonly used. SF and supernova feedback are treated using empirical recipes. A drawback of this approach is that, due to computational limitations, state-of-the-art simulations still do not have the dynamic range to resolve the internal structure of galaxies while simultaneously treating representative cosmological volumes. Another well known problem is that cosmological SPH models, which do not include some kind of suppression of cooling (e.g., due to AGN feedback) in massive halos do not reproduce the observed number density of galaxies on the mass scales of interest (few ). Thus, the simulations of Maller et al. (2006) shown here, over-predict the number of high and low mass galaxies, while galaxies at the bend of the Schechter mass function are a factor of 2 to 3 too massive. In order to make the simulated mass function agree better with observations, Maller et al. (2006) apply a correction factor of 2.75 for galaxies in the mass range / . This correction is already included in the model on Fig. 12.
When comparing the observations to the models, one must consider carefully how merger rates and fractions are determined in these simulations. Two approaches are used: one based on simulation snapshots and the other based on a light cone. In the first approach, simulation outputs (“snapshots”) are stored at a sequence of redshifts. Two snapshots separated by a time are considered and modelers trace the merger history of galaxies whose final stellar mass is greater or equal to a given mass cut . The same mass cut () used in the data is applied to the simulations. In order to mimick the observations as closely as possible, the interval in the model should ideally be equal to the visibility timescale 333If is larger than , a correction factor of order (/) needs to be applied to the model merger fraction . One then counts the number of model galaxies with , which have experienced a merger of mass ratio within the last . It is important to note two points. Firstly, if a galaxy were to undergo multiple mergers within a time , these mergers would be counted only once in the model term , analogous to the case of the data where one cannot discriminate between multiple mergers within the time over which a galaxy appears distorted due to a merger. Secondly, the fact that is so short makes it very unlikely for a model galaxy to undergo more than one merger over this timescale. As a result the model term is essentially tracing the number of mergers within the last . One can then determine the merger rate using = , where is the comoving volume of the simulation box. The merger fraction is = , where is the total number of galaxies above the relevant mass limit. Except for Somerville et al. (2008), all the models presented on Fig. 11 and Fig.12 derive the merger fraction and rate using the above approach, based on simulation snapshots.
For the Somerville et al. (2008) models, the simulation analysis was carried out in a way that is closer to the observations. We construct a light cone with a geometry that is equivalent to three GEMS fields (2700 arcmin2 from ). We then divide the galaxies into redshift bins, exactly as in the observational analysis, and we count the number of galaxies that have had a merger within a time in the past. These galaxies appear as morphologically distorted mergers in the observations. The model merger fraction is , where is the total number of galaxies above the relevant mass limit in this light cone or redshfit bin. The model merger rate is calculated exactly as in the data using , where is the comoving number density of galaxies above a certain mass limit in the redshift bin. Note that and are quite sensitive to , while is independent of .
In Fig. 11, we compare the empirical merger fraction to the corresponding model predictions and . The comparison between the empirical merger rate (equation (3) in 4.3) and the model predictions and is in Fig. 12. In both data and models, major and minor mergers are defined as those with mass ratio ( 1/4), and (1/10 1/4), respectively. The only slight exception is in the case of Maller et al (2006) model where the extracted major mergers were defined with a slightly lower mass cutoff ( 1/3). The dotted lines on Fig. 11 and Fig. 12 show the major merger rate for all the models. The solid line show the (major+minor) merger rate, in other words, the rate of mergers with mass ratio ( 1/10). This is shown for all models except the Maller et al (2006) SPH simulations, where the limited dynamic range of the current simulations only allows predictions for major mergers. The solid line can be directly compared to our empirical merger fraction or rate , since the latter refer to mergers of mass ratio 1/10.
We find qualitative agreement between the observations and models, such that the (major+minor) merger fraction (Fig. 11) and merger rate (Fig. 12) from different models (solid lines) bracket the corresponding empirical estimates (stars) and show a factor of five dispersion. One can now anticipate that in the near future, improvements in both the observational estimates and model predictions will start to rule out certain merger scenarios and refine our understanding of the merger history of galaxies.
4.6 The impact of galaxy mergers on the average SFR over the last 7 Gyr
Both observations (e.g., Larson & Tinsley 1978; Joseph & Wright 1985; Kennicutt et al. 1987; Barton et al 2003) and simulations (e.g., Negroponte & White 1983; Hernquist 1989; Barnes & Hernquist 1991, 1996; Mihos & Hernquist 1994, 1996; Springel, Di Matteo & Hernquist 2005b) suggest that galaxy interactions and mergers trigger star formation. However, simulations cannot uniquely predict the factor by which mergers enhance the SF activity of galaxies over the last 7 Gyr, since the star formation rate in simulations is highly sensitive to the stellar feedback model, the bulge-to-disk () ratio, the gas mass fractions, and orbital geometry (e.g., Cox et al 2006; di Matteo et al. 2007). Thus, we explore here the impact of interactions on the average UV-based and UV+IR-based SFR of intermediate-to-high mass ( ) galaxies over 0.24–0.80.
We adopt the SFRs in Bell et al. (2005, 2007), based on COMBO-17 UV data (Wolf et al. 2004) and deep Spitzer 24 m observations with a limiting flux of 83 Jy () from the Spitzer Guaranteed Time Observers (Papovich et al. 2004; Gordon et al. 2005). The unobscured SFR based on the directly observable UV light from young stars was computed using SFRUV = (2.2 ), where = 1.5 is a rough estimate of the total integrated 1216–3000 Å UV luminosity, derived using the 2800 Å rest-frame luminosity from COMBO-17 . The factor of 1.5 used in converting the 2800 Å luminosity to total UV luminosity accounts for the UV spectral shape of a 100 Myr-old population with constant SFR. The factor of 2.2 corrects for the light emitted longward of 3000 Å and shortward of 1216 Å. The SFR calibration is derived from Pégase assuming a 100 Myr old stellar population with constant SFR and a Chabrier (2003) IMF.
The obscured SFR can be calculated from dust-reprocessed IR emission using the expression SFRIR = , where is the total IR luminosity (TIR) over 8–1000 m (Bell et al. 2007). is constructed from the observed 24 m flux (corresponding to rest-frame wavelengths of 19–13 m over 0.24–0.80) using the method outlined in Papovich & Bell (2002), based on an average Sbc template from the Devriendt et al. (1999) SED library. In converting from to SFRIR, Bell et al. (2007) assume that the bulk of the 24 m emission comes from SF, and not from AGN activity, based on the statistical result that less than 15% of the total 24 m emission at 1 is in X-ray luminous AGN (e.g., Silva et al. 2004; Bell et al. 2005; Franceschini et al. 2005; Brand et al. 2006). Uncertainties in these SFR estimates are no less than a factor of 2 for individual galaxies while the systematic uncertainty in the overall SFR scale is likely to be less than a factor of 2 (Bell et al. 2007).
We investigate the star formation properties of the sample S1 of 789 high mass ( ) and the sample S2 of 3698 intermediate mass ( ) galaxies. As described in 2, the high mass sample S1 is complete for both the red sequence and blue cloud, while the intermediate mass sample S2 is only complete for the blue cloud and suffers from incompleteness on the red sequence in the highest redshift bins. However, since most of the SFR density originates from the blue cloud, this incompleteness does not have any major impact on the results. Fig. 13 shows the UV-based SFR plotted versus the stellar mass in each redshift bin. The UV-based SFR ranges from 0.01 to 25 yr-1, with most galaxies having a rate below 5 yr-1.
While it is desirable to use the Spitzer 24 m data in order to account for obscured star formation, only 24% ( 878 galaxies) of the 3698 galaxies in our intermediate mass sample have a Spitzer 24 m detection, although over 86% of the sample is covered by the Spitzer observations down to a limiting flux of 83 Jy. The detected galaxies yield a median ratio of (SFRIR/SFRUV) of 3.6, indicative of a sustantial amount of obscured star formation. Three of the interacting galaxies in the first redshift bin had anomalously high SFRUV+IR ( 41, 18, and 15 yr-1). Two of these turned to have infrared spectra consistent with an AGN and were removed before computing the IR-based SF properties shown in Fig. 14 to Fig. 21.
The average UV-based SFR (based on 3698 galaxies) and UV+IR-based SFR (based on only the 876 galaxies with 24um detections) are plotted in the top 2 panels of Fig. 14 for three groups of intermediate mass galaxies: mergers, non-Interacting E-Sd, and non-Interacting Irr1. The corresponding plot for the high mass sample is in Fig. 15. It can be seen (Fig. 14 and Fig. 15) that over 0.24–0.80, the average UV-based and UV+IR-based SFR of mergers (in the phase where they are recognizable as mergers) are only modestly enhanced, at best by a factor of a few, compared to the non-interacting galaxies. This result applies to both high mass ( ) galaxies and intermediate mass ( ) blue cloud galaxies. A similar result is also found by Robaina et al. (in preparation) in high mass systems. This modest enhancement is consistent with the recent statistical study of di Matteo et al. (2007), who find from numerical simulations of several hundred galaxy collisions that the maximum SFR in galaxy mergers is typically only a factor of 2-3 larger than that of corresponding non-interacting galaxies. Their results suggest that the results of some early simulations (e.g., Mihos & Hernquist 1996; Hernquist & Mihos 1995), where mergers converted 50 to 80 per cent of their original gas mass into stars, may not represent the typical situation at .
In order to further test the robustness of our result, we used the stacking procedure described in Zheng et al. (2006) to get a more representative measure of the IR-based SFR for the following three groups of intermediate mass systems: mergers, non-interacting E-Sd, and non-interacting Irr1 galaxies. For every group, the individual galaxies were cross-correlated with the Spitzer 24 m catalog in order to identify detected and undetected objects. Then the PSF-removed 24 m images for the undetected objects were stacked, and a mean flux was derived from the average/median stacked image. An average 24um luminosity was determined from the individually-detected fluxes and individually-undetected fluxes estimated by stacking. The 3215 intermediate mass galaxies in the Spitzer field were used in this process, giving a more representative 24um luminosity than the mere 878 galaxies with detections. A final uncertainty can be obtained by combining background error and bootstrap error in quadrature. The IR-based SFR was estimated from the 24um luminosity using the procedure described above, and combined with the UV-based SFR to estimate the total SFR. The average UV+IR-stacked SFR is plotted in the bottom panel of Fig. 14 and Fig. 15: again, only a modest enhancement is seen in the average SFR of mergers (in the phase where they are recognizable as mergers), compared to non-interacting galaxies.
4.7 The contribution of interacting galaxies to the cosmic SFR density over the last 7 Gyr
Over the last 8 Gyr since 1, the cosmic SFR density is observed to decline by a factor of 4 to 10 (e.g., Lilly et al. 1996; Ellis et al 1996; Flores et al. 1999; Haarsma et al. 2000; Hopkins 2004; Pérez-González et al. 2005; Le Floc’h et al. 2005). Earlier GEMS studies by Wolf et al. (2005) and Bell et al. (2005) over a 0.6 Gyr interval ( 0.65–0.75 or 6.2–6.8 Gyr) showed that the UV and IR luminosity density over this interval are dominated by non-interacting galaxies. Here, we extend the earlier GEMS studies to cover a six-fold larger time interval of 4 Gyr ( 0.24–0.80 or 3–7 Gyr), and set quantitative limits on the contribution of merging systems to the UV-based and UV+IR-based SFR density. We use the sample S2 of 3698 intermediate mass ( ) galaxies. Our study also complements the IR-based studies by Hammer et al. (2005; l95 galaxies at ) and Melbourne et al. (2005; 800 galaxies) in terms of sample size or/and SFR indicators.
Fig. 16 shows the SFR density for intermediate mass mergers, non-interacting E-Sd galaxies, and non-interacting Irr1 galaxies over 0.24–0.80. The top panel shows the UV-based SFR density from the full sample. The middle panel show the UV+IR-based SFR density from the 878 galaxies with individual 24um detections. Finally, the bottom panel shows the UV+IR-stacked SFR density determined via the stacking of 3215 galaxies with Spitzer coverage, as outlined in 4.6. In all three panels, one finds that interacting galaxies only account for a small fraction ( 30%) of the cosmic SFR density over 0.24–0.80, corresponding to lookback times of 3–7 Gyr (Fig. 16). The same results hold for the sample of high mass ( ) galaxies, as illustrated in Fig. 17.
Thus, our results suggest that the behavior of the cosmic SFR density over 0.24–0.80 is predominantly shaped by non-interacting galaxies. A similar result is found by Lotz et al. (2008). Our result is a direct consequence of the fact that the merger fraction (Table 2; 4.3), as well as the enhancement in the average SFR from interactions ( 4.6), are both modest. Our results agree remarkably well with models for the self-regulated growth of supermassive black holes in mergers involving gas-rich galaxies (Hopkins et al. 2006). These models predict that galaxy mergers contribute only 20% of the SFR density out to 1, and even out to 2.
It is legitimate to ask whether the results hold despite the uncertainties in identifying mergers. We first note that based on the tests of 4.1, we have already included a large fractional error term on to account for the binomial standard deviation, the dispersion between classifiers, and the effect of moderate bandpass shifting, and surface brightness dimming. Therefore, the results presented here already take into account at least some of these sources of uncertainties.
Another source of uncertainty might be that some of the galaxies, which we have classified as non-interacting Irr1 under the assumption that their small-scale asymmetries are likely caused by SF rather than interactions ( 3.3), may be borderline cases of mergers or interacting systems. However, it can be seen from Fig. 16, that even if we were to add the SFR density of all the non-interacting Irr1 galaxies to that of the mergers, the sum would still be significantly lower than the contribution of non-interacting E to Sd galaxies. Thus, the results would be largely unchanged.
Another test is to repeat the analyses using the CAS merger criterion ( 0.35 and ) to identify mergers. The limited recovery rate (50% to 73%) and large level of contamination impacting the CAS criterion ( 3.4) make it more difficult to interpret the SF properties of systems identified as mergers or non-interacting with CAS. For both the intermediate mass sample (Fig. 18) and the high mass sample (Fig. 19), the average SFR of CAS mergers is only modestly enhanced compared to CAS non-interacting galaxies, in agreement with the results from 4.6.
Furthermore, for the intermediate mass sample, Fig. 20 shows that CAS mergers contribute only 16% to 33% of the UV SFR density and 22% to 38% of the UV+IR SFR density. While the upper limits of these values are slightly higher than those based on the visual types, it is nonetheless reassuring that CAS non-interacting galaxies dominate the SFR density. Similar results hold for the sample of high mass ( ) galaxies, as illustrated in Fig. 21.
For intermediate mass ( ) galaxies, we find that the cosmic SFR density declines by a factor of 3 from 0.80 to 0.24 (lookback time 7 to 3 Gyr). Since non-interacting galaxies dominate the cosmic SFR density in every redshift bin, it follows that this decline is largely the result of a shutdown in the SF of non-interacting galaxies. The question of what drives this shutdown will be addressed in detail in a future paper, and is only considered briefly here. One possibility is the depletion of the internal cold gas supply of galaxies by star formation, or the reduction in the accretion rate of gas from cosmological filaments. Future facilities like ALMA will be instrumental in exploring this issue further. Another related possibility is that over time, most of the SFR is shifting to lower stellar masses. High mass systems are associated with a lower SSFR (Cowie et al. 1996; Brinchmann et al. 2004; Brinchmann & Ellis 2000; Fontana et al. 2003; Bauer et al. 2005; Zheng et al. 2007; Fig. 1 of Noeske et al. 2007a), consistent with the idea that they have experienced the bulk of their stellar mass growth at earlier epochs (). In staged SF models (Noeske et al. 2007b) the SF history of low mass systems is consistent with exponential SF models associated with a late onset and a long duration.
5 Summary and Conclusions
We have performed a comprehensive observational estimate of the galaxy merger fraction over 0.24–0.80 (lookback times of 3–7 Gyr), and explored the impact of mergers on the star formation of galaxies over this interval. Our study is based on ACS, COMBO-17, and Spitzer 24 m data from the GEMS survey. We use a large sample of 3600 ( ) galaxies and 790 high mass ( ) galaxies ( 2). We primarily identify mergers using a visual classification system, which is based on visual morphologies, spectrophotometric redshifts, and stellar masses ( 3.2 to 3.3), and identifies systems that show evidence of having experienced a merger of mass ratio 1/10 within the last visibility timescale. While many earlier studies focused only on major mergers (defined as mergers with 1/4), we also attempt to constrain the frequency of minor mergers (defined as mergers with 1/10 1/4), since they dominate the merger rates in CDM models. Below is a summary of our results:
-
1.
For the high mass ( ) sample of 790 galaxies, which is complete on both the blue cloud and red sequence, we find the following. The fraction of visually-classified systems that show evidence of a recent merger of mass ratio 1/10, does not show strong evolution over lookback times of 3–7 Gyr, and ranges from 9% 5% at 0.24–0.34, to 8% 2% at 0.60–0.80 (Table 1; Fig 4). These mergers are further subdivided into three categories: clear ‘major merger’, clear ‘minor merger’, and ambiguous ‘major or minor merger’ cases. The first two classes are used to set lower limits on the major and minor merger fraction. The lower limit on the major merger fraction, determined in this way, ranges from 1.1% to 3.5% over 0.24–0.80 (Table 1). The corresponding lower limit on the minor merger fraction ranges from 3.6% to 7.5%. This is the first, albeit approximate, empirical estimate of the frequency of minor mergers over the last 7 Gyr.
For an assumed visibility timescale of 0.5 Gyr, it follows that over 3–7 Gyr, 68% of high mass systems have undergone a merger of mass ratio 1/10, with 16%, 45%, and 7% of these corresponding respectively to major, minor, and ambiguous ‘major or minor’ mergers. The corresponding merger rate is a few galaxies Gyr-1 Mpc-3.
-
2.
At intermediate masses ( ), we are only complete in mass for the blue cloud. Among 2840 blue cloud galaxies of mass , the fraction of visually-classified systems that show evidence of a recent merger of mass ratio 1/10, ranges from 7% 2% to 15% 5% over 0.24–0.80 (Table 2).
For an assumed visibility time of 0.5 Gyr, we estimate that on average, over 3–7 Gyr, 84% of intermediate mass blue cloud galaxies have undergone a merger of mass ratio 1/10, with 5%, 22%, and 57% corresponding respectively to major, minor, and ambiguous ‘major or minor’ mergers. The corresponding merger rate ranges from to galaxies Gyr-1 Mpc-3 .
-
3.
We compare our visual mergers to those identified using the widely used CAS merger criterion ( 0.35 and ), based on CAS asymmetry and clumpiness parameters ( 4.2). The merger fraction based on the CAS merger criterion agrees within a factor of two with the visually based merger fraction for high mass ( ) galaxies. However, for intermediate mass ( ) galaxies, CAS can overestimate the merger fraction at 0.5 by a factor 3. In effect, over 0.24–0.80, 50% to 70% of the galaxies visually classified as mergers satisfy the CAS criterion, but the latter also picks up a dominant number of non-interacting dusty, star-forming galaxies (Fig. 7 and Fig. 8). These non-interacting systems make up as much as 45% to 80% of the systems picked up the CAS criterion. We thus conclude that the traditional CAS merger criterion is ill-suited for use on -band images at 0.5 where the rest frame wavelength falls below Å, particularly in the case of intermediate mass galaxies with significant SF, gas, and dust. Modified CAS criteria in the near-UV based on morphological k-corrections (Taylor et al. 2007) might alleviate this problem.
-
4.
We compare our empirical merger fraction and merger rate for high mass ( ) galaxies to predictions from different CDM-based simulations of galaxy evolution, including the halo occupation distribution (HOD) models of Hopkins et al. (2007); semi-analytic models (SAMs) of Somerville et al. (2008), Bower et al. (2006), and Khochfar & Silk (2006); and smoothed particle hydrodynamics (SPH) cosmological simulations from Maller et al. (2006) with a corrected stellar mass function (see 4.5). To our knowledge, such extensive comparisons have not been attempted to date, and are long overdue. We find qualitative agreement between the observations and models, such that the (major+minor) merger fraction (Fig. 11) and merger rate (Fig. 12) from different models bracket the corresponding empirical estimates and show a factor of five dispersion. One can now anticipate that in the near future, improvements in both the observational estimates and model predictions will start to rule out certain merger scenarios and refine our understanding of the merger history of galaxies.
-
5.
We explore the impact of galaxy mergers on the SF activity of galaxies since . In the sample of 789 high mass ( ) galaxies, as well as the sample of 3600 intermediate mass ( ) galaxies, we find that the average SFR of visibly merging galaxies is only modestly enhanced compared to non-interacting galaxies over 0.24–0.80 (Fig. 14). This result is found for SFRs based on UV, UV+IR, as well as UV+stacked-IR data. This modest enhancement is consistent with the empirical results of Robaina et al. (in preparation), and the recent statistical study of di Matteo et al. (2007) based on numerical simulations of several hundreds of galaxy collisions.
-
6.
Among both high mass and intermediate mass galaxies, our results of a modest merger fraction and a modest enhancement in the average SFR due to mergers, culminate in our finding that visibly merging systems only account for a small fraction ( 30%) of the cosmic SFR density over lookback times of 3–7 Gyr ( 0.24–0.80; Fig. 16 and Fig. 17). Our result complements that of Wolf et al. (2005) over a smaller lookback time interval of 6.2–6.8 Gyr. In effect, our result suggests that the behavior of the cosmic SFR density over the last 7 Gyr is predominantly shaped by non-interacting galaxies, rather than mergers and interacting galaxies. We suggest that our observed decline in the cosmic SFR density by a factor of 3 since 0.80 is largely the result of a shutdown in the SF of relatively non-interacting galaxies. This shutdown may be driven by the depletion of the internal cold gas supply of galaxies, the reduction in the accretion rate of gas from cosmological filaments, and the transition of SF activity to lower mass systems.
References
- Alexander et al. (2003) Alexander, D. M., et al. 2003, AJ, 126, 539
- Allam et al. (2004) Allam, S. S., Tucker, D. L., Smith, J. A., Lee, B. C., Annis, J., Lin, H., Karachentsev, I. D., & Laubscher, B. E. 2004, AJ, 127, 1883
- (3) Barazza, F. D., Jogee, S., & Marinova, I. 2008, ApJ, 675, 1194
- Barden et al. (2005) Barden, M., et al. 2005, ApJ, 635, 959
- Barden et al. (2008) Barden, M., Jahnke, K., Haumlußler, B. 2008, ApJS, 175, 105
- Barnes & Hernquist (1991) Barnes, J. E., & Hernquist, L. E. 1991, ApJL, 370, L65
- Barnes & Hernquist (1996) Barnes, J. E., & Hernquist, L. 1996, ApJ, 471, 115
- Barton Gillespie et al. (2003) Barton Gillespie, E., Geller, M. J., & Kenyon, S. J. 2003, ApJ, 582, 668
- Bauer et al. (2005) Bauer, A. E., Drory, N., Hill, G. J., & Feulner, G. 2005, ApJL, 621, L89
- Bell & de Jong (2001) Bell, E. F., & de Jong, R. S. 2001, ApJ, 550, 212
- Bell et al. (2004) Bell, E. F., et al. 2004,ApJL, 600, L11
- Bell et al. (2005) Bell, E. F., et al. 2005, ApJ, 625, 23
- Bell et al. (2006) Bell, E. F., Phleps, S., Somerville, R. S., Wolf, C., Borch, A., & Meisenheimer, K. 2006, ApJ, 652, 270
- Bell et al. (2007) Bell, E. F., Zheng, X. Z.,Papovich, C., Borch, A., Wolf, C.,& Meisenheimer, K. 2007, ApJ, 663, 834
- Benson et al. (2004) Benson, A. J., Lacey, C. G., Frenk, C. S., Baugh, C. M., & Cole, S. 2004, MNRAS, 351, 1215
- Benson et al. (2005) Benson, A. J., Kamionkowski, M., & Hassani, S. H. 2005, MNRAS, 357, 847
- Bershady et al. (2000) Bershady, M. A., Jangren, A., & Conselice, C. J. 2000, AJ, 119, 2645
- Binney & Merrifield (1998) Binney, J., & Merrifield, M. 1998, Galactic astronomy / James Binney and Michael Merrifield. Princeton, NJ : Princeton University Press, 1998. (Princeton series in astrophysics) QB857 .B522 1998 ($35.00),
- Binney& Tremaine (1987) Binney, J., & Tremaine, S. 1987, Princeton, NJ, Princeton University Press, 1987, 747 p.,
- Borch et al. (2006) Borch, A., et al. 2006, A&A, 453, 869
- Bower et al. (2006) Bower, R. G., Benson,A. J., Malbon, R., Helly, J. C., Frenk, C. S., Baugh, C. M., Cole, S., & Lacey, C. G. 2006, MNRAS, 370, 645
- Boylan-Kolchin et al. (2008) Boylan-Kolchin, M., Ma, C.-P., & Quataert, E. 2008, MNRAS, 383, 93
- Brand et al. (2006) Brand, K., et al. 2006,ApJ, 644, 143
- Brand et al. (2006) Brand, K., et al. 2006,ApJ, 641, 140
- Brinchmann et al. (2004) Brinchmann, J., Charlot, S., White, S. D. M., Tremonti, C., Kauffmann, G., Heckman, T., & Brinkmann, J. 2004, MNRAS, 351, 1151
- Brinchmann & Ellis (2000) Brinchmann, J., & Ellis, R. S. 2000, ApJL, 536, L77
- Cassata et al. (2005) Cassata, P., et al. 2005, MNRAS, 357, 903
- Caldwell et al. (2008) Caldwell, J. A. R., et al. 2008, ApJS, 174, 136
- Chabrier (2003) Chabrier, G. 2003, PASP, 115, 763
- Cole et al. (2000) Cole, S., Lacey, C. G.,Baugh, C. M., & Frenk, C. S. 2000, MNRAS, 319, 168
- Conselice et al. (2000) Conselice, C. J., Bershady, M. A., & Jangren, A. 2000, ApJ, 529, 886
- (32) Conselice, C. J. 2003, ApJS, 147, 1
- Conselice et al. (2003) Conselice, C. J., Bershady, M. A., Dickinson, M., & Papovich, C. 2003, AJ, 126, 1183
- Conselice et al. (2005) Conselice, C. J., Blackburne, J. A., & Papovich, C. 2005, ApJ, 620, 564
- Conselice (2006) Conselice, C. J. 2006, ApJ, 638, 686
- Conselice et al. (2008) Conselice, C. J., Rajgor, S., & Myers, R. 2008, MNRAS, 386, 909
- Cowie et al. (1996) Cowie, L. L., Songaila, A., Hu, E. M., & Cohen, J. G. 1996, AJ, 112, 839
- Cox et al. (2006) Cox, T. J., Jonsson, P., Primack, J. R., & Somerville, R. S. 2006, MNRAS, 373, 1013
- Croton et al. (2006) Croton, D. J., et al. 2006, MNRAS, 367, 864
- Croton et al. (2006) Croton, D. J., et al. 2006, MNRAS, 365, 11
- De Propris et al. (2007) de Propris, R., Conselice, C. J., Liske, J., Driver, S. P., Patton, D. R., Graham, A. W., & Allen, P. D. 2007, ApJ, 666, 212
- (42) de Ravel, L. et al. 2008, A&A, submitted (arXiv:0807.2578v1)
- Devriendt et al. (1999) Devriendt, J. E. G., Guiderdoni, B., & Sadat, R. 1999, A&A, 350, 381
- D’Onghia& Burkert (2004) D’Onghia, E., & Burkert, A. 2004, ApJL, 612, L13
- D’Onghia et al. (2008) D’Onghia, E., Mapelli, M., Moore, B. 2008, MNRAS, submitted (arXiv:0803.0545)
- Di Matteo et al. (2007) di Matteo, P., Combes, F., Melchior, A.-L., & Semelin, B. 2007, A&A, 468, 6
- Ellis et al. (1996) Ellis, R. S., Colless, M., Broadhurst, T., Heyl, J., & Glazebrook, K. 1996, MNRAS, 280, 235
- (48) Fakhouri, O, Ma, C.-P., 2008, MNRAS, 386, 577
- Flores et al. (1999) Flores, H., et al. 1999, ApJ, 517, 148
- Fontana et al. (2003) Fontana, A., et al. 2003, ApJL, 594, L9
- Fontana et al. (2003) Fontana, A., Poli, F., Menci, N., Nonino, M., Giallongo, E., Cristiani, S., & D’Odorico, S. 2003, ApJ, 587, 544
- Franceschini et al. (2005) Franceschini, A., et al. 2005, AJ, 129, 2074
- Gordon et al. (2005) Gordon, K. D., et al. 2005, PASP, 117, 503
- (54) Gottloeber, S., Klypin, A., Kravtsov, A. V. 2001, ApJ, 546, 223
- Governato et al. (2004) Governato, F., et al. 2004, ApJ, 607, 688
- Haarsma et al. (2000) Haarsma, D. B., Partridge, R. B., Windhorst, R. A., & Richards, E. A. 2000, ApJ, 544, 641
- Hammer et al. (2005) Hammer, F., Flores, H., Elbaz, D., Zheng, X. Z., Liang, Y. C., & Cesarsky, C. 2005, A&A, 430, 115
- Hernquist (1989) Hernquist, L. 1989, Nature, 340, 687
- Hernquist & Mihos (1995) Hernquist, L., & Mihos, J. C. 1995, ApJ, 448, 41
- (60) Hopkins, P. F., Somerville, R. S., Hernquist, L., Cox, T. J., Robertson, B., & Li, Y. 2006, ApJ, 652, 864
- Hopkins (2004) Hopkins, A. M. 2004, ApJ, 615, 209
- (62) Hopkins, P. F., et al. 2007, ApJ, submitted (arXiv:0706.1243)
- (63) Jogee, S., Kenney, J. D. P., & Smith, B. J. 1998, ApJL, 494, L185
- (64) Jogee, S., Kenney, J. D. P., & Smith, B. J. 1999, ApJ, 526, 665
- (65) Jogee, S., 1999, Ph.D. thesis, Yale University
- (66) Jogee, S., 2006, Lecture Notes in Physics, Vol. 693, ”AGN Physics on All Scales”, Eds. D. Alloin, R. Johnson, & P. Lira (Springer: Berlin Heidelberg New York), Vol 93, Chapter 6, p 143 (astro-ph/0408383).
- (67) Jogee, S. et al. 2008, in Formation and Evolution of Galaxy Disks, ed. J. G. Funes, S. J., & E. M. Corsini (San Francisco:ASP), in press (arXiv:0802.3901)
- Joseph & Wright (1985) Joseph, R. D., & Wright, G. S. 1985, MNRAS, 214, 87
- Kartaltepe et al. (2007) Kartaltepe, J. S., et al. 2007, ApJS, 172, 320
- Kauffmann et al. (1993) Kauffmann, G., White, S. D. M., & Guiderdoni, B. 1993, MNRAS, 264, 201
- Kautsch et al. (2006) Kautsch, S. J., Grebel, E. K., Barazza, F. D., & Gallagher, J. S., III 2006, A&A, 451, 1171
- Kennicutt et al. (1987) Kennicutt, R. C.,Jr., Roettiger, K. A., Keel, W. C., van der Hulst, J. M., & Hummel, E. 1987, AJ, 93, 1011
- Khochfar & Burkert (2001) Khochfar, S., & Burkert, A. 2001, ApJ, 561, 517
- Khochfar & Burkert (2005) Khochfar, S., & Burkert, A. 2005, MNRAS, 359, 1379
- Khochfar & Silk (2006) Khochfar, S., & Silk, J. 2006, MNRAS, 370, 902
- Koopmann & Kenney (1998) Koopmann, R. A., & Kenney, J. D. P. 1998, ApJL, 497, L75
- Kroupa (2001) Kroupa, P. 2001, MNRAS, 322, 231
- Kroupa et al. (1993) Kroupa, P., Tout, C. A., & Gilmore, G. 1993, MNRAS, 262, 545
- (79) Lacey, C., Cole, S. 1993, MNRAS, 262, 627
- Larson & Tinsley (1978) Larson, R. B., & Tinsley, B. M. 1978, ApJ, 219, 46
- Le Floc’h et al. (2005) Le Floc’h, E., et al. 2005, ApJ, 632, 169
- Le Fèvre et al. (2000) Le Fèvre, O., et al. 2000, MNRAS, 311, 565
- Lehmer et al. (2005) Lehmer, B. D., et al. 2005, ApJS, 161, 21
- Lilly et al. (1996) Lilly, S. J., Le Fevre, O., Hammer, F., & Crampton, D. 1996, ApJL, 460, L1
- Lin et al. (2004) Lin, L., et al. 2004, ApJL, 617, L9
- Lotz et al. (2004) Lotz, J. M., Primack, J., & Madau, P. 2004, AJ, 128, 163
- Lotz et al. (2008) Lotz, J. M., et al. 2008, ApJ, 672, 177
- Madau et al. (1996) Madau, P., Ferguson, H. C., Dickinson, M. E., Giavalisco, M., Steidel, C. C., & Fruchter, A. 1996, MNRAS, 283, 1388
- Madau et al. (1998) Madau, P., della Valle, M., & Panagia, N. 1998, MNRAS, 297, L17
- Maller et al. (2006) Maller, A. H., Katz, N., Kereš, D., Davé, R., & Weinberg, D. H. 2006, ApJ, 647, 763
- Melbourne et al. (2005) Melbourne, J., Koo, D. C., & Le Floc’h, E. 2005, ApJL, 632, L65
- Mihos et al. (1995) Mihos, J. C., Walker, I. R., Hernquist, L., Mendes de Oliveira, C., & Bolte, M. 1995, ApJL, 447, L87
- Mihos & Hernquist (1994) Mihos, J. C., & Hernquist, L. 1994, ApJ, 437, 611
- Mihos & Hernquist (1996) Mihos, J. C., & Hernquist, L. 1996, ApJ, 464, 641
- Miller et al. (2008) Miller, S. H., et al. 2008, ArXiv e-prints, 802, arXiv:0802.3917
- Murali et al. (2002) Murali, C., Katz, N., Hernquist, L., Weinberg, D. H., & Davé, R. 2002, ApJ, 571, 1
- Naab & Burkert (2001) Naab, T., & Burkert, A. 2001, ApJL, 555, L91
- Navarro& Benz (1991) Navarro, J. F., & Benz, W. 1991, ApJ, 380, 320
- Navarro & Steinmetz (2000) Navarro, J. F., & Steinmetz, M. 2000, ApJ, 538, 477
- Negroponte & White (1983) Negroponte, J., & White, S. D. M. 1983, MNRAS, 205, 1009
- (101) Neistein, E., Dekel, A., eprint arXiv:0802.0198
- Noeske et al. (2007a) Noeske, K. G., et al. 2007a, ApJL, 660, 43
- Noeske et al. (2007b) Noeske, K. G., et al. 2007b, ApJL, 660, L47
- Papovich & Bell (2002) Papovich, C., & Bell, E. F. 2002, ApJL, 579, L1
- Papovich et al. (2004) Papovich, C., et al. 2004, ApJS, 154, 70
- Patton et al. (2000) Patton, D. R., Carlberg, R. G., Marzke, R. O., Pritchet, C. J., da Costa, L. N., & Pellegrini, P. S. 2000, ApJ, 536, 153
- Patton et al. (2002) Patton, D. R., et al. 2002, ApJ, 565, 208
- Pérez-González et al. (2005) Pérez-González, P. G., et al. 2005, ApJ, 630, 8
- Rieke et al. (2004) Rieke, G. H., et al. 2004, ApJS, 154, 25
- Rix et al. (2004) Rix, H.-W., et al. 2004, ApJS, 152, 163
- Robertson et al. (2004) Robertson, B., Yoshida, N., Springel, V., & Hernquist, L. 2004, ApJ, 606, 32
- Smith (1994) Smith, B. J. 1994, AJ, 107, 1695
- Somerville& Primack (1999) Somerville, R. S., & Primack, J. R. 1999, MNRAS, 310, 1087
- Somerville & Kolatt (1999) Somerville, R. S. & Kolatt, T. S. 1999, MNRAS, 305, 1
- (115) Somerville, R. S., Hopkins, P. F., Cox, T. J., Robertson, B. E., & Hernquist, L. 2008, MNRAS, 391, 481
- Springel et al. (2005a) Springel, V., et al. 2005a, Nature, 435, 629
- Springel et al. (2005b) Springel, V., Di Matteo, T., & Hernquist, L. 2005b, MNRAS, 361, 776
- Struck (1997) Struck, C. 1997, ApJS, 113,269
- Taylor-Mager et al. (2007) Taylor-Mager, V. A., Conselice, C. J., Windhorst, R. A., & Jansen, R. A. 2007, ApJ, 659, 162
- (120) van den Bosch, F. C. et al., 2007, MNRAS, 376, 841
- (121) Weinzirl, T., Jogee, S., Khochfar, S., Burkert, A., & Kormendy, J. 2009, ApJ, accepted (arXiv:0807.0040)
- Wolf et al. (2004) Wolf, C., et al. 2004, A&A, 421, 913
- Wolf et al. (2005) Wolf, C., et al. 2005, ApJ, 630, 771
- (124) Zheng et al. 2006, ApJ, 640, 784
- Zheng et al. (2007) Zheng, X. Z., Bell, E. F., Papovich, C., Wolf, C., Meisenheimer, K., Rix, H.-W., Rieke, G. H., & Somerville, R. 2007, ApJL, 661, L41
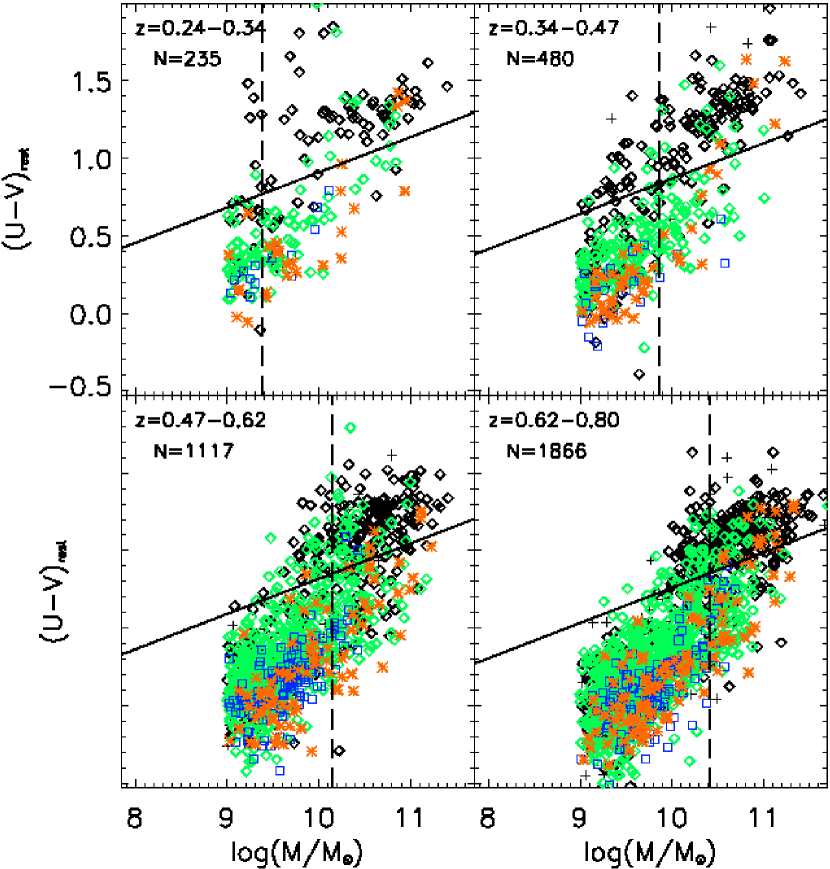
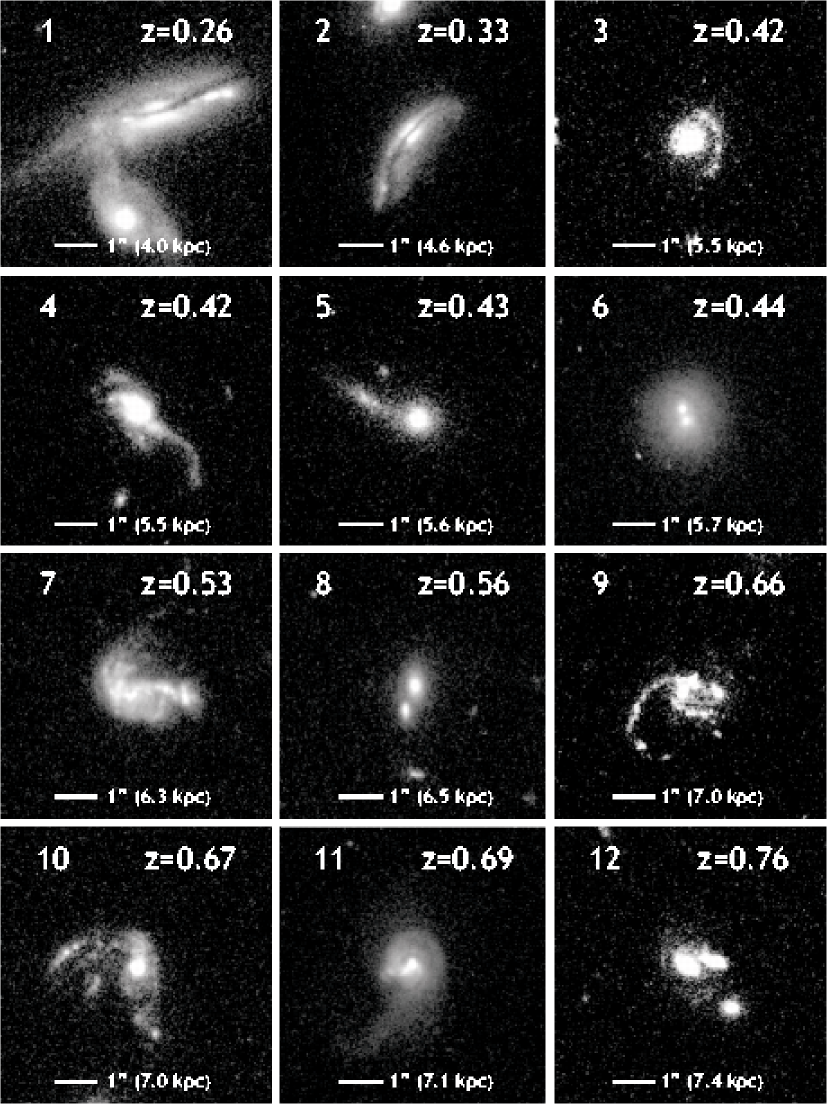
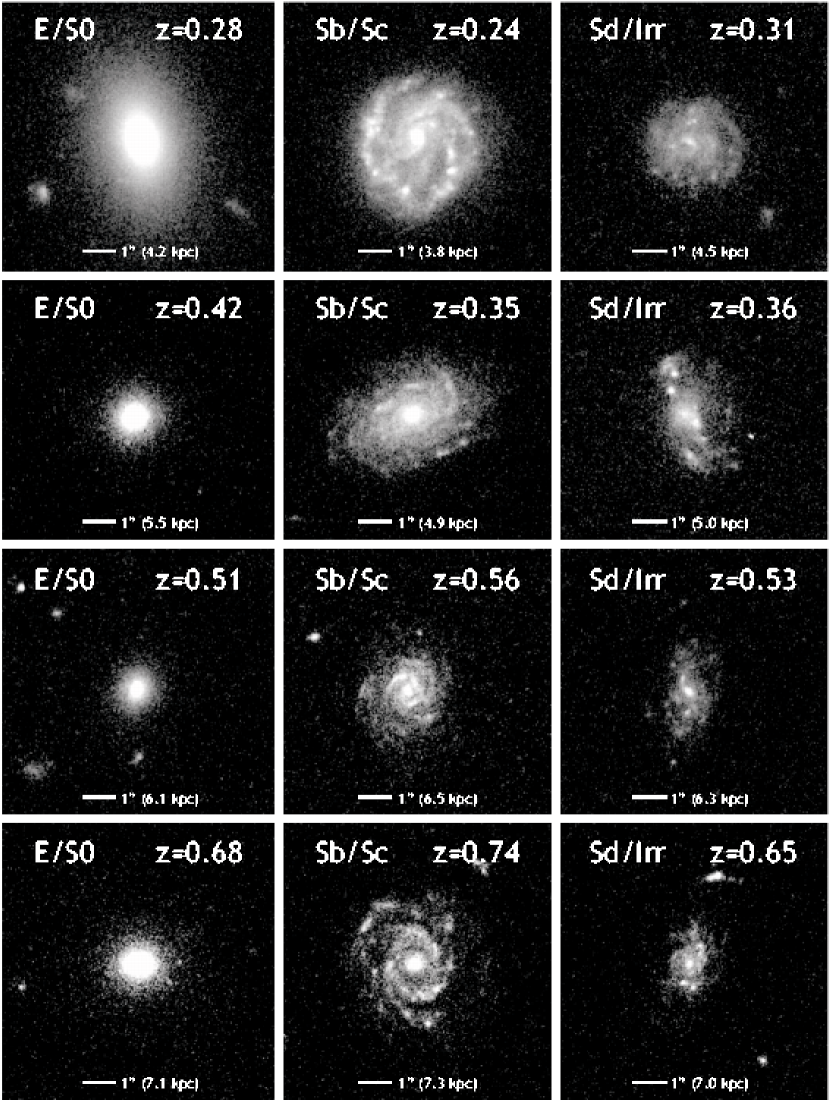
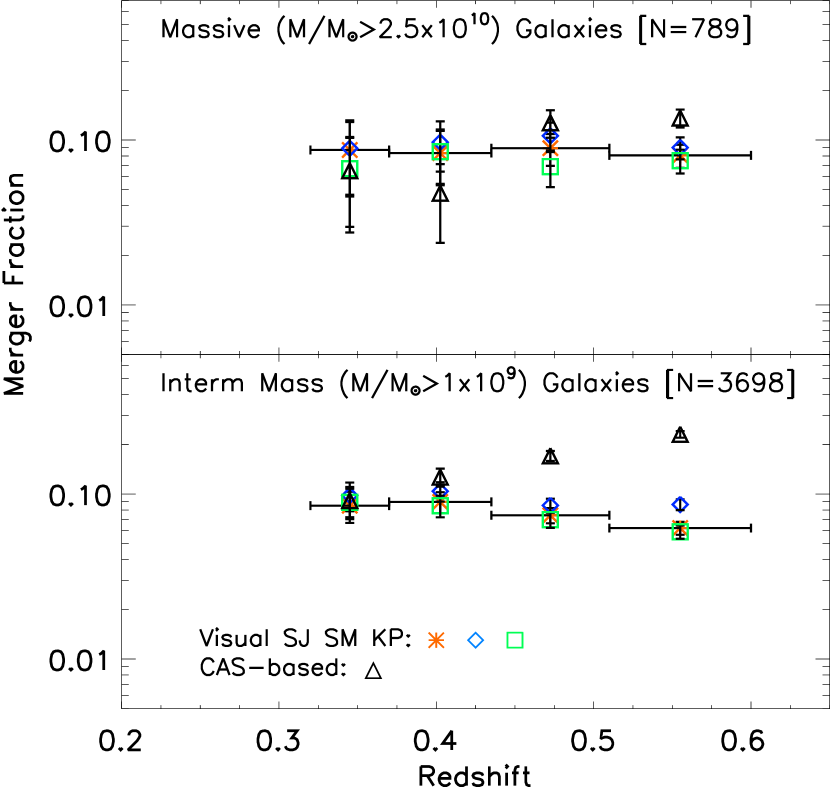
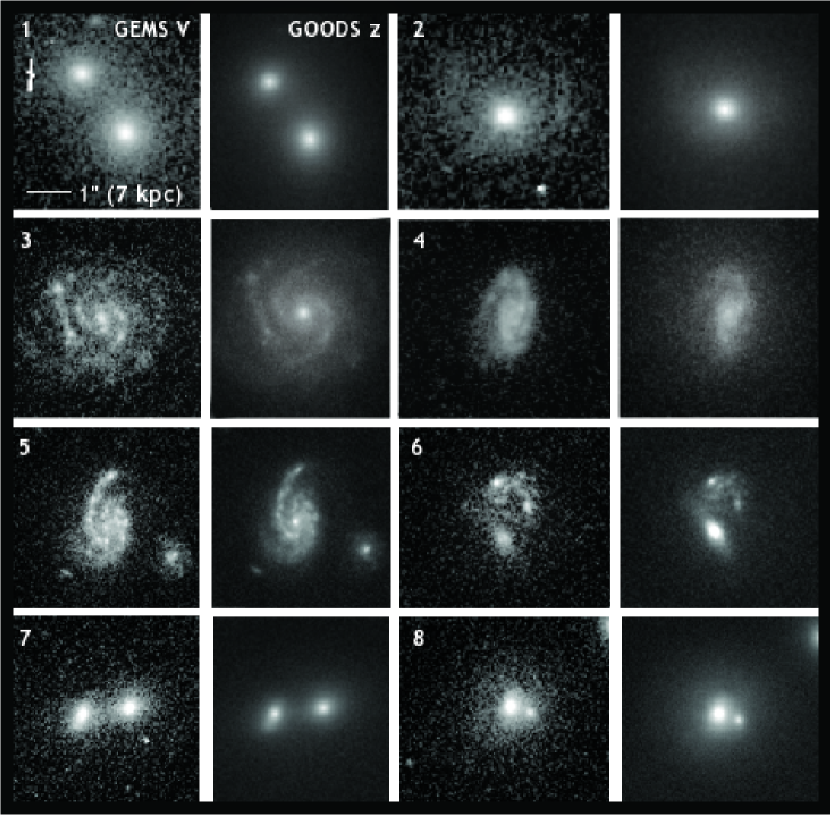
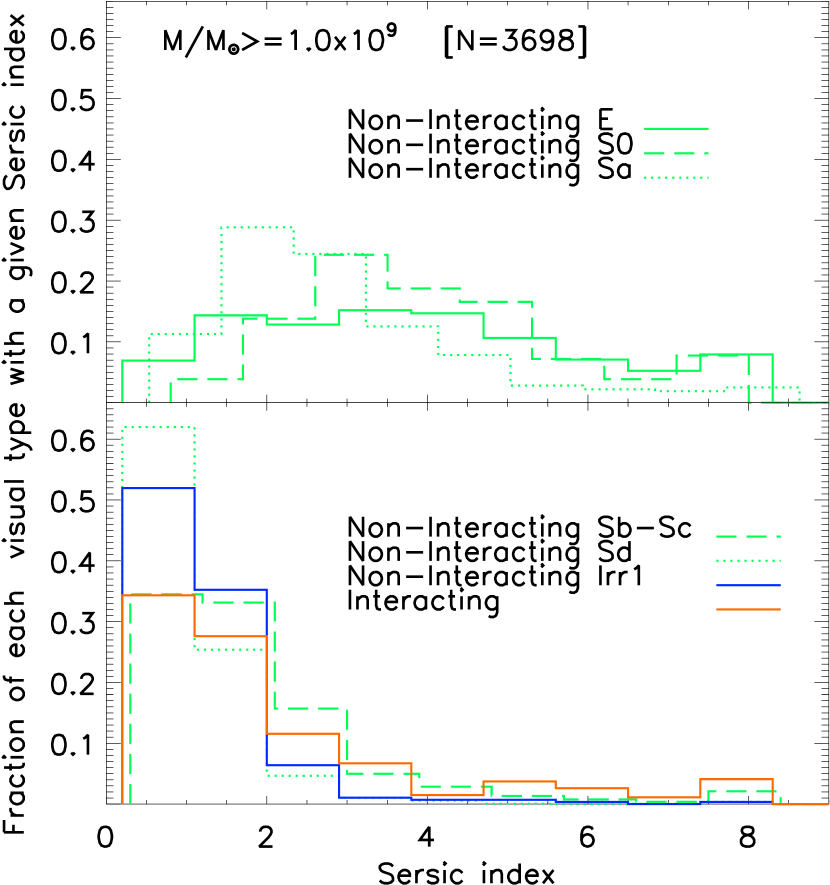
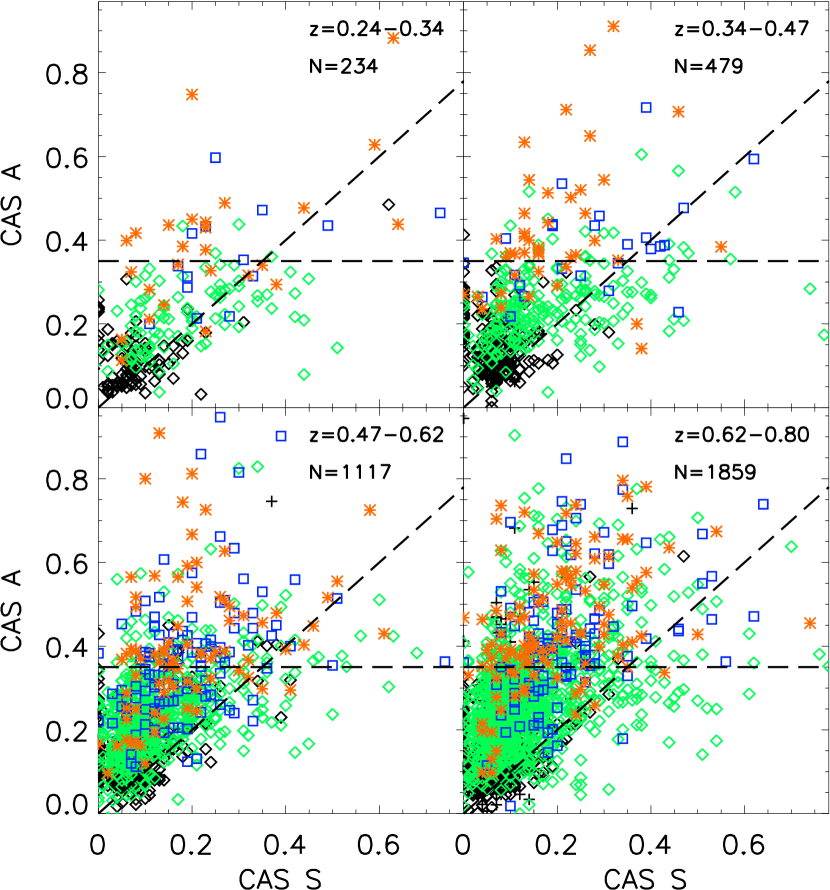
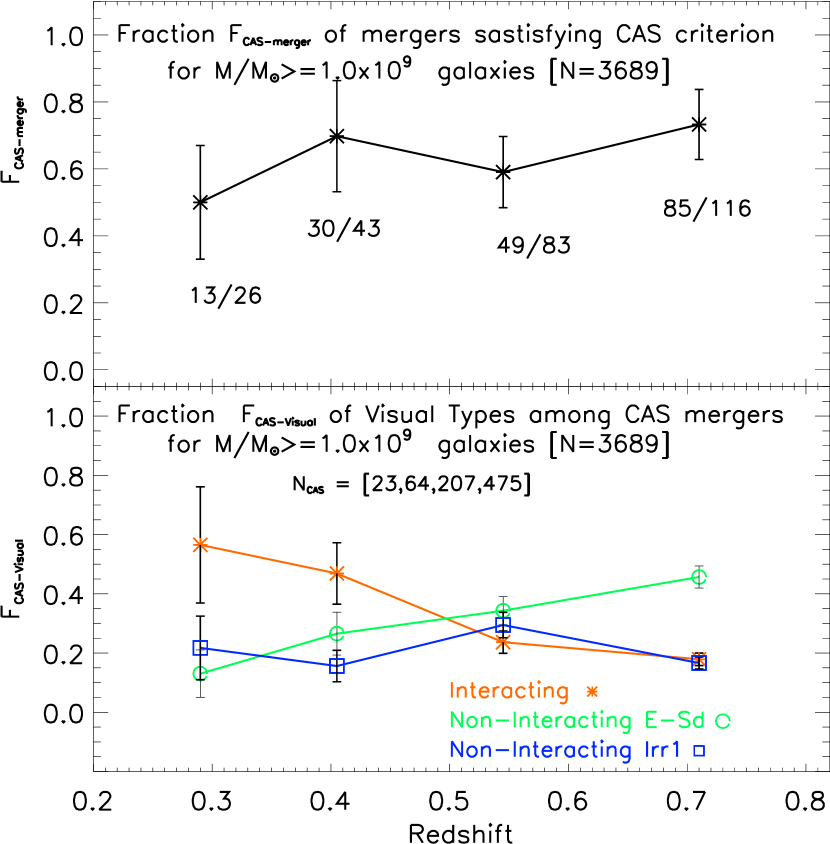

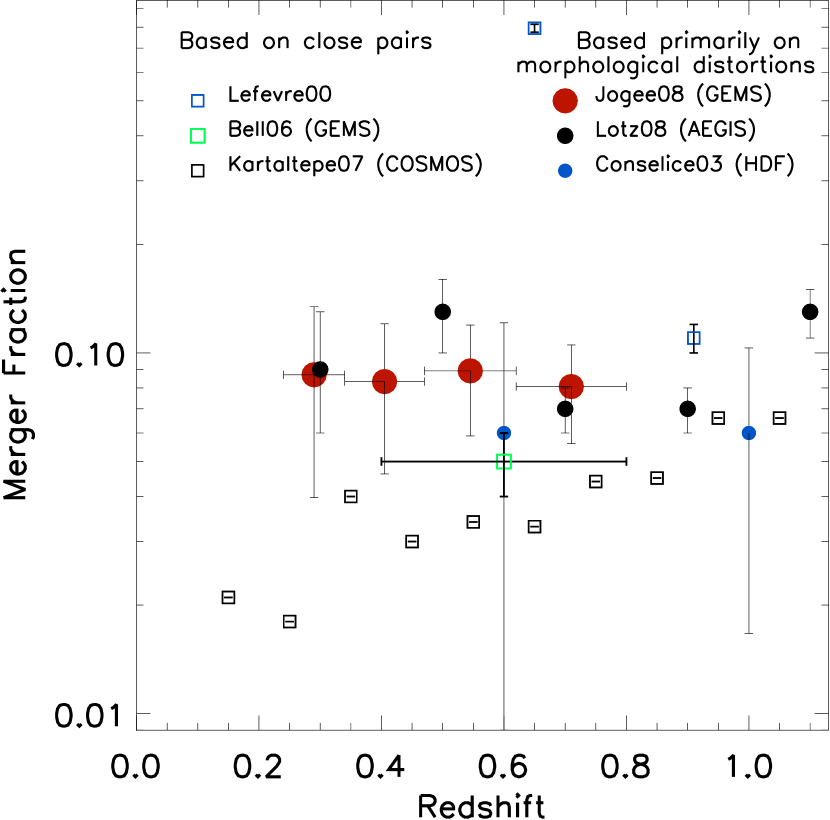
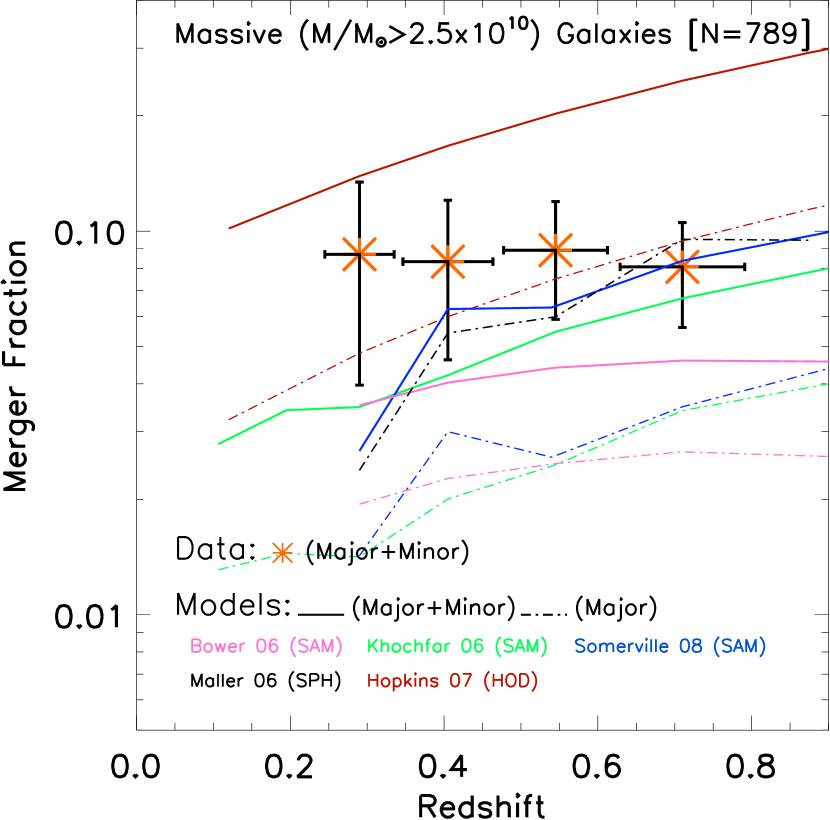

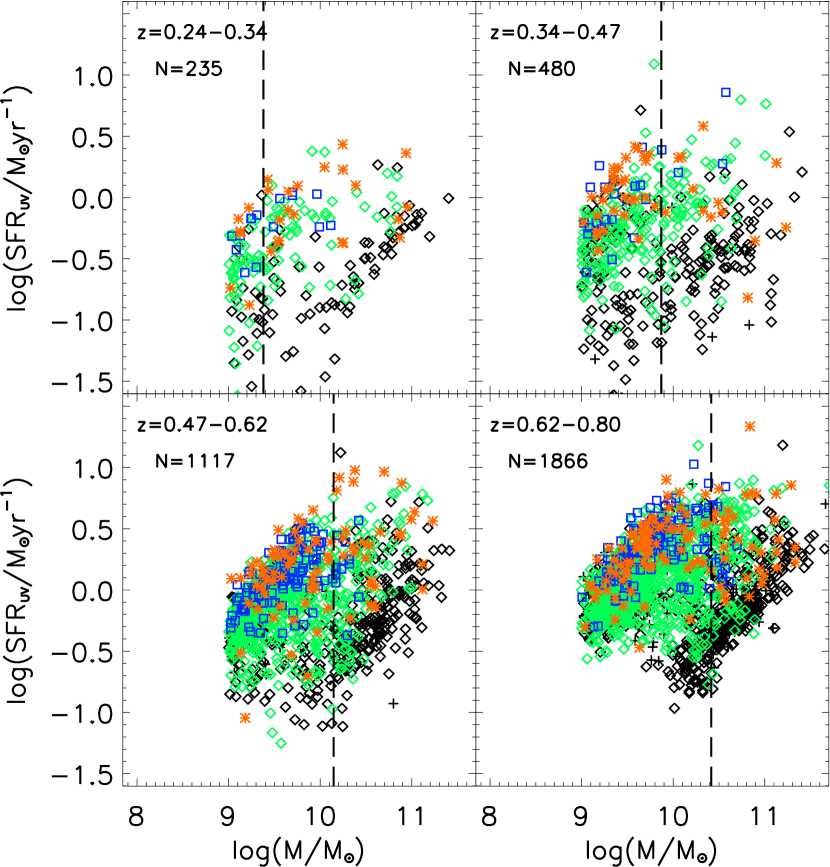
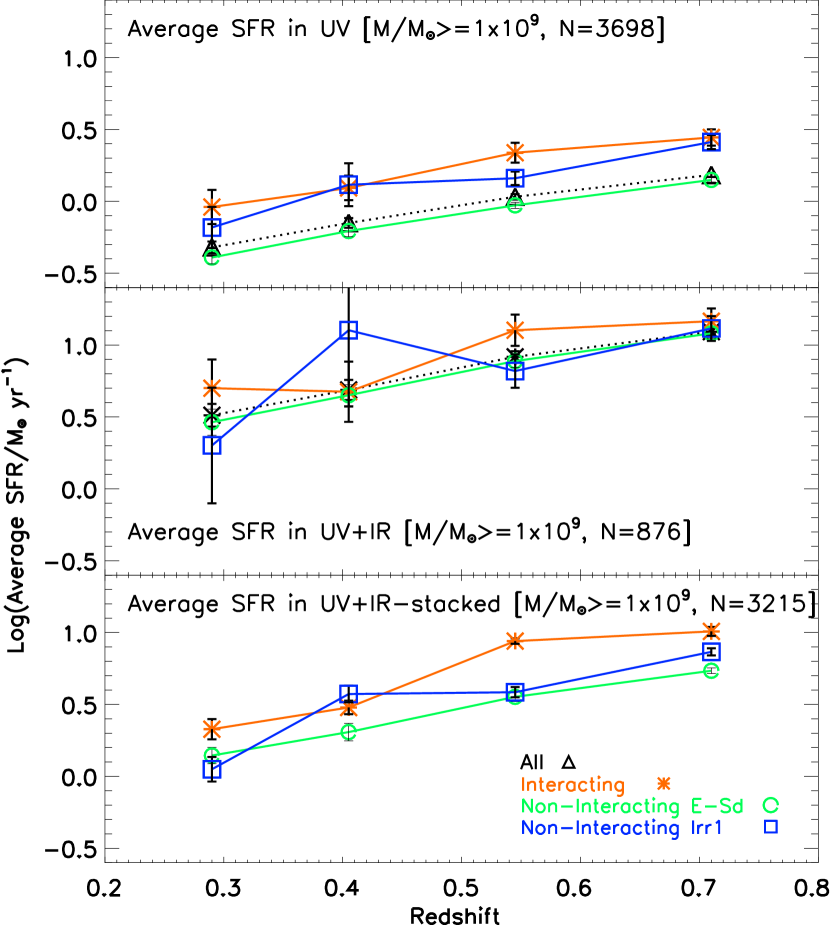
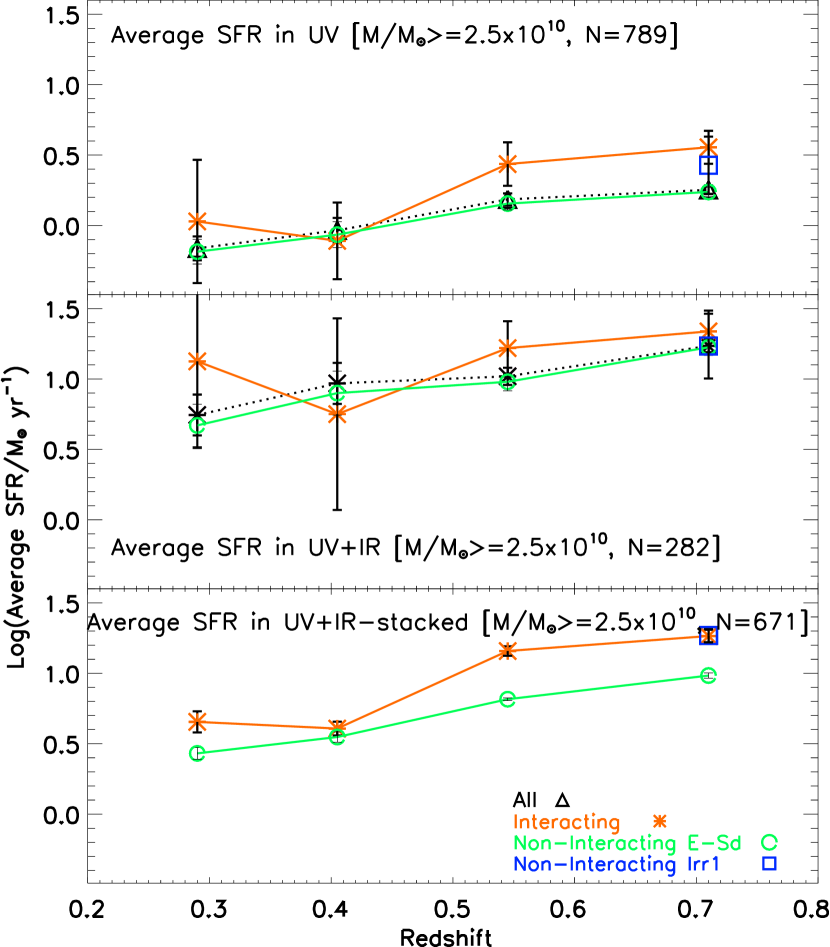
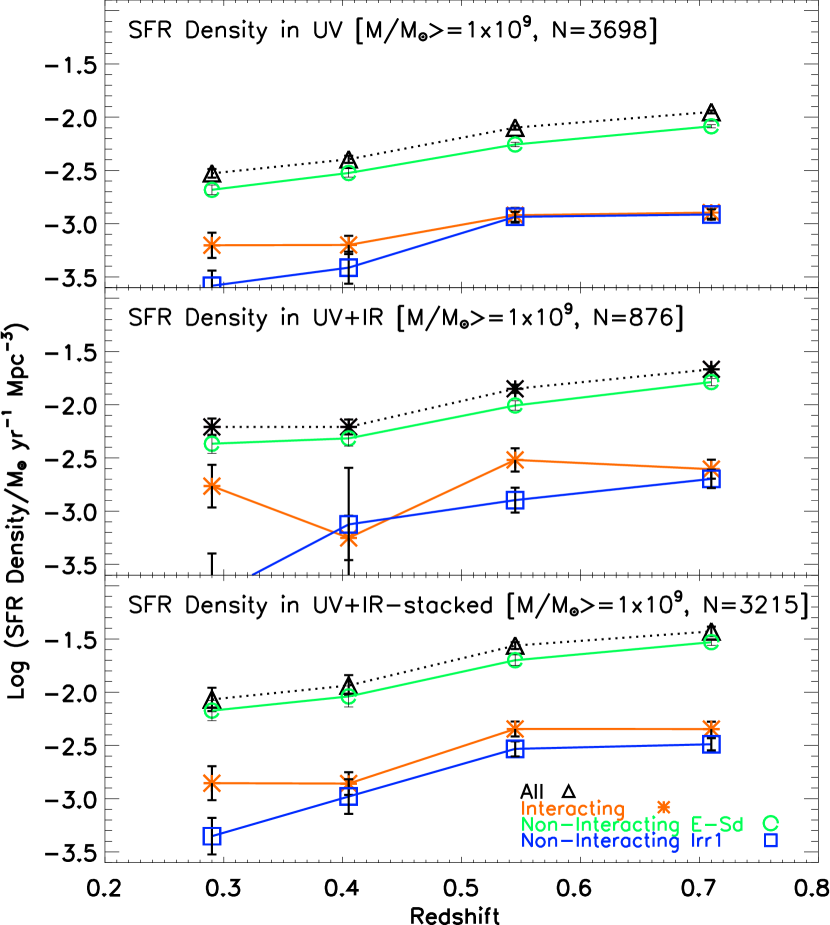
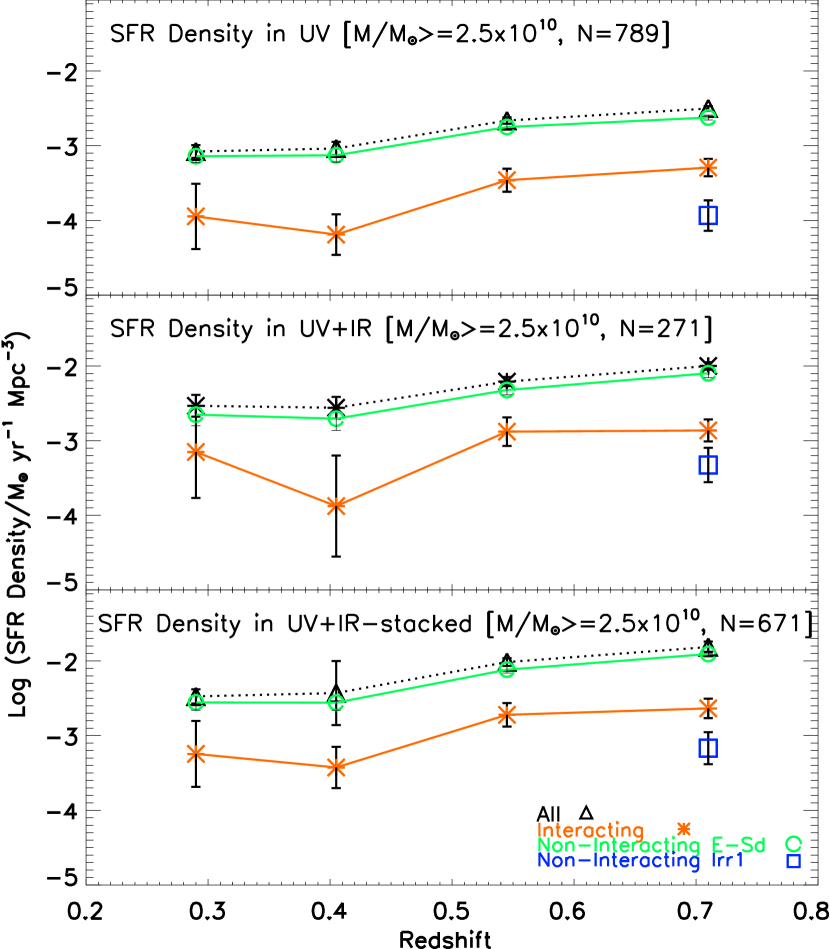
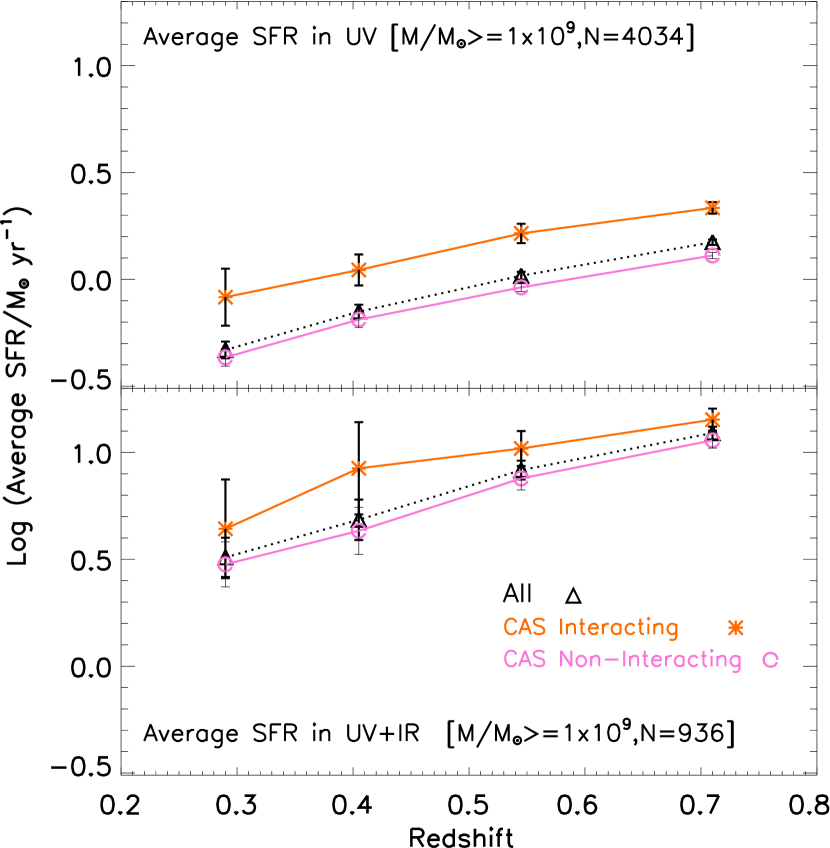
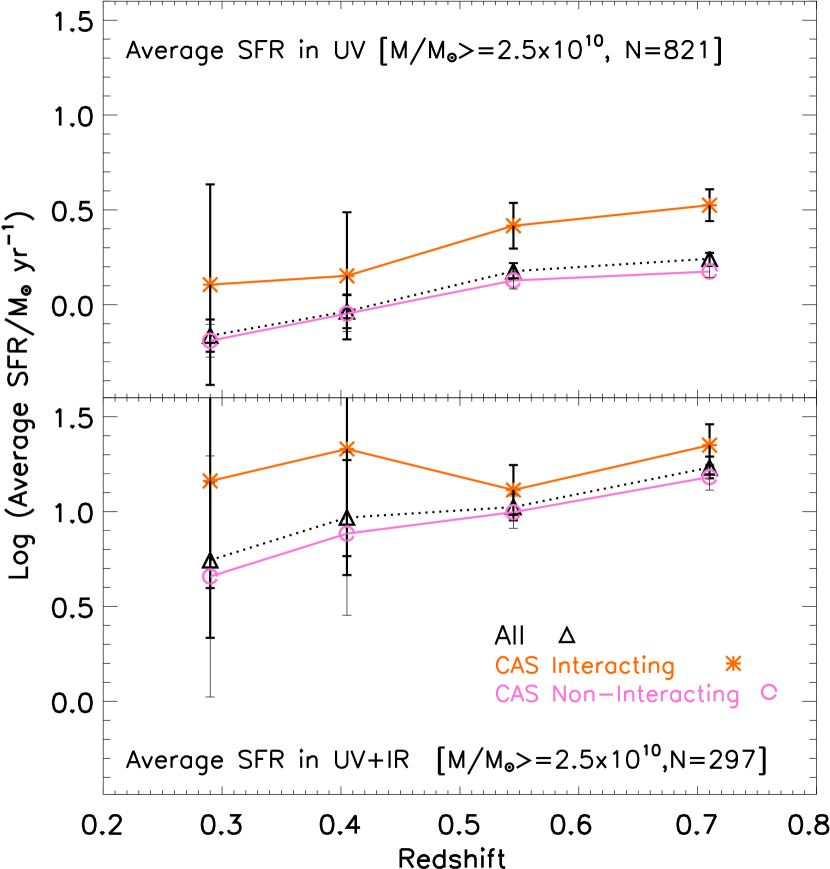
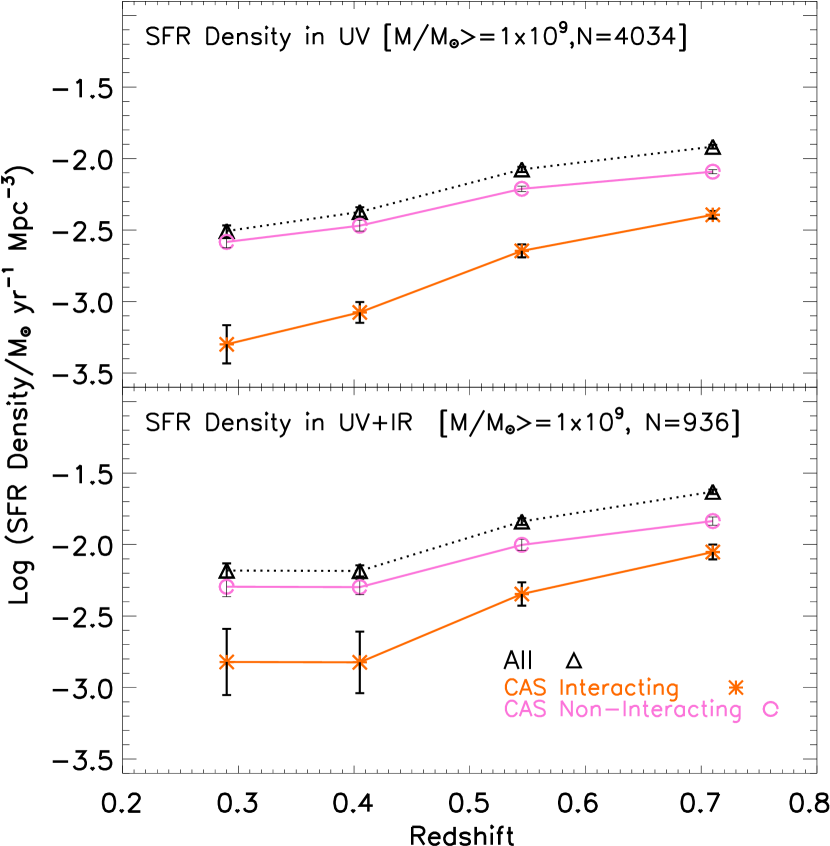
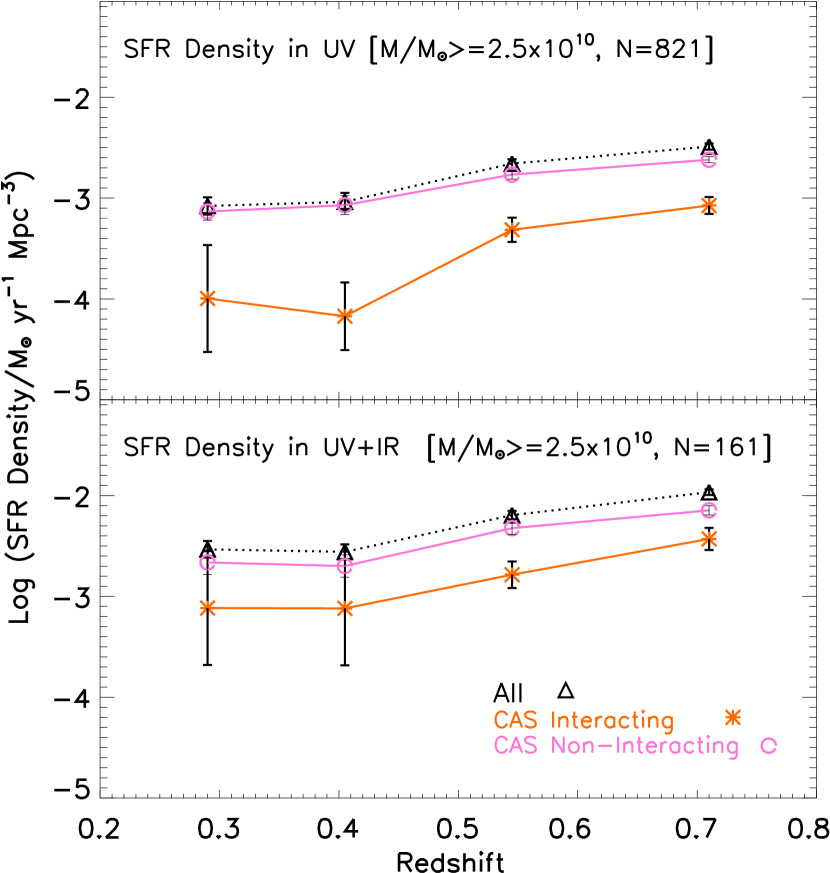
| (1) | Redshift bin | 1 | 2 | 3 | 4 |
|---|---|---|---|---|---|
| (2) | Redshift range | 0.24–0.34 | 0.34–0.47 | 0.47-0.62 | 0.62–0.80 |
| (3) | Lookback time [Gyr] | 3.0–4.0 | 4.0–5.0 | 5.0–.6-0 | 6.0–7.0 |
| (4) | rest in F606W [Å] | 4470–4414 | 4414–4023 | 4023–3651 | 3651–3286 |
| (5) | Total no of galaxies | 46 | 84 | 213 | 446 |
| (6) | Fraction of mergers | 0.0870.047 | 0.0830.037 | 0.0890.030 | 0.08070.025 |
| (6a) | Lower limit on major merger fraction | 0.0220.021 | 0.0350.022 | 0.0140.009 | 0.0110.006 |
| (6b) | Lower limit on minor merger fraction | 0.0650.040 | 0.0360.022 | 0.0750.027 | 0.0490.016 |
| (6c) | Fraction of ambiguous minor/major mergers | 0.00 | 0.012 | 0.00 | 0.0200.008 |
| (7) | Fraction of non-interacting E-Sd | 0.913 0.241 | 0.8690.229 | 0.8780.229 | 0.7850.205 |
| (8) | Fraction of non-interacting Irr1 | 0.000 | 0.0240.018 | 0.0090.007 | 0.0250.010 |
| (9) | Fraction of compact | 0.000 | 0.0240.018 | 0.0230.012 | 0.110.032 |
| (1) | Redshift bin | 1 | 2 | 3 | 4 |
|---|---|---|---|---|---|
| (2) | Redshift range | 0.24–0.34 | 0.34–0.47 | 0.47-0.62 | 0.62–0.80 |
| (3) | Lookback time [Gyr] | 3.0–4.0 | 4.0–5.0 | 5.0–.6-0 | 6.0–7.0 |
| (4) | rest in F606W [Å] | 4470–4414 | 4414–4023 | 4023–3651 | 3651–3286 |
| All [N=3698] | |||||
| (5) | Total no of galaxies | 235 | 480 | 1117 | 1866 |
| (6) | Fraction of mergers | 0.1110.035 | 0.0900.027 | 0.0740.021 | 0.0620.017 |
| (6a) | Lower limit on major merger fraction | 0.0130.008 | 0.0060.004 | 0.0040.002 | 0.0090.003 |
| (6b) | Lower limit on minor merger fraction | 0.0380.016 | 0.0210.008 | 0.0210.007 | 0.0170.005 |
| (6c) | Fraction of ambiguous minor/major mergers | 0.0600.022 | 0.0620.020 | 0.0480.014 | 0.0360.010 |
| (7) | Fraction of non-interacting E-Sd | 0.8500.220 | 0.8460.220 | 0.7960.207 | 0.7930.206 |
| (8) | Fraction of non-interacting Irr1 | 0.0640.023 | 0.0520.017 | 0.1080.030 | 0.0640.018 |
| (9) | Fraction of compact | 0.000 | 0.0120.006 | 0.0210.007 | 0.0800.022 |
| Blue Cloud [N=2844] | |||||
| (10) | Total no of galaxies | 154 | 332 | 876 | 1482 |
| (11) | Fraction of mergers | 0.1490.048 | 0.1140.034 | 0.0880.025 | 0.0690.019 |
| (11a) | Lower limit on major merger fraction | 0.0130.009 | 0.00 | 0.0050.003 | 0.0080.003 |
| (11b) | Lower limit on minor merger fraction | 0.0460.020 | 0.0240.010 | 0.0230.008 | 0.0160.005 |
| (11c) | Fraction of ambiguous minor/major mergers | 0.0910.033 | 0.0900.028 | 0.0600.018 | 0.0460.013 |
| (12) | Fraction of non-interacting E-Sd | 0.753 0.199 | 0.8010.209 | 0.7530.196 | 0.7840.204 |
| (13) | Fraction of non-interacting Irr1 | 0.0970.035 | 0.0750.024 | 0.1360.037 | 0.0800.022 |
| (14) | Fraction of compact | 0.000 | 0.0090.006 | 0.0230.008 | 0.0670.018 |
| GEMS | GOODS | GOODS | GOODS | GOODS | ||
|---|---|---|---|---|---|---|
| Average | Average | SJ | SM | KP | ||
| (1) | Fraction of merging galaxies | 0.0460.007 | 0.0490.007 | 0.0510.007 | 0.0570.008 | 0.0380.006 |
| (2) | Ratio of in GOODS to GEMS | - | 1.060.22 | 1.10 0.23 | 1.200.25 | 0.83 0.18 |