The 22-Month Swift-BAT All-Sky Hard X-Ray Survey
Abstract
We present the catalog of sources detected in the first 22 months of data from the hard X-ray survey (14–195 keV) conducted with the BAT coded mask imager on the Swift satellite. The catalog contains 461 sources detected above the level with BAT. High angular resolution X-ray data for every source from Swift XRT or archival data have allowed associations to be made with known counterparts in other wavelength bands for over 97% of the detections, including the discovery of galaxies previously unknown as AGN and several new Galactic sources. A total of 266 of the sources are associated with Seyfert galaxies (median redshift ) or blazars, with the majority of the remaining sources associated with X-ray binaries in our Galaxy. This ongoing survey is the first uniform all sky hard X-ray survey since HEAO-1 in 1977.
Since the publication of the 9-month BAT survey we have increased the number of energy channels from 4 to 8 and have substantially increased the number of sources with accurate average spectra. The BAT 22-month catalog is the product of the most sensitive all-sky survey in the hard X-ray band, with a detection sensitivity (4.8) of erg cm-2 s-1 (1 mCrab) over most of the sky in the 14–195 keV band.
Subject headings:
Catalogs — Survey: X-rays1. Introduction
Surveys of the whole sky which are complete to a well-defined threshold not only provide a basis for statistical population studies but are also a vehicle for the discovery of new phenomena. Compared with lower X-ray energies, where various missions from Uhuru (Forman et al., 1978) to ROSAT have systematically surveyed the sky and where slew surveys of later missions have added detail, our knowledge of the sky at hard X-rays ( keV) has been rather patchy and insensitive. The sensitivity of the HEAO-A4 13–180 keV survey (Levine et al., 1984) was such that only 77 sources were detected.
Recently INTEGRAL-IBIS has provided some observations (Bird et al., 2007; Beckmann et al., 2006, 2009; Krivonos et al., 2007) that are much more sensitive but have concentrated on certain regions of the sky; the exposure in the latest IBIS ‘all-sky’ catalog varies from one part of the sky to another by a factor of a thousand, some regions of the sky having only a few thousand seconds of observation. The RXTE all-sky slew survey (Revnivtsev et al., 2004) covers much of the sky in the 3-20 keV band and detects 294 sources, but the coverage is not uniform or complete and the sensitivity is weighted to lower energies such that the BAT and RXTE sources are not the same.
A survey in the hard X-ray band is important for several reasons. Observations below 15 keV can be drastically affected by photoelectric absorption in certain sources, giving a false indication of their luminosity. Populations of heavily absorbed or Compton-thick Active Galactic Nuclei (AGN) have been hypothesized in order to explain the portion of the spectrum of the diffuse hard X-ray background ascribed to unresolved sources (Gilli et al., 2007), but such objects have not been found in the necessary numbers, prompting questions as to the composition and evolution of a population of AGN that could explain its form (Treister et al., 2009). Hard X-ray emission is also being discovered from an unexpectedly large number of previously unknown Galactic sources, notably from certain cataclysmic variables, symbiotic stars and heavily obscured high mass X-ray binaries (Bird et al., 2007).
The Burst Alert Telescope (BAT) on Swift (Gehrels et al., 2004) has a large field of view and is pointed at a large number of different directions which are well distributed over the sky. The resultant survey provides the most uniform hard X-ray survey to date and achieves a sensitivity sufficient to detect very large numbers of sources, both Galactic and extragalactic. Markwardt et al. (2005) have published the results from the first three months of BAT data, and Tueller et al. (2008) have published a survey of sources seen in the first 9 months of Swift observations, concentrating on the 103 AGN seen at Galactic latitudes greater than 15∘. We present here a catalog of all sources detected in the first 22 months of operations, (2005 Dec 15 – 2006 Oct 27) increasing the number of AGN to 266 and including all other sources seen across the entire sky.
2. Swift-BAT
Swift is primarily a mission for the study of gamma-ray bursts. Swift combines a wide field instrument, BAT, to detect and locate gamma-ray bursts (GRBs) with two narrow field instruments to study the afterglows (the X-ray Telescope (XRT) (Burrows et al., 2005) and the Ultra-Violet/Optical Telescope (UVOT) (Roming et al., 2005)). Swift-BAT is a wide field (2 sr) coded aperture instrument with the largest CdZnTe detector array ever fabricated (5243 cm2 consisting of 32,768 4mm detectors on a 4.2mm pitch) (Barthelmy et al., 2005). BAT uses a mask constructed of 52,000 5x5x1 mm lead tiles distributed in a half-filled random pattern and mounted in a plane 1m above the detector array.
This configuration results in a large field of view and a point-spread-function (PSF) that varies between 22′ in the center of the field of view (FOV) and 14′ in the corners of the FOV (50∘off axis). When many snapshot images (a snapshot is the image constructed from a single survey observation of minutes) are mosaicked together the effective PSF is 19.5′.
Point sources are found using a fast Fourier Transform convolution of the mask pattern with the array of detector rates; this effectively uses the shadow of the mask cast by a source onto the detector array to create a sky image.
Over much of the BAT field of view, the mask shadow does not cover the whole array. The partial coding fraction is defined as the fraction of the array that is used to make the image in a particular direction and varies across the FOV. The BAT field of view is 0.34, 1.18 and 2.29 sr for areas on the sky with greater than %, % and % partial coding fractions.
Swift is in low Earth orbit, but because it can slew rapidly it can avoid looking at the Earth. The narrow field instruments cannot be pointed within 45∘of the Sun, within 30∘of the Earth limb, or within 20∘of the Moon.
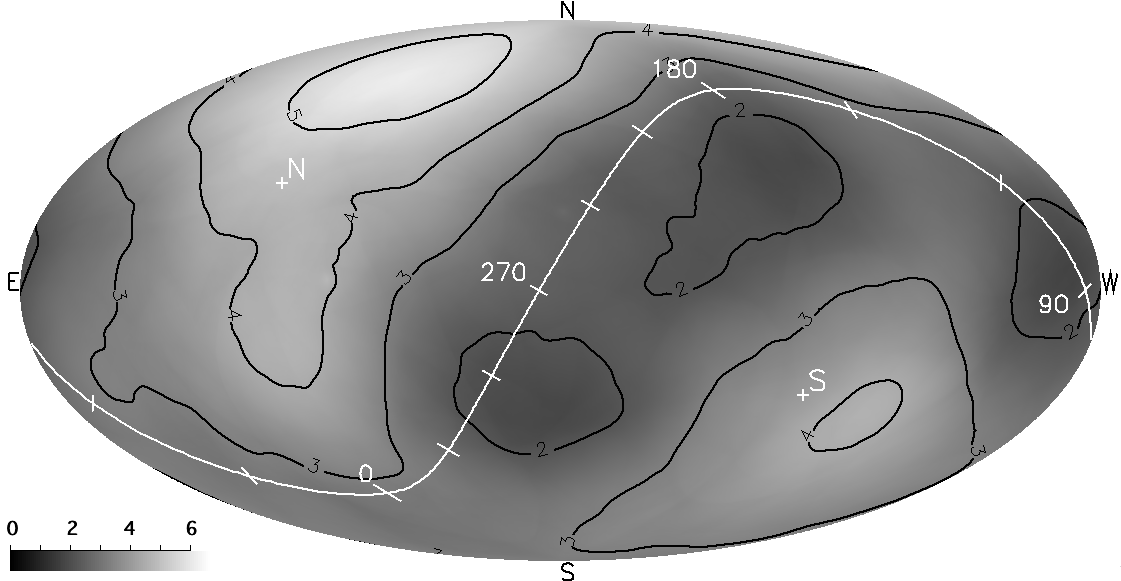
The pointing plan for Swift is optimized to observe GRBs. This strategy produces observations spread out over a few days and at nearly random positions in the sky. The BAT FOV is so large that most of the sky is accessible to BAT on any given day, but the pointing is deliberately biased toward the anti-Sun direction in order to facilitate ground based optical follow-up observations of gamma-ray bursts. Even though the Swift pointing plan is optimized for GRB observations, BAT’s large FOV and Swift’s random observing strategy result in very good sky coverage (50–80% at 20 mCrab in one day) for transients (Krimm et al. (2006)111online at: http://swift.gsfc.nasa.gov/docs/swift/results/transients/). Over a longer term, this observing strategy produces an even more uniform sky coverage (see Figure 1), with an enhanced exposure at the ecliptic poles caused by avoiding the Sun and Moon. This high coverage factor means that the BAT survey can provide reasonably well sampled light curves and average fluxes compiled from data taken throughout the period covered by the survey.

The effective exposure time of each point in the field of view is the equivalent on-axis time (partial coding fraction times observing time); therefore the observing time for a place on the sky is generally much larger than is displayed in the effective exposure map. All of the source count rates from the BAT survey are normalized to this effective exposure.
The observing efficiency of Swift-BAT is high for a satellite in low Earth orbit, but observing inefficiencies (passages through the South Atlantic Anomaly (SAA) 16%, slewing 16%, down time %) still result in a loss of 33% of the total observing time.
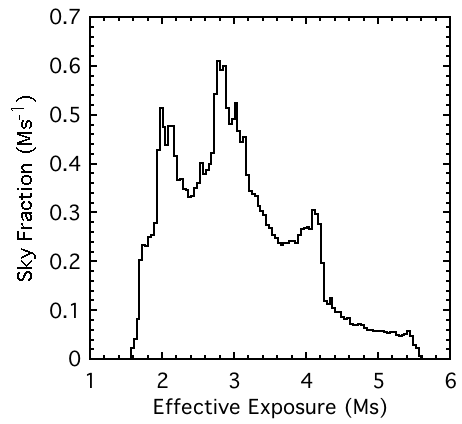
The BAT 22-month survey includes data taken between 15 Dec 2004 and 27 Oct 2006; there are 39.6 Ms of usable data in the 22 month survey. A typical point on the sky is within the BAT FWHM FOV % of the time, and the survey data screening rejects 0.5% of the data (see §3.1). These two effects result in an effective exposure of 3.9 Ms for a typical point on the sky. The histogram of the effective exposure (Figure 2) shows that most of the sky has an effective exposure time between 1.7 and 4.3 Ms, with a few regions receiving as much as 5.6 Ms.
The BAT PSF is determined by the mask tile cell and detector cell sizes. For an on-axis source, the PSF is approximately Gaussian with a FWHM of 22.5 arcminutes. In the native Cartesian tangent plane coordinate system of BAT images, the PSF has nearly a constant shape and size throughout the field of view. However, because tangent plane units are not spaced at equal celestial angles, the true PSF shape is compressed for off-axis sources, varying approximately as where is the angle of the source from the pointing axis. When averaged over many pointings, and weighted by partial coding and solid angle, the mean PSF is 19.5 arcminutes FWHM. We use this 19.5 arcminute PSF when analyzing the BAT survey mosaicked skymaps since they are composed of many contributing snapshot observations.
3. BAT Survey Processing
The following sections describe the BAT survey analysis techniques as implemented in the batsurvey software tool. General information on coded mask imaging can be found in Skinner (1995, 2008), Fenimore & Cannon (1981), and Caroli et al. (1986).
3.1. BAT Survey Data Collection and Initial Filtering
The BAT instrument monitors the sky in “survey” mode when not within a few minutes of responding to a gamma-ray burst. In this mode detected events are binned into histograms by the instrument flight software and the histogram counts are periodically telemetered to the ground (typically on a 5 minute interval). These histograms contain detector (spatial) and pulse height (energy) information. On the ground the histograms are further adjusted to place all detectors on the same energy scale, and then for the standard survey analysis are re-binned into the eight survey energy bands: 14–20 keV, 20–24 keV, 24–35 keV, 35–50 keV, 50–75 keV, 75–100 keV, 100–150 keV, and 150–195 keV.
Several quality filters are applied to the BAT survey data. First, the spacecraft must be in stable pointing mode, which means that the attitude control “10 arcmin settled” flag must be set. The spacecraft star tracker must be reporting “OK” status, and the boresight direction must be at least 30∘ above the Earth’s limb. Second, BAT must be producing good quality data, which means that the overall array event rate must not be too high or low (3000 cts s-1 rate 12,000 cts s-1); a count rate lower than 3000 cts s-1 means that the detector is not operating correctly, and a rate higher than 12,000 cts s-1 only occurs during passages through the SAA. A minimum number of detectors must be enabled ( 18,000 detectors out of 32,768), and no histogram bins can be reported as missing data because of bad telemetry. In addition, histogram time intervals that cross the UTC midnight boundary are discarded since the spacecraft has at times been commanded to make small maneuvers during that time. These temporal filters produce a set of good time intervals over which the histograms are summed. The finest time sampling of this survey analysis is approximately a single pointed snapshot (which have durations of 150–2000 s). The good time intervals are further checked so that the spacecraft pointing does not change appreciably during the interval (1.5 arcmin in pointing, 5 arcmin in roll), and data are excluded if the pointing has varied. Short intervals of 150 seconds or less are discarded in order to ensure enough counts across the detector for the balancing stage (see §3.2) of the processing to work correctly.
After temporal filtering each pointed snapshot is reduced to a set of eight detector count maps, one for each energy band. Since the systematic noise in the sky images depends on the quality of individual detectors, significant effort is made in optimizing the spatial filtering of the data (i.e, the masking of undesirable detectors). All detectors disabled by the BAT flight software are masked. In addition the detector counts maps are searched for noisy (“hot”) detectors using the bathotpix algorithm; any detectors found to be noisy are masked. Finally, detectors with known noisy properties (i.e. high variance compared to Poisson statistics) are discarded. The “fixed pattern” noise (see §3.3) is also subtracted from each map.
3.2. Removal of Bright Sources
Bright point sources and the diffuse sky background contribute systematic pattern noise to the entire sky image, at approximately 1% of the source amplitude, due to the coded mask deconvolution technique. By subtracting the contributions of these sources from the detector images, the systematic noise can be significantly reduced. We used the batclean algorithm to remove bright sources and diffuse background at the snapshot level. The diffuse background is represented as a smooth polynomial in detector coordinates. Bright sources are represented by the point source response in the detector plane. The source responses are generated using ray tracing to determine the shadow patterns. Bright sources are identified by making a trial sky map, and any point source detected above in any energy band is marked for cleaning. In our experience–and based on the properties of the BAT mask—no new bright sources become detectable after the batclean calculation, so it is not necessary to iterate the process again. In order to preserve the original bright source intensities, we insert the fluxes from the uncleaned maps into the cleaned maps around the locations of these sources.
At the batclean stage the maps are also “balanced” so that systematic count rate offsets between large scale spatial regions on the detector are removed. Sources shining through the mask do not produce this kind of coherent structure, therefore this balancing stage helps to remove systematic noise. This process involves dividing the array into detector module sides (128 detectors, []), which are separated by gaps of 8.4–12.6 mm from neighboring detector module sides. The mean counts in both the outer edge detectors (44 detectors), and the inner detectors (84 detectors), are subtracted for each module separately, so that the mean rate is as close as possible to zero. Count rate variations from module to module are believed to occur because of variations in the quality of CZT detector material and because of dead time variations in the module electronics caused by noisy pixels. Variations between outer edge and inner detectors in each module are due to cosmic ray scattering and X-ray illumination of detector sides. The BAT coded mask modulates the count rate of cosmic sources on essentially detector-to-detector spatial scales, so the subtraction of the mean count rates averaged over many tens of detectors does not affect the coded signal.
Very bright sources which are partially coded will cast shadows of the mask support structures on the edges of the mask. These shadows are not coded by the mask, are highly energy dependent, and thus must be treated carefully. This is done by masking detectors in regions of the detector plane affected by mask-edge regions for bright sources (0.3 Crab or brighter) determined via ray tracing.
After subtracting bright sources and background, detectors whose counts are more than from the mean are discarded in order to further remove contributions from noisy detectors.
3.3. Fixed Pattern Noise
Non-uniform detector properties cause variations between the background count rates measured in different detectors. These spatial differences form a relatively stable pattern over timescales much longer than a day and are not addressed by the batclean algorithm. These spatial differences also comprise a fixed noise in detector coordinates which is transformed by the survey processing into unstructured noise in the sky image. This fixed pattern is determined by constructing long term averages of the residual BAT count rates of each individual detector, after subtracting the contributions of bright sources as described above. In this construction, variable terms average to zero and only the stable pattern remains. This pattern maps are then subtracted from each snapshot detector image. The benefit of removing this fixed pattern noise is that each individual detector is addressed, thereby removing systematic noise on a finer scale than the balancing stage mentioned previously.
The contributions of some detectors to this fixed pattern is time dependent as a result of temporal variations in detector performance. We address this time dependence in each detector by fitting a polynomial to the daily average value. The fits are done on data spanning weeks to many months, and the polynomial used has order per 30 days fit.
This approach (subtracting the long-term average fixed pattern noise from the data) avoids removing any legitimate signal from sources since Swift changes its pointing direction on much shorter time scales.
In practice, the entire survey processing must be run once initially for all of the data, with the pattern contribution set to zero, in order to determine the residual rates mentioned above. Once the pattern maps have been computed, the processing is run a second time using those values.
3.4. Sky Maps
Sky maps are produced for each snapshot using the batfftimage algorithm which cross-correlates the detector count maps with the mask aperture pattern. Sky maps are sampled at 8.6 arcmin on-axis, which corresponds to half the natural element spacing for the coded mask. The natural sky projection for these maps is tangent-plane; thus, the sky-projected grid spacing becomes finer by a factor of 2 at the extreme edges of the field of view. The angular extent of a sky map from one snapshot covers the region in the sky where the BAT has some non-zero response. This field of view is approximately , although the sensitivity is much reduced at the edges of the field of view due to projection effects through the mask (foreshortening of the mask and shadowing due to the mask thickness at large off-axis angles) and partial coding.
The snapshot maps are corrected for partial coding, geometric projection effects, and the number of active detectors. Thus, they represent the BAT count rate per fully illuminated detector, corrected approximately to the on-axis response. An examination of the measured count rates of the Crab nebula (considered to be a stable point source for the BAT) shows some systematic residual trends as a function of off-axis angle and energy. These effects are primarily due to absorption by passive materials in the field of view, whose absorption lengths scale approximately as , where is the off-axis angle. The absorptions can be as high as 50% at the lowest energies and largest angles, but are typically smaller. After correction for these effects, the count rate estimates are accurate to within a few percent.
Partial coding and noise maps which represent the partial exposure of each pixel in the sky map are created for each pointed snapshot. The partial coding maps are further adjusted to correct for the fact that some parts of the sky are occulted by the Earth during the observation. For each observation, a map of the average Earth occultation is computed showing the fraction of the observation time each pixel is occulted, and the partial coding map is multiplied by this occultation map to account for the reduced effective observing time. The noise maps are generated by computing the local r.m.s. of the pixel values in an annulus around each position (see §3.6).
Individual pointed snapshot sky maps are discarded if the differences between the model used in the bright source removal and the cleaned, binned detector plane data lead to a reduced chi-square value greater than 1.25. This filtering excluded primarily data around the bright X-ray source Sco X-1, which produces such strong count rate modulations that they aren’t reduced to zero at the Poisson statistical level by batclean. This does produce a significant exposure deficit around Sco X-1 and the Galactic center region.
3.5. Mosaicking
The sky images from each snapshot are weighted by inverse variance (i.e. noise-2) and combined into all-sky maps. Each snapshot sky map contributing to the mosaic is trimmed such that all areas of the snapshot have greater than 15% partial coding. The sky is divided into six facets in Galactic coordinates, with grid spacing of the pixels 5 arcmin at the center of each facet. The Zenithal Equal Area projection was used in order to minimize distortion far from the center of projection. Each individual sky image is projected and resampled onto the all-sky grids by bilinear interpolation, as are the partial coding and noise maps. The final result is a set of weighted flux maps, propagated noise maps and effective exposure maps for each energy band and facet combination, plus an additional one for the total energy band of 14–195 keV.
This analysis procedure produces a sky image where each pixel represents the best estimate of the flux for a point source at the corresponding position in the sky (see Fenimore & Cannon (1981) for more information on coded mask image reconstruction).
3.6. Source Detection
A “blind” source detection algorithm was used to search for sources in the mosaicked significance maps using the full survey bandpass of 14–195 keV. The significance map is the ratio of the counts map to the local noise map.
The RMS noise map is calculated from the mosaicked sky map using an annulus of radius 30 pixels (2.5∘) with an inner exclusion radius of 8 pixels (40′). An 8 pixel radius around the position of all known BAT sources is also excluded from the regions used for background calculation. We do not attempt to fit the PSF of the source for the noise calculation and hence the positions of sources must be eliminated from this calculation to get an accurate measure of the underlying noise in the image.
The noise is assumed to be a smooth function of image position and so the value at the center of the annulus is well approximated by the average value in the annulus. This calculated noise includes both statistical and systematic noise and is therefore a better estimate of the total noise in the image than the noise calculated from a PSF fit. The noise from every source is distributed over the whole image, just as the signal from the source is distributed over the detector array, so no local enhancement of noise at the position of the source is expected.
The blind search algorithm first finds all peaks in the map by searching for pixels that are higher than each of the surrounding 8 pixels. If the significance in a peak pixel is greater than our detection threshold of (see §4.4), the excess is considered to be a detection in the blind search for new sources.
4. The Swift-BAT 22-Month Catalog
| Class | Source Type | # in catalog |
|---|---|---|
| 0 | UnidentifiedaaSources listed as unidentified have an object with unknown physical type as a counterpart. Some of these objects are associated with a source detected at another wavelength. | 19 |
| 1 | Galactic bbSources classified as galactic are so assigned because of observed transient behavior in the X-ray band along with insufficient evidence to place them in another class. | 3 |
| 2 | ExtragalacticccSources in the extragalactic class are seen as extended in optical or near-IR imagery, but do not have firm evidence (such as an optical spectrum) from other wavebands confirming whether they harbor an AGN. | 17 |
| 3 | Galaxy Clusters | 7 |
| 4 | Seyfert Galaxies | 229 |
| 5 | Beamed AGNddSources classified as “beamed AGN” include blazars, BL Lacs, FSRQs, quasars, and other high redshift AGN. | 32 |
| 6 | CVs / Stars | 36 |
| 7 | Pulsars / SNR | 15 |
| 8 | X-ray Binaries | 121 |
The catalog of sources detected by Swift-BAT using the first 22 months of data includes sources at all Galactic latitudes. The 22-month catalog and associated data in electronic form can be found online at the Swift website.222http://swift.gsfc.nasa.gov/docs/swift/results/bs22mon/
Figure 3 shows the distribution of sources on the sky color coded by source type, with the symbol size proportional to the source flux in the 14–195 keV band. Table 1 gives the distribution of objects according to their source type. Sources classified as “unidentified” are those where the physical type of the underlying object (e.g., AGN, CV, XRB, etc) is unknown. These sources have a primary name derived from the BAT position. Some unidentified BAT sources are associated with sources in the X-ray or gamma-ray bands (with positions unable to sufficiently determine an optical counterpart or physical source type), and these sources can be distinguished by having a name in the catalog derived from the observation in the other waveband. The few sources classified only as “Galactic” generally lie in the plane and have shown some transient behavior which indicates a Galactic source, but no other information is available that would allow further classification. “Extragalactic” sources are detected as extended sources in optical or near-IR imaging, but do not have other indications of being an AGN. The “Beamed AGN” category includes BL Lacs, blazars, and FSRQs.


Table The 22-Month Swift-BAT All-Sky Hard X-Ray Survey is the listing of all the sources detected above the 4.8 level in a blind search of the 22-month Swift-BAT survey maps. The first column is the source number in the 22-month catalog. The second column of the table is the BAT name, constructed from the BAT source position given in columns three and four. In cases where the source has been previously published with a BAT name corresponding to a slightly different location (e.g., a source position from a previous BAT catalog with less data), we have used the first published name but have given the correct 22-month BAT coordinates in columns two and three. The fifth column is the significance of the blind BAT source detection in sigma units. Instances where more than one possible counterpart to a single BAT source is likely are indicated with ditto marks in columns 2–5.
The sixth column gives the name of the identified counterpart to the BAT hard X-ray source with the most precisely known position. These are often optical galaxies, or 2MASS sources, and are associated with a source detected in the medium-energy X-ray band (3–10 keV) in Chandra, XMM-Newton, or XRT images. Counterpart determination is discussed in §4.2. The seventh column gives an alternate name for the counterpart. We have preferred to list a well known name (e.g., Sco X-1) or a name from a hard X-ray instrument or high energy detection. The best available coordinates of the counterpart (J2000) are given in the table in columns 8 and 9.
The 10th and 11th columns give the 14–195 keV flux of the BAT source (in units of 10-11 ergs sec-1 cm-2) and its error. The BAT flux for each counterpart is extracted from the hard X-ray map at the location of the counterpart given in columns 8 and 9. The flux determination method is described in §4.5.
The 12th column indicates whether there is source confusion: there is source confusion either if there is more than one possible XRT counterpart or if two likely hard X-ray sources lie close enough together to make a proper extraction of the flux not possible with the standard method. The treatment of confused sources is discussed in more detail in §4.3. We define two classes of source confusion: “confused” sources, and “confusing” sources. A source is “confusing” for the purposes of this column if a fit to the map indicates that the source contributes to the hard X-ray flux of a neighboring source. A “confused” source has received more than 2% of its flux from a neighboring source. A confused source is labeled with an “A” in this column, and a confusing source with a “B” (the case of a very bright source next to a weak one would result in the bright source labeled with a “B” and the weak source with an “A”). A source that is both confused and confusing (e.g., the case where there are two similar strength sources close to each other, such as when there are two possible XRT counterparts to a single BAT source) is labeled with an “AB”.
When a source has an entry in column 12, a best estimate of the counterpart flux is listed in column 10 from a simultaneous fit of all the counterparts in the region to the BAT map. When the entry is “A” or “AB” in column 12 (indicating a confused source), the error on the flux is not well defined, and column 11 is left blank. (See §4.5).
The 13th and 14th columns list the source hard X-ray hardness ratio and its error computed as described in §4.7. The hardness ratio is defined here as the ratio of the count rate in the 35–150 keV band divided by the count rate in the 14–150 keV band.
The 15th and 16th columns give the redshift and BAT luminosity of the counterpart if it is associated with a galaxy or AGN. The source luminosity (with units log[ergs s-1] in the 14–195 keV band) is computed using the redshift and flux listed in the table and a cosmology where km s-1 Mpc-1, , and .
The 17th column lists a source type with a short verbal description of the counterpart.
4.1. Source Positions and Uncertainties
The BAT position is determined by using the BAT public software tool batcelldetect to fit the peak in the map to the BAT PSF (a two dimensional Gaussian with a FWHM of 19.5 arcminutes). The batcelldetect program performs a least-square fit using the local rms noise to weight the pixels in the input map. These fit positions were used to generate the BAT positions in the catalog and the names of newly detected BAT sources.
The PSF fit using batcelldetect also reports a formal position uncertainty based on the least-square covariance matrix. However, because neighboring pixels in the coded mask images are inherently correlated, the formal uncertainty reported by this technique will not be representative of the true uncertainty. Therefore we choose to use the offset between the fit position and the counterpart position as an indicator of the BAT position error.
The batcelldetect program also has the option of fitting source locations using an input catalog of starting positions. We have used this capability to test the stability of the source positions found by batcelldetect by using an input catalog where all the starting positions have been offset by 8 arcminutes in a random direction from the source position found in the blind search. We have performed this test with several different offsets and find that the fit converges to within 1 arcminute of the counterpart position for BAT sources that are not confused. For a few sources, the fit sometimes converges onto a side peak instead of the primary peak, but this error is not repeated in additional tests starting from other randomized positions. This type of systematic error in the position determination does not occur in the blind search (§3.6) since we use the maximum pixel to start the fit instead of a randomized spot 8 arcminutes from the blind position. Anomalous offsets in the source position are identified by examination of the image and refitting.
In order to judge the accuracy of the BAT positions, we plot in Figure 4 the angular separation between the BAT position and the counterpart position against the significance of the BAT source detection.
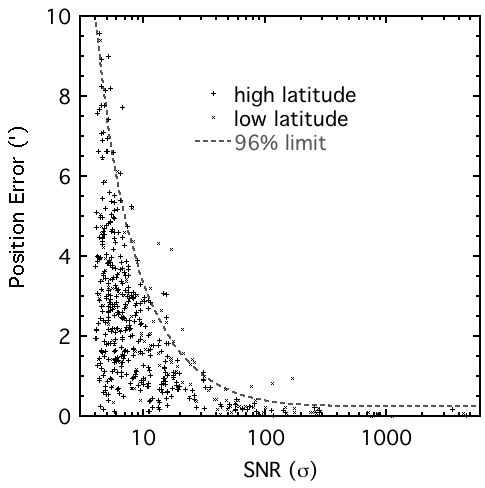
The accuracy of the BAT position improves as the significance of the detection becomes stronger. There are 461 BAT sources in Table The 22-Month Swift-BAT All-Sky Hard X-Ray Survey with detection significances greater than ; there are 479 possible counterparts, and of these 25 are located grater than 5 arcminutes from the BAT position. Therefore, there is only a % chance of a BAT-detected source () having a counterpart farther away than 5 arcminutes.
In Figure 4 we also plot a line showing our estimate of the BAT position error for a given source significance. This estimate for the error radius (in arcminutes) can be represented with the function
| (1) |
where is the BAT detection significance. This empirical function includes a systematic error of 0.25 arcmin deduced from the position errors of very significant sources. This error radius includes 96% of the sources that are greater than from the Galactic plane and from the Galactic center. The error radius encloses 85% of sources in the Galactic plane. Sources known to be confused are not included in the plot.
4.2. Counterparts
Counterparts to the BAT sources were primarily discovered by examining X-ray images taken with instruments with good angular resolution. Chandra resolution is sometimes required on the plane, otherwise XMM-Newton, Suzaku or ASCA images were examined. ROSAT images and source catalogs were of relatively low importance for counterpart identification because of ROSAT’s lack of effective area in the hard X-ray band, because of the poor correlation between ROSAT flux and the BAT hard X-ray flux (see Tueller et al. (2008), Figure 7), and because of the high chance probability of finding a ROSAT source in the BAT error circle.
If no archival X-ray images existed for the location of a BAT source, we requested Swift-XRT followup observations of the field containing the BAT source. A 10 ks observation with XRT is deep enough to detect almost all BAT sources. BAT extragalactic sources are usually AGN contained in bright (), nearby galaxies at redshift and are easily identified in an XRT observation.
The X-ray counterpart to an unabsorbed BAT source is a very bright XRT source, which is easily detected with a 2 ks XRT observation. However, most of the new BAT sources are heavily absorbed in the X-ray band and were not detected by ROSAT. We have found empirically that XRT can detect essentially all of the BAT sources (including the absorbed ones) in a 10 ks observation.
We require consistency of the BAT and the X-ray spectrum ( keV) when simultaneously fit with an absorbed power law allowing only a renormalization between BAT and XRT to account for variability. This consistency of the spectra is required for all sources not previously known to be hard X-ray emitters, except transients and sources known to have highly variable spectra where the BAT spectrum averaged over years cannot be directly compared to the XRT measurement from a single observation.
A small fraction of XRT follow-up observations in the 5–10 ks range detected multiple sources consistent with the BAT position. In these cases the counterpart to the BAT source was almost always identified by limiting the bandpass of the X-ray image to the higher energy 3–10 keV band. This bandpass filtering usually reduced the number of sources in the field to a single hard source.
In the few cases where two or more hard sources still remain after bandpass filtering, all are considered possible counterparts to the BAT source and listed in the catalog with a flag indicating that the counterpart identification suffers from source confusion. There are 18 more possible counterparts in Table The 22-Month Swift-BAT All-Sky Hard X-Ray Survey than there are blind BAT sources (461) because of the 15 cases where there are one or more possible counterparts to a single BAT source.
Because the counterpart identification requires an X-ray point source with a small error radius ( arcsec), a positional coincidence with a known source or bright galaxy, and an X-ray spectrum consistent with the BAT flux, we believe that the counterpart misidentification rate is extremely small. All of the identified counterparts listed in Table The 22-Month Swift-BAT All-Sky Hard X-Ray Survey are hard X-ray sources.
4.3. Confused Sources
Sources are labeled as confused in our table when the highest pixel associated with the BAT source in the mosaicked maps (the “central pixel” value) has a significant contribution from adjacent sources. This includes the cases when two possible X-ray counterparts lie within a single BAT pixel and when two BAT sources are close enough that each contributes flux to the location of the adjacent source.
Using the positions of the X-ray counterparts as an input catalog, we calculated the fractional contribution of each BAT source to its neighbors. We used the significance measured in the blind search and the 19.5 arcminute FWHM Gaussian BAT PSF to calculate the intensity of each source at the position of its neighbors. The central pixel value for each BAT source was assumed to be the sum of the source plus all the contributions from its neighbors. This creates a set of linear equations that can be solved for the true significance of each source. We solved these equations with the constraint that sources were not allowed to have negative significance. This procedure was devised to determine cases where the BAT significance is altered because of the presence of a very strong nearby source.
If we found that the resulting fit S/N from the technique that accounted for contributions from neighbors was lower than the central pixel S/N from the blind search by 2%, we labeled it as confused.
4.4. Detection Significances and Limits
The detection significance for the BAT sources in the catalog is extracted from the mosaicked significance map at the BAT position (see §3.6). The significance is taken from the highest pixel value in the blind search.
Figure 5 shows the distribution of individual pixel significances from the mosaicked map of the entire sky.

As is usual for a coded mask imager, the noise distribution is a Gaussian function centered at zero significance, with a width of and a total integrated area equal to the number of pixels in the map. The large tail at positive significance is due to real astrophysical sources present in the map.
The distribution of the pixel significances in Figure 5 closely follows a Gaussian distribution for the negative significances. The positive side of the distribution also follows a Gaussian, but with the addition of pixels with enhanced significances because of the presence of real sources in the map.
Examination of the negative fluctuations provides a good measure of the underlying noise distribution. There is only 1 negative pixel in the entire map with a magnitude greater than . We therefore choose our detection limit to be . This detection limit is also the same as used in the 9-month version of the Swift-BAT catalog. While it is clear that there are several real sources with significances somewhat smaller than , we choose this value in order to minimize false sources caused by random fluctuations. We expect random fluctuations to account for 1.54 sources at the level in our sky map of independent pixels.
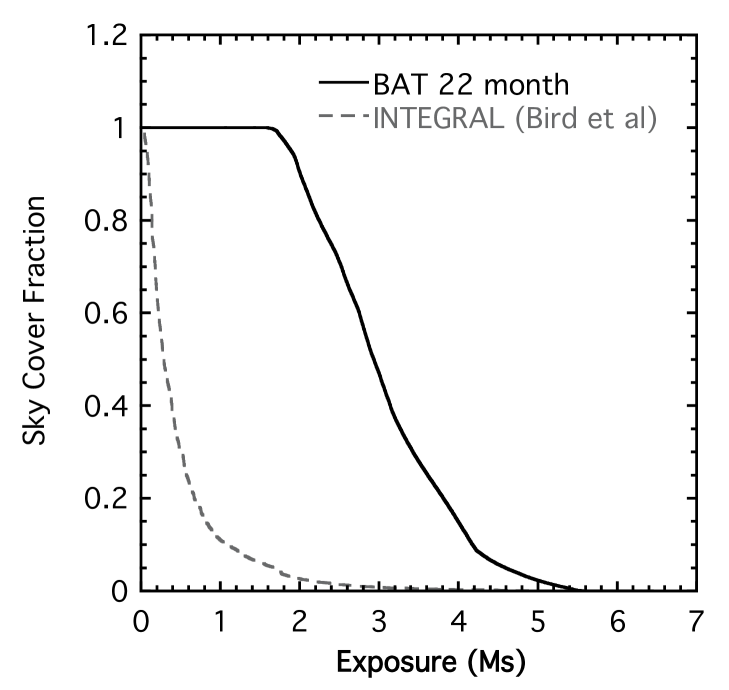
Figure 6 shows the integral distribution of sky coverage versus sensitivity achieved in the survey.

We achieve a sensitivity of better than 1 mCrab for half the sky, which corresponds to a flux of ergs cm-2 s-1 in the 14–195 keV band.
4.5. Counterpart Fluxes
Fluxes of the counterparts to BAT sources were extracted from the mosaicked maps using the pixel containing the position of the identified counterpart. For sources where a counterpart is not known, we use the fitted BAT position to determine the flux.
We have chosen to normalize source fluxes in the 8 survey bands to the Crab because the systematic uncertainties in the survey averaged Crab spectrum are smaller than the uncertainties in the BAT survey response matrix. The source fluxes in each band were computed by comparing the source count rate to the measured rate of the Crab Nebula in each band:
| (2) |
where the Crab flux in each band is given by
| (3) |
where and are the lower and upper BAT band edges and the energy in keV.
We take the Crab counts spectrum to be
| (4) |
determined by fitting a power-law model to BAT on-axis calibration observations taken early in the Swift mission. These values are consistent with characterizations of the Crab spectrum using data from Integral/SPI (Jourdain & Roques, 2008), Integral/IBIS (Jourdain et al., 2008), HETE/FREGATE (Olive et al., 2003), SAX/PDS (Fiore et al., 1999), and GRIS (Bartlett, 1994).
The total Crab flux is then
| (5) |
Sources with a spectral index very different from the Crab can have a small but significant residual systematic error in the fluxes determined with this method.
In order to gauge this error we generated counts spectra for different models in the eight survey bands using the BAT on-axis spectral response matrix. The Crab comparison flux determination method described above was used to obtain the model fluxes in each of the eight survey bands. The flux errors between the computed fluxes and the model fluxes in the individual bands were always % for a range of model spectral indices between 1 and 3 and so we deem this technique acceptable for producing the source fluxes in each of the survey bands.
We fit the 8-channel spectra with a power law model in order to produce an overall hard X-ray flux for each BAT source. We used XSPEC and a diagonal matrix to fit the 8-channel spectra with the pegpwrlw model over the entire 14–195 keV BAT survey energy range in order to extract the source flux in this band. This approach was selected because it weights the energy bands by their individual uncertainties; a simple sum of the bands would produce a very large error due to the high weight it assigns to the noisiest bands at the highest energies.
The error in the overall flux was determined by using the error function in XSPEC and is given in Table The 22-Month Swift-BAT All-Sky Hard X-Ray Survey. For the highest significance BAT sources ( sigma), this procedure does not produce a good fit (reduced ), but this is to be expected from the very high significances of each point and the coarse energy binning. To evaluate the systematic error in the fitting we performed fits to our model spectra generated from the response matrix. For power law spectra, the systematic error in the flux is dominated by the error in the individual data points as calculated above. Sources with hardness ratios less than 0.1 are not well fit with a power law, and the systematic uncertainty in the flux can be significantly larger.
The fluxes for sources marked as confused were calculated in a slightly different way. Instead of using the count rate extracted from the map at the counterpart position, we performed a simultaneous fit to find the fluxes of all the sources in the confused region as described in §4.3. For these sources we do not quote an error on the flux estimate because the behavior of the errors with this fitting technique is not well known. Any source with a confused flag should be considered as detected by BAT but the flux should be considered as an upper limit.
4.6. Sensitivity and Systematic Errors
In this section, we compare the expected statistical errors with the actual measured statistical noise in the final mosaic maps. From the perspective of pure Poisson counting statistics, the uncertainties are governed primarily by the properties of the coded mask and the background (see Skinner (2008) for details). The expected noise level can be expressed as (adapting from Skinner (2008) Eqn. 23 and 25):
| (6) |
where is the per-detector rate, including background and point sources in the field of view; is the number of active detectors (); is the effective on-axis exposure time; and is a coefficient dependent on the mask pattern and detector pixel size ( for BAT). The partial coding, , enters the expression through the “effective on-axis exposure” time, , where is the actual exposure time. Using nominal values ( cts s-1 detector-1; (the exposure-weighted mean number of enabled detectors); and Crab rate = cts s-1 detector-1), we find the estimated Poisson noise flux level to be
| (7) |
We consider this to be a lower limit to the expected Poisson noise level for a given effective exposure. In reality, the background rate may be higher than the nominal value by up to 50% depending on the particle environment of the spacecraft. Also, along the Galactic plane the contributions of bright sources such as the Crab, Sco X-1 and Cyg X-1, are not strictly negligible, and will raise the overall level of by up to 10%. All of these adjustments would cause a Poisson noise level larger than given by equation 7, by an amount that depends on the specific satellite conditions during the survey. We estimate that, averaged over the entire survey duration, the true Poisson noise level may be 5–15% higher than the lower limit quoted above.
Figure 7 compares the measured noise and expected noise versus effective on-axis exposure.

We see that both noise measures are decreasing approximately as , which suggests that the dominant errors are uncorrelated over time. It also suggests that pointing strategies such as roll-angle dithering have been successful in reducing pointing-related systematic errors. However, the measured noise is still higher than the expected Poisson noise by 30–45%, and we take this to be a measure of the unmodeled systematic variations on the detector plane.
The largest likely contributors to systematic variations are improper subtractions of diffuse background, and of bright sources. BAT count rates are background-dominated — the background rate is equivalent to 6–9 Crab units — so the coded mask analysis is particularly sensitive to imperfect subtraction of spatial background variations. While the pattern map method and the functions fitted during the cleaning stage produce a good model of the detector background, some imperfections remain. One effect is that detector-to-detector sensitivity differences, coupled with varying exposures to the X-ray background, can lead to excess residuals.
For similar reasons, bright sources may also contribute systematic noise. The brightest sources are clustered along the Galactic plane, and thus contribute noise in those preferred locations. Indeed, we note that the measured noise is 50% higher in the Galactic center region, where there is a concentration of bright point sources. This is a larger factor than can be accounted for by a larger count rate. Modeling of point sources may be imperfect for the same reasons as for the background. Also, there may be other effects such as side illumination of detectors that may contribute additional noise. Here, “side illumination” refers to the facets of the individual CdZnTe detectors which do not face the pointing direction, but are still sensitive to X-rays. Off-axis sources will shine through the mask and illuminate the sides, producing an additional (although fainter) coded signal. At the moment, illumination of the sides of detectors is not modeled at the imaging or cleaning steps, and thus there will be an additional noise due to the effect.
Proper modeling of these systematic error contributors will be the subject of future work. At this stage we do not have an in-depth analysis of the quantitative contributions of each effect to the systematic noise, and in some cases the analysis may be prohibitively difficult. Still, at the current exposure levels, the noise level seems to be decreasing with exposure, and we do not appear to be reaching an ultimate systematic limit in this analysis.
4.7. Spectral Analysis
In §4.5 we use a simple power-law fit to the data to estimate the source flux. However, because the catalog contains sources with various different physical natures and spectral shapes, we choose to use the more robust characterization given by a hardness ratio to describe the BAT spectra.
Hardness ratios for the Swift-BAT sources were calculated by taking the sum of the count rate in the 35–150 keV band and dividing by the count rate in the 14–150 keV band. Errors on the hardness ratio were calculated by propagating the errors on the count rates in the individual 8 bands except when the source is listed as confused. Figure 8 shows a map of the source positions on the sky, with the source flux represented by the size of the point and the source hardness by the color (red is softer and blue is harder).
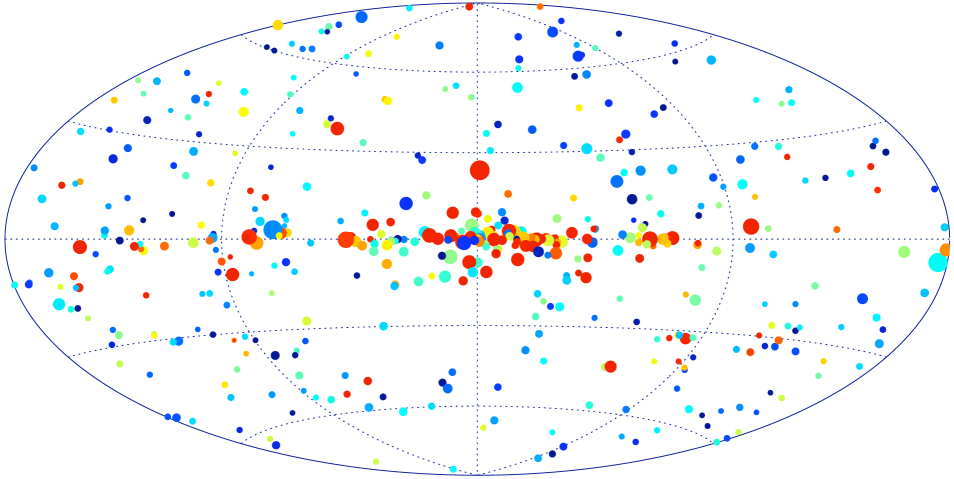
Figure 9 shows the hardness ratios of the 22-month BAT sources by source class.

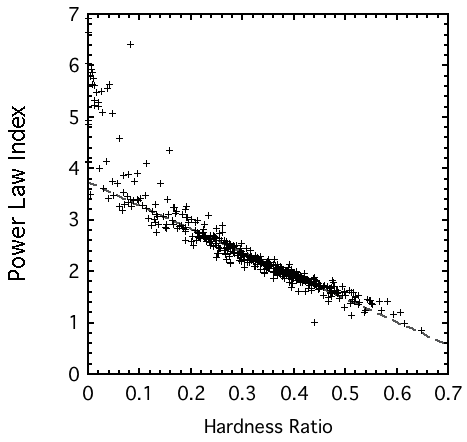
A mapping can be made between hardness ratio and power-law index for sources that have spectral shapes well described by a simple power-law model (e.g., the majority of AGN in our catalog). This mapping is well represented by
| (8) |
where is the power-law index and is the hardness ratio as defined above. Figure 10 shows the correlation between power-law index and hardness ratio for the BAT survey sources. The correlation holds well for sources with hardnesses above about 0.15, but begins to break down for softer sources. An illustration of this problem is the soft BAT spectra of clusters of galaxies, which have thermal spectra with temperatures keV and are usually detected only in the lowest energy BAT band and are not well fit by a power-law model. We leave to a later paper a more careful spectral analysis using models appropriate to the physical nature of the sources.
5. Swift-BAT Survey Sources
Although it is for extragalactic astronomy that the present survey represents the greatest step forward, a comparison of the results for Galactic sources with earlier work also has interesting implications.
Of the 479 sources in Table The 22-Month Swift-BAT All-Sky Hard X-Ray Survey, 97% have reasonably firm associations either with objects known in other wavebands or with previously known X-ray or gamma-ray sources. More than 60% of the associations are with extragalactic objects. At high Galactic latitudes () the density of identified extragalactic sources is 22.6 sr-1, and it is only only slightly reduced at low latitudes to 19.2 sr-1. This suggests that only extragalactic sources in the plane are missed through reduced sensitivity, lack of information in other wavebands, or confusion, and illustrates the uniformity of the survey.
153 BAT AGN were previously reported in the BAT 9-month AGN survey (Tueller et al., 2008). Winter et al. (2009) provide X-ray spectral fits for these sources and provide measures of the luminosity, , etc. for the sources in the 9-month catalog. Most of the sources in the 9-month catalog also appear here in the 22-month catalog; however, variability in the sources has caused 11 sources to drop out of the 22-month list that were in the 9-month catalog.
5.1. New sources
| Source | First | Notes |
|---|---|---|
| reported | ||
| SWIFT J0026.1+0508 | Here | Of several sources in an XRT follow-up observation, only one is hard and it is taken to be the counterpart. It could be a CV. |
| SWIFT J0732.51331 | ATel 697 | CV of subtype DQ Her. ATels 757, 760, 763. |
| SWIFT J1010.1-5747 | ATel 684 | = CD57 3057. ATel 669 gives XRT position for BAT source SWIFT J1011.1-5748 = IGRJ 10109-5746 associated with Symbiotic star CD-57 3057 (ATel 715). |
| SWIFT J1515.2+1223 | Here | In a 7400 s XRT follow-up, only one source is detected in the hard band at . No known counterparts at this position. |
| SWIFT J1546.3+6928 | Here | The BAT source is confused. There are TWO hard (3 keV) sources in the XRT image, 1RXS J154534.5+692925 AND 2MASS J15462424+6929102. There are some indications that the ROSAT source is extended, perhaps an interacting pair (making a possible third source). The 2MASS object is extended and clearly a galaxy. |
| SWIFT J1559.6+2554 | ATel 668/9 | = T CrB. The Swift source is identified with this symbiotic star in XRT follow-up. |
| SWIFT J1626.95156 | ATel 678 | Peculiar (HMXB?) transient. 15.37 s pulsations. Optical counterpart 2MASS162636525156305. Short (100–1000s) flares (Reig et al., 2008). |
| SWIFT J1753.50130 | ATel 546 | Short period (3.2 hr; ATel 1130) BH LMXB transient observed with many other instruments following BAT detection. |
| SWIFT J1907.3-2050 | Here | = V1082 Sgr. XRT follow-up shows a strong hard source coincident with the pulsating variable star. Steiner et al. (1988) have found that this star in its hard state has properties similar to a CV of subtype DQ Her. Thorstensen et al. (2009) has determined an orbital period of 20.821 hr for this object which classifies it as a long period CV. |
| SWIFT J1922.71717 | ATel 669 | Transient observed with RXTE and Integral after BAT detection (Falanga et al., 2006) |
| SWIFT J1942.8+3220 | Here | = V2491 Cyg. We find a weak hard X-ray source whose position is consistent with V2491 Cyg in data taken before its eruption as Nova Cyg 2008b. (see also Ibarra et al. (2009), ATel 1478) |
| SWIFT J2037.2+4151 | ATel 853 | Transient; later seen with Integral (ATel 967) |
| SWIFT J231930.4+261517 | ATel 1309 | XRT data show that this source is the same as 1RXS J231930.9+261525, reported and identified as a CV of subtype AM Her in ATel 1309. Mkn 322 and UGC 12515 may also contribute to the BAT counts |
| SWIFT J2327.6+0629 | Here | There is no clear source in the XRT field. |
During the survey BAT has detected a number of new sources that are transients or other Galactic objects not previously reported as hard X-ray sources. Some of these have been reported in Astronomer’s Telegrams or elsewhere, others appear for the first time in this compilation. For convenience these are summarized in Table 2.
| Source | aaGalactic coordinates are given as an indication of whether the sources is likely to be Galactic. (°) | (°) | Notes |
|---|---|---|---|
| SWIFT J0826.27033 | 284.21 | 18.09 | = 1ES 0826703, 1RXS J082623.5703142. The 4.1” radius XRT position is 1.2” from T Tau star 2MASS J082623507031431. |
| SWIFT J1515.21223 | 16.44 | +53.28 | Nearest XRT source is a weak one 7.8’ away, just outside the 5’ radius BAT error circle. |
| SWIFT J1546.36928 | 104.27 | 40.74 | Two hard XRT sources lie within the BAT error circle. One is associated with 1RXS J154534.5+692925, about which nothing is known, the other is coincident with the extended source 2MASX J15462424+6929102, which is identified with LEDA 2730634, a side-on spiral galaxy. |
| SWIFT J1706.66146 | 328.72 | 12.40 | = IGRJ170626143. Bright XRT counterpart gives precise position but no apparent optical/IR/Radio counterpart. |
| SWIFT J1709.83627 | 349.55 | 2.07 | = IGR J170983628. IGR J170913624 is only 8.5’ away. XRT provides positions for both (ATel 1140). The BAT position corresponds to IGR J170983628, but the XRT error circle contains a complex of IR sources and a radio source and it is not clear which are counterparts. |
Note. — These sources have new information but no firm identification with an optical/IR/Radio object.
In Table 3 we note other sources that are detected in this survey and where XRT follow-up has provided additional information, but where a unique optical, IR, or radio counterpart is still lacking, or where there is only a BAT detection. Some of these are almost certainly Galactic objects as may be judged from their proximity to the Galactic plane.
| BAT Name | Host Galaxy | Optical SpectrumaaThe optical spectra sources are as follows: 6df = Six degree field galaxy survey, SDSS = Sloan Digital Sky Survey, KP = 2.1 m at Kitt Peak. | Galaxy Type | redshift |
|---|---|---|---|---|
| SWIFT J0100.9-4750 | 2MASX J01003490-4752033 | 6df | Sy1.8 | |
| SWIFT J0623.8-3215 | ESO 426- G 002 | 6df | Sy2 | |
| SWIFT J0923.9-3143 | 2MASX J09235371-3141305 | 6df | Sy1.8 | |
| SWIFT J1513.8-8125 | 2MASX J15144217-8123377 | 6df | Sy1.8 | |
| SWIFT J0249.1+2627 | 2MASX J02485937+2630391 | KP | XBONGbbXBONG = (hard) X-ray Bright, Optically Normal Galaxy | 0.058 |
| SWIFT J0353.7+3711 | 2MASX J03534246+3714077 | KP | Sy2 | 0.01828 |
| SWIFT J0543.9-2749 | MCG -05-14-012 | KP | XBONG | 0.0099 |
| SWIFT J0544.4+5909 | 2MASX J05442257+5907361 | KP | Sy1.9 | 0.06597 |
| SWIFT J1246.6+5435 | NGC 4686 | KP | XBONG | 0.0167 |
| SWIFT J1621.2+8104 | CGCG 367-009 | KP | Sy2 | 0.0274 |
| SWIFT J1830.8+0928 | 2MASX J18305065+0928414 | KP | Sy2 | 0.019 |
| SWIFT J2118.9+3336 | 2MASX J21192912+3332566 | KP | Sy1 | 0.0507 |
| SWIFT J2341.8+3033 | UGC 12741 | KP | Sy2 | 0.0174 |
Table 4 list the new AGN discovered in the 22-month Swift-BAT survey. Table 4 lists those objects discovered with BAT whose AGN nature could be confirmed with an optical spectrum. In column 3 of the table we list the source of the optical data, and columns 4 and 5 list our own typing of the spectrum and the redshift. The optical spectra are mostly obtained from data in the public domain such as SDSS or 6df, but in a few cases we have obtained data from our own observations taken at the 2.1m telescope on Kitt Peak.
5.2. Extragalactic Sources
Most of the extragalactic identifications are with relatively nearby Seyfert galaxies and many of the remainder are with beamed AGN (blazars, BL Lac, FSRQ, etc) sources at much higher .
Figure 11 shows some typical BAT source host galaxy images from the Palomar digital sky survey. The field of view is 2 arcmin across for each subimage. The figure was produced by dividing the hardness-luminosity plane into 70 bins and randomly choosing a BAT source from that category to display. Of note are the high fraction of spiral galaxy hosts (as opposed to ellipticals), and the high number of interacting galaxies.

The 234 sources that have an identification with a well established Seyfert galaxy more than double the number in any previous hard X-ray survey. The distribution of column densities, spectral indices, and luminosities for the survey sources will be presented in a separate paper. As elsewhere in this paper, we emphasize that this catalog is based on mean flux levels over the entire 22 month period. The detections of sources with significant temporal variability over the survey period and the implications of such variability will be discussed elsewhere (Skinner et al., in preparation).
Figure 12 shows a histogram of the redshifts of all the AGN found in the 22-month catalog.


The distribution of the Seyfert galaxy redshifts from the 22-month survey (left panel of Figure 12) is highly biased towards low redshifts () with a tail extending out to and a few more distant objects out to . The right panel of Figure 12 shows the redshift distribution of the beamed AGN. This distribution is quite different from the Seyfert galaxies in the left panel, with redshifts that extend to and with no objects at . Since we have no selection biases with respect to these beamed AGN (as opposed to optical searches for blazars) these different redshift distributions are a fundamental property of these classes and are directly related to their luminosity functions and evolution (Ajello et al., 2009).
Figure 13 is a histogram of the luminosities of the Seyfert galaxies detected in the BAT 22-month survey.
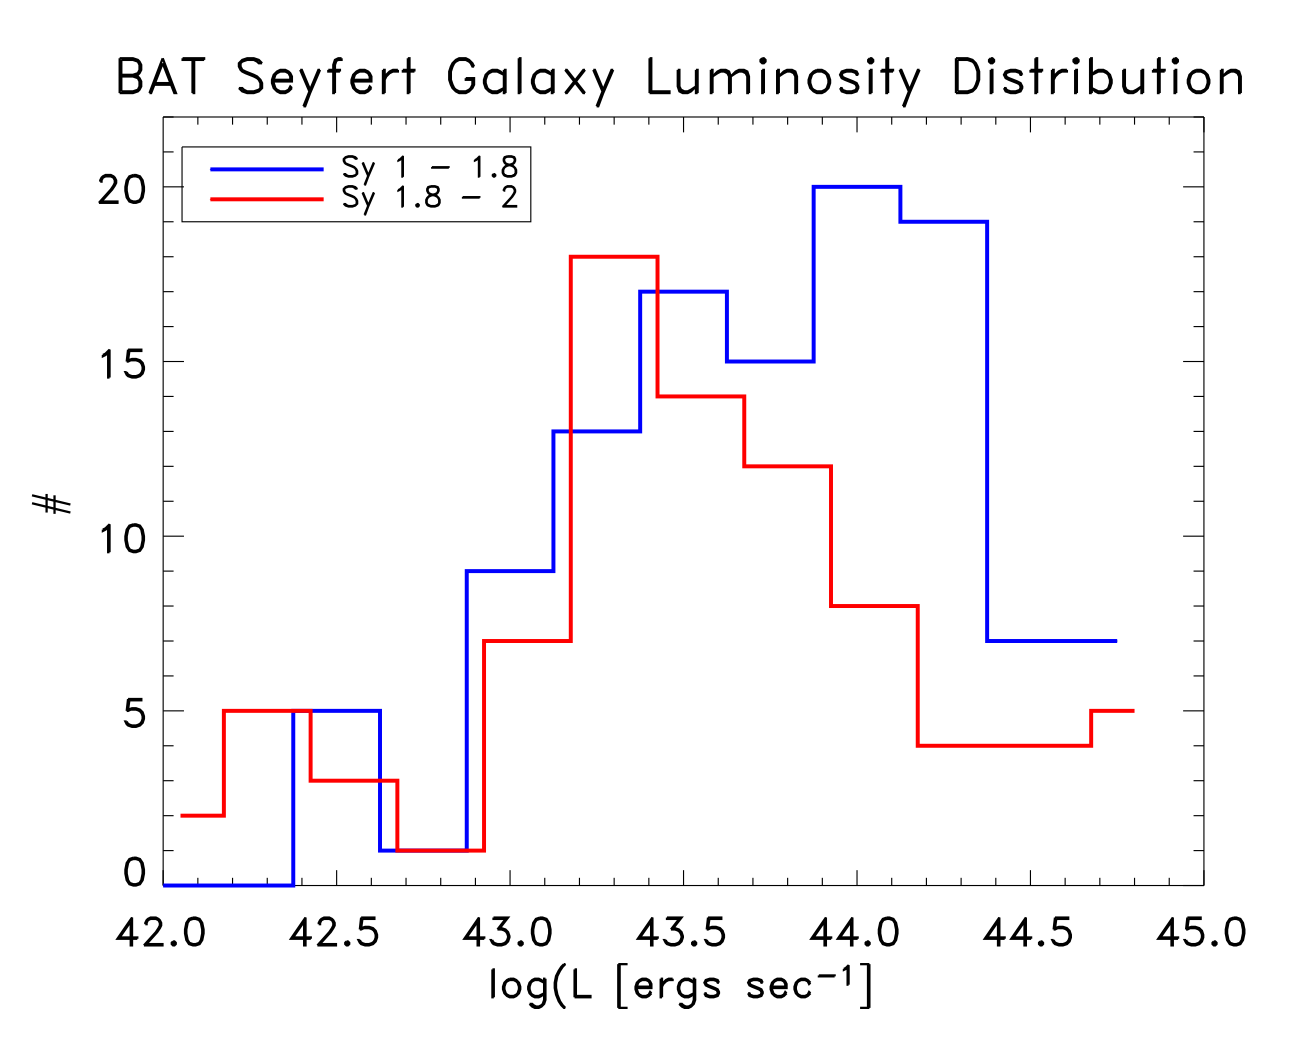
The luminosity distribution of the Seyfert galaxies continues to show a difference between the type Is and type IIs as noted in Winter et al. (2008). This indicates that the true luminosity distribution is indeed different for these two classes, which is inconsistent with the unified model of AGN. A K-S test of these two luminosity distributions shows that they are drawn from the same parent distribution with a probability of only 0.30.
As in earlier hard X-ray surveys, the second most common category of extragalactic sources are beamed AGN, which include types such as blazars, BL Lacs, FSRQs, etc. There are 32 objects in this category. The highest redshift is for QSO J05392839 at .
We have detected 10 clusters of galaxies at ; Perseus, Coma, Ophiuchus, Cygnus A, Abell 2319, Abell 754, Abell 3266, Abell 2142, Abell 3571, and Triangulum Australis. The BAT spectra of Cygnus A and Abell 2142 in the 14–100 keV band are dominated by the AGN component in or around the clusters. The other 8 clusters are all hot (10 keV); their BAT spectra are consistent with an extension of the thermal emission modeled with ASCA/XMM-Newton/Chandra archival data in the 2–10 keV band and do not require any additional component for a good fit. In other words, there is no evidence of a non-thermal diffuse component in these clusters. We estimated the upper limit of the non-thermal emission by adding a power-law model to the spectral fit for the 10 detected clusters. The upper limit is 610-12 ergs cm-2 s-1 on average and the lower limit for the magnetic field ranges from –1 G, assuming inverse Compton scattering of Cosmic Microwave Background photons by relativistic electrons in the cluster. More details are described in the papers by Ajello et al. (2009) and Okajima et al. (ApJ, submitted).
Some 20 sources are clearly identified, largely through follow-up Swift-XRT observations, with galaxies from which no sign of nuclear activity has yet been reported in other wavebands. Their mean luminosity is only slightly lower than that of those classed as Seyferts on the basis of optical spectra (1043.53 compared with 1043.75 erg s-1). These are probably low- counterparts to the X-ray bright, optically normal (XBONG) sources discovered in the Chandra and XMM-Newton deep fields (Barger et al., 2005; Comastri et al., 2002).
5.3. Galactic Sources
5.3.1 X-ray Binaries
As can be seen from Table The 22-Month Swift-BAT All-Sky Hard X-Ray Survey, approximately two-thirds of the Galactic sources are X-ray binaries. Of those whose nature is known, about 40% are high mass X-ray binaries, which reflects the BAT’s sensitivity to hard-spectrum X-ray sources. 60% are low mass X-ray binaries, which typically have softer spectra but can have a higher total flux. The low mass X-ray binary population is concentrated near the Galactic plane and bulge, whereas the high mass X-ray binary population is more distributed, including significant contributions from the Magellanic clouds.
The sensitivity of the survey is such that high luminosity sources ( erg s-1) are detectable anywhere in the Galaxy and the catalog is complete for sources that emit continuously at this level. However, since many X-ray binaries are transient it is likely that there are a significant number of additional X-ray binaries that are not seen in the present analysis (which is based on fluxes averaged over 22 months), but that can be detected in specific shorter intervals. This will be the subject of further work. The detection of outbursts from transients that do not repeat, or that repeat only on timescales of several years, should scale approximately linearly with the length of the survey.
5.3.2 CVs and Other Accreting White Dwarf Systems
Accreting white dwarf binaries constitute the second most common category of Galactic sources. Of these, 31 have been identified as cataclysmic variables (CVs) or CV candidates. Of the 31 CVs detected with BAT, 14 are in the Barlow et al. (2006) (INTEGRAL) list, while 17 are new detections in hard X-ray surveys. Because the INTEGRAL catalog goes deeper near the Galactic plane but the BAT catalog is more sensitive at higher latitude, the lists of CVs in the two catalogs are complementary. With the expanded list, we confirm that the hard X-ray selected CVs are dominated by magnetic CVs of the intermediate polar (IP) subtype, also known as DQ Her type stars (see also Brunschweiger et al. (2009)).
In addition, 4 hard X-ray bright symbiotic stars have been detected by BAT, as summarized by Kennea et al. (2007), and there is now a candidate to be the fifth member of the class. Finally, BAT has also detected one Be star, gam Cas, for which an accreting white dwarf companion is one of three possibilities proposed as the origin of the X-ray emission (Kubo et al., 1998).
5.3.3 SNRs and Non-Accretion Powered Pulsars
We detect hard X-ray emission from 8 pulsars and/or their associated Pulsar Wind Nebula (PWN) or supernova remnants (SNRs). Our upper limit on PSR J18460258 is consistent with the flux level at which it was detected in a long INTEGRAL-IBIS observation and reported in Bird et al. (2007). In the case of HESS J1813178 it appears that we are detecting emission that is from the point source seen at lower energies (Funk et al. (2007)) rather than directly related to the slightly extended VHE gamma-ray emission. The only SNR-related source that is not associated with a PWN is Cas A.
5.3.4 The Galactic Center
Because of the limited resolution of the BAT instrument the emission reported as from Sgr A* should be regarded as the net emission from a region of ′ radius centered on the Galactic center. It is possible that a number of sources contribute.
6. Conclusions
The 22 month BAT catalog reinforces and enhances the results from the 3 month (Markwardt et al., 2005) and 9 month (Tueller et al., 2008) catalogs and shows that the BAT survey continues to increase in sensitivity roughly as the square root of time and is far from being confusion or systematics limited. Future papers will discuss the X-ray spectral and timing properties of these sources as well as the nature of the optical identifications, in a manner similar to that of Winter et al. (2008, 2009). We have also obtained extensive optical imaging and spectroscopy of the AGN population (Koss, in preparation; Winter et al. (2009)), more detailed X-ray observations as well as Spitzer IR spectroscopy (Melendez et al., 2009) and radio data which will be presented in future publications. These results will allow the first large scale categorization of the AGN phenomenon from a large uniform and unbiased sample as well as a detailed comparison with results obtained with other selection techniques.
References
- Ajello et al. (2007) Ajello, M., et al. 2007, Deepest Astronomical Surveys, 380, 163
- Ajello et al. (2008) Ajello, M., Greiner, J., Kanbach, G., Rau, A., Strong, A. W., & Kennea, J. A. 2008, ApJ, 678, 102
- Ajello et al. (2009) Ajello, M., et al. 2009, ApJ, 690, 367
- Ajello et al. (2009) Ajello, M., et al. 2009, ApJ, submitted
- Bade et al. (1998) Bade, N., et al. 1998, A&AS, 127, 145
- Barger et al. (2005) Barger, A. J., Cowie, L. L., Mushotzky, R. F., Yang, Y., Wang, W.-H., Steffen, A. T., & Capak, P. 2005, AJ, 129, 578
- Barlow et al. (2006) Barlow, E. J., Knigge, C., Bird, A. J., J Dean, A., Clark, D. J., Hill, A. B., Molina, M., & Sguera, V. 2006, MNRAS, 372, 224
- Barthelmy et al. (2000) Barthelmy, S. D., Cline, T. L., Butterworth, P., Kippen, R. M., Briggs, M. S., Connaughton, V., & Pendleton, G. N. 2000, Gamma-ray Bursts, 5th Huntsville Symposium, 526, 731
- Barthelmy et al. (2005) Barthelmy, S. D., et al. 2005, Space Science Reviews, 120, 143
- Bartlett (1994) Bartlett, Lyle. Ph.D. Thesis, Astronomy Department, University of Maryland College Park.
- Beckmann et al. (2006) Beckmann, V., Gehrels, N., Shrader, C. R., & Soldi, S. 2006, ApJ, 638, 642
- Beckmann et al. (2009) Beckmann, V., et al. 2009, arXiv:0907.0654
- Bikmaev et al. (2006) Bikmaev, I. F., Sunyaev, R. A., Revnivtsev, M. G., & Burenin, R. A. 2006, Astronomy Letters, 32, 221
- Bikmaev et al. (2008) Bikmaev, I. F., Burenin, R. A., Revnivtsev, M. G., Sazonov, S. Y., Sunyaev, R. A., Pavlinsky, M. N., & Sakhibullin, N. A. 2008, Astronomy Letters, 34, 653
- Bodaghee et al. (2006) Bodaghee, A., Walter, R., Zurita Heras, J. A., Bird, A. J., Courvoisier, T. J.-L., Malizia, A., Terrier, R., & Ubertini, P. 2006, A&A, 447, 1027
- Bodaghee et al. (2007) Bodaghee, A., et al. 2007, A&A, 467, 585
- Bird et al. (2007) Bird, A. J., et al. 2007, ApJS, 170, 175
- Brunschweiger et al. (2009) Brunschweiger, J., Greiner, J., Ajello, M., & Osborne, J. 2009, arXiv:0901.3562
- Burenin et al. (2008) Burenin, R. A., Mescheryakov, A. V., Revnivtsev, M. G., Sazonov, S. Y., Bikmaev, I. F., Pavlinsky, M. N., & Sunyaev, R. A. 2008, Astronomy Letters, 34, 367
- Burrows et al. (2005) Burrows, D. N., et al. 2005, Space Science Reviews, 120, 165
- Butler et al. (2009) Butler, S. C., et al. 2009, ApJ, 698, 502
- Caroli et al. (1986) Caroli, E., Stephen, J. B., Spizzichino, A., di Cocco, G., & Natalucci, L. 1986, Data Analysis in Astronomy II, 77
- Chakrabarty et al. (2002) Chakrabarty, D., Wang, Z., Juett, A. M., Lee, J. C., & Roche, P. 2002, ApJ, 573, 789
- Cieslinski et al. (1998) Cieslinski, D., Steiner, J. E., & Jablonski, F. J. 1998, A&AS, 131, 119
- Coe et al. (1994) Coe, M. J., et al. 1994, MNRAS, 270, L57
- Comastri et al. (2002) Comastri, A., et al. 2002, ApJ, 571, 771
- Falanga et al. (2006) Falanga, M., Belloni, T., & Campana, S. 2006, A&A, 456, L5
- Fenimore & Cannon (1981) Fenimore, E. E., & Cannon, T. M. 1981, Appl. Opt., 20, 1858
- Fiore et al. (1999) Fiore, F., Guainazzi, M., & Grandi, P. SAX Cookbook, http://heasarc.gsfc.nasa.gov/docs/sax/abc/saxabc/saxabc.html
- Forman et al. (1978) Forman, W., Jones, C., Cominsky, L., Julien, P., Murray, S., Peters, G., Tananbaum, H., & Giacconi, R. 1978, ApJS, 38, 357
- Funk et al. (2007) Funk, S., et al. 2007, A&A, 470, 249
- Gehrels et al. (2004) Gehrels, N., et al. 2004, ApJ, 611, 1005
- Gilli et al. (2007) Gilli, R., Comastri, A., & Hasinger, G. 2007, A&A, 463, 79
- Homer et al. (2002) Homer, L., Anderson, S. F., Margon, B., Downes, R. A., & Deutsch, E. W. 2002, AJ, 123, 3255
- Ibarra et al. (2009) Ibarra, A., et al. 2009, arXiv:0902.3943
- Israel et al. (2001) Israel, G. L., et al. 2001, A&A, 371, 1018
- Jourdain et al. (2008) Jourdain, E., Götz, D., Westergaard, N. J., Natalucci, L., & Roques, J. P. 2008, Proceedings of the 7th INTEGRAL Workshop. 8 - 11 September 2008 Copenhagen, Denmark. Online at http://pos.sissa.it/cgi-bin/reader/conf.cgi?confid=67, p.144
- Jourdain & Roques (2008) Jourdain, E., & Roques, J. P. 2008, Proceedings of the 7th INTEGRAL Workshop. 8 - 11 September 2008 Copenhagen, Denmark. Online at http://pos.sissa.it/cgi-bin/reader/conf.cgi?confid=67, p.143
- Juett & Chakrabarty (2005) Juett, A. M., & Chakrabarty, D. 2005, ApJ, 627, 926
- Kennea et al. (2007) Kennea, J. A., Mukai, K., Tueller, J., Sokoloski, J., Luna, J., Burrows, D., & Gehrels, N. 2007, Bulletin of the American Astronomical Society, 38, 149
- Krimm et al. (2006) Krimm, H., et al. 2006, The Astronomer’s Telegram, 904, 1
- Krivonos et al. (2007) Krivonos, R., Revnivtsev, M., Lutovinov, A., Sazonov, S., Churazov, E., & Sunyaev, R. 2007, A&A, 475, 775
- Kubo et al. (1998) Kubo, S., Murakami, T., Ishida, M., & Corbet, R. H. D. 1998, PASJ, 50, 417
- Levine et al. (1984) Levine, A. M., et al. 1984, ApJS, 54, 581
- Markwardt et al. (2005) Markwardt, C. B., Tueller, J., Skinner, G. K., Gehrels, N., Barthelmy, S. D., & Mushotzky, R. F. 2005, ApJ, 633, L77
- Masetti et al. (2008) Masetti, N., et al. 2008, A&A, 482, 113
- Masetti et al. (2009) Masetti, N., et al. 2009, A&A, 495, 121
- McBride et al. (2008) McBride, V. A., et al. 2008, A&A, 477, 249
- Melendez et al. (2009) Melendez, M., et al. 2009, American Astronomical Society Meeting Abstracts, 213, #421.10
- Olive et al. (2003) Olive, J.-F., et al. 2003, Gamma-Ray Burst and Afterglow Astronomy 2001: A Workshop Celebrating the First Year of the HETE Mission, 662, 88
- Reig et al. (2008) Reig, P., Belloni, T., Israel, G. L., Campana, S., Gehrels, N., & Homan, J. 2008, A&A, 485, 797
- Renaud et al. (2006) Renaud, M., et al. 2006, ApJ, 647, L41
- Revnivtsev et al. (2004) Revnivtsev, M., Sazonov, S., Jahoda, K., & Gilfanov, M. 2004, A&A, 418, 927
- Rodriguez et al. (2009) Rodriguez, J., Tomsick, J. A., & Chaty, S. 2009, A&A, 494, 417
- Roming et al. (2005) Roming, P. W. A., et al. 2005, Space Science Reviews, 120, 95
- Shafter et al. (2008) Shafter, A. W., Davenport, J. R. A., Güth, T., Kattner, S., Marin, E., & Sreenivasamurthy, N. 2008, PASP, 120, 374
- Skinner (1995) Skinner, G. K. 1995, Experimental Astronomy, 6, 1
- Skinner (2008) Skinner, G. K. 2008, Appl. Opt., 47, 2739
- Steiner et al. (1988) Steiner, J. E., Cieslinski, D., & Jablonski, F. J. 1988, Progress and Opportunities in Southern Hemisphere Optical Astronomy. The CTIO 25th Anniversary Symposium, 1, 67
- Thorstensen et al. (2009) Thorstensen, J. R., Peters, C. S., Sheets, H. A., & Skinner, J. N. 2009, American Astronomical Society Meeting Abstracts, 213, #491.07
- Tomsick et al. (2008) Tomsick, J. A., Chaty, S., Rodriguez, J., Walter, R., & Kaaret, P. 2008, ApJ, 685, 1143
- Treister et al. (2009) Treister, E., Urry, C. M., & Virani, S. 2009, ApJ, 696, 110
- Tueller et al. (2008) Tueller, J., Mushotzky, R. F., Barthelmy, S., Cannizzo, J. K., Gehrels, N., Markwardt, C. B., Skinner, G. K., & Winter, L. M. 2008, ApJ, 681, 113
- Walter et al. (2006) Walter, R., et al. 2006, A&A, 453, 133
- Wilson et al. (2003) Wilson, C. A., Patel, S. K., Kouveliotou, C., Jonker, P. G., van der Klis, M., Lewin, W. H. G., Belloni, T., & Méndez, M. 2003, ApJ, 596, 1220
- Winter et al. (2008) Winter, L. M., Mushotzky, R. F., Tueller, J., & Markwardt, C. 2008, ApJ, 674, 686
- Winter et al. (2009) Winter, L. M., Mushotzky, R. F., Reynolds, C. S., & Tueller, J. 2009, ApJ, 690, 1322
| # | BAT NameaaIf a BAT name exists in the 9-month catalog (Tueller et al., 2008), then that name is used. If there is no 9-month BAT name, then the BAT name listed here is the name that was used to request XRT followup observations (and used in the HEASARC archive). When no previous BAT name for this source exists, we list here a BAT name derived from the BAT position in this catalog. | RAbbThe BAT source positions listed here are all uniformly generated from a blind search of the 22-month data and are J2000 coordinates. | Dec | S/N | Counterpart Name | Other Name | Ctpt RAccThe counterpart position is the most accurate position known of the object in the ’name’ column in J2000 coordinates, and is usually taken from NED or SIMBAD. If no counterpart is known, the blind BAT position is listed. | Ctpt Dec | FluxddThe flux is extracted from the BAT maps at the position listed for the counterpart, is in units of ergs s-1cm-2, and is computed for the 14–195 keV band. | error | CeeThe meaning of the confusion flag is as follows: A = ’Confused’ source, B = ’Confusing’ source, AB = Both confused and confusing. To make sense of this confounding scenario, see §4 and §4.3. | HratffThe hardness ratio is the ratio of the 35–150 keV count rate to the 14–150 keV count rate. | Herr | RedshiftggThe redshifts are taken from the online databases NED and SIMBAD or in a few cases from our own analysis of the optical data. A blank indicates that the object is Galacatic, and a ? indicates that the object has an unknown redshift. | LumhhThe luminosity is computed from the flux and redshift in this table, with units of log[ergs s-1] in the 14–195 keV band. | Type |
|---|---|---|---|---|---|---|---|---|---|---|---|---|---|---|---|---|
| 1 | SWIFT J0006.22012 | 1.555 | 20.192 | 7.05 | MRK 0335 | 1.5813 | 20.2029 | 2.47 | 0.41 | 0.31 | 0.07 | 0.0258 | 43.57 | Sy1.2 | ||
| 2 | SWIFT J0010.51057 | 2.613 | 10.958 | 7.59 | MRK 1501 | 2.6292 | 10.9749 | 4.10 | 0.55 | 0.40 | 0.05 | 0.0893 | 44.91 | Sy1.2 | ||
| 3 | SWIFT J0025.86818 | 6.443 | 68.303 | 5.76 | 2MASX J00253292+6821442 | 6.3870 | 68.3623 | 3.02 | 0.66 | 0.51 | 0.09 | 0.0120 | 42.99 | Sy2 | ||
| 4 | SWIFT J0026.10508 | 6.550 | 5.121 | 5.55 | SWIFT J002615.1+050417 | 6.5631 | 5.0715 | 4.13 | 1.12 | 0.59 | 0.12 | ? | ||||
| 5 | SWIFT J0028.95917 | 7.224 | 59.284 | 24.30 | V709 Cas | RX J0028.8+5917 | 7.2036 | 59.2894 | 8.91 | 0.39 | 0.25 | 0.02 | CV/DQ Her | |||
| 6 | SWIFT J0036.05951 | 9.000 | 59.842 | 5.76 | QSO B0033+595 | 1ES 0033+595 | 8.9694 | 59.8346 | 1.96 | 0.34 | 0.19 | 0.07 | 0.0860 | 44.56 | BL Lac | |
| 7 | SWIFT J0037.26123 | 9.297 | 61.380 | 6.45 | BD +60 73 | IGR J0370+6122 | 9.2902 | 61.3601 | 2.85 | 0.47 | 0.35 | 0.06 | HMXB | |||
| 8 | SWIFT J0042.92332 | 10.745 | 23.503 | 7.00 | NGC 235A | 10.7200 | 23.5410 | 4.12 | 0.48 | 0.35 | 0.05 | 0.0222 | 43.67 | Sy1 | ||
| 9 | SWIFT J0048.83155 | 12.176 | 31.978 | 28.85 | Mrk 348 | 12.1964 | 31.9570 | 13.66 | 0.56 | 0.42 | 0.02 | 0.0150 | 43.84 | Sy2 | ||
| 10 | SWIFT J0051.87320 | 12.953 | 73.328 | 11.40 | RX J0052.1-7319 | 2E 0050.4-7335 | 13.0921 | 73.3181 | 5.70 | 0.42 | 0.28 | 0.03 | HMXB | |||
| 11 | SWIFT J0051.91724 | 12.992 | 17.465 | 7.36 | MRK 1148 | 12.9783 | 17.4329 | 2.80 | 0.41 | 0.24 | 0.06 | 0.0640 | 44.44 | Sy1 | ||
| 12 | SWIFT J0055.44612 | 13.854 | 46.200 | 6.52 | 1RXS J005528.0+461143 | 13.8671 | 46.1953 | 1.97 | 0.28 | 0.10 | 0.07 | CV/DQ Her | ||||
| 13 | SWIFT J0056.76043 | 14.183 | 60.711 | 24.03 | Gamma Cas | 4U 0054+60 | 14.1772 | 60.7167 | 7.08 | 0.26 | 0.08 | 0.02 | Star/Be | |||
| 14 | SWIFT J0059.43150 | 15.007 | 31.828 | 9.50 | Mrk 352 | 14.9720 | 31.8269 | 4.16 | 0.50 | 0.37 | 0.05 | 0.0149 | 43.31 | Sy1 | ||
| 15 | SWIFT J0100.94750 | 15.307 | 47.886 | 6.44 | ESO 195-IG 021 NED03 | 15.1457 | 47.8676 | 2.08 | 0.45 | 0.35 | 0.08 | 0.0483 | 44.06 | Sy1.8 | ||
| 16 | SWIFT J0109.01320 | 17.244 | 13.340 | 8.60 | 3C 033 | 17.2203 | 13.3372 | 4.06 | 0.52 | 0.38 | 0.05 | 0.0597 | 44.54 | Sy2 | ||
| 17 | SWIFT J0113.81450 | 18.449 | 14.841 | 5.49 | MRK 1152 | 18.4587 | 14.8456 | 2.50 | 0.45 | 0.28 | 0.07 | 0.0527 | 44.22 | Sy1.5 | ||
| 18 | SWIFT J0117.86516 | 19.443 | 65.270 | 51.69 | V662 Cas | 4U 0114+65 | 19.5112 | 65.2916 | 17.14 | 0.37 | 0.22 | 0.01 | HMXB/NS | |||
| 19 | SWIFT J0117.87327 | 19.448 | 73.450 | 111.96 | SMC X-1 | 4U 0115-73 | 19.2714 | 73.4433 | 38.20 | 0.29 | 0.08 | 0.00 | HMXB/NS | |||
| 20 | SWIFT J0122.93420 | 20.737 | 34.329 | 5.98 | SHBL J012308.7+342049 | 2E 0120.3+3404 | 20.7860 | 34.3469 | 2.12 | 0.43 | 0.28 | 0.08 | 0.2720 | 45.69 | BL Lac | |
| 21 | SWIFT J0123.83504 | 20.962 | 35.014 | 11.37 | NGC 526A | 20.9766 | 35.0654 | 5.96 | 0.51 | 0.39 | 0.03 | 0.0191 | 43.69 | Sy1.5 | ||
| 22 | SWIFT J0123.95846 | 20.984 | 58.772 | 12.38 | Fairall 9 | 20.9408 | 58.8057 | 5.07 | 0.45 | 0.33 | 0.03 | 0.0470 | 44.42 | Sy1 | ||
| 23 | SWIFT J0124.53350 | 21.126 | 33.827 | 4.80 | NGC 0513 | 21.1119 | 33.7995 | 2.06 | 0.43 | 0.25 | 0.09 | 0.0195 | 43.25 | Sy2 | ||
| 24 | SWIFT J0134.13625 | 23.529 | 36.473 | 6.58 | NGC 0612 | 23.4906 | 36.4933 | 5.35 | 0.61 | 0.50 | 0.05 | 0.0298 | 44.04 | Radio galaxy | ||
| 25 | SWIFT J0138.64001 | 24.688 | 39.951 | 12.97 | ESO 297-018 | 24.6548 | 40.0114 | 7.37 | 0.54 | 0.45 | 0.03 | 0.0252 | 44.03 | Sy2 | ||
| 26 | SWIFT J0146.06143 | 26.512 | 61.718 | 13.28 | PSR J0146+61 | 26.5934 | 61.7509 | 12.29 | 0.89 | 0.65 | 0.04 | AXP | ||||
| 27 | SWIFT J0152.80329 | 28.193 | 3.501 | 5.67 | MCG -01-05-047 | 28.2042 | 3.4468 | 2.78 | 0.46 | 0.28 | 0.07 | 0.0172 | 43.27 | Sy2 | ||
| 28 | SWIFT J0201.00648 | 30.269 | 6.855 | 18.20 | NGC 788 | 30.2769 | 6.8155 | 9.33 | 0.57 | 0.46 | 0.03 | 0.0136 | 43.59 | Sy2 | ||
| 29 | SWIFT J0206.20019 | 31.565 | 0.287 | 5.55 | Mrk 1018 | 31.5666 | 0.2914 | 3.61 | 0.64 | 0.47 | 0.08 | 0.0424 | 44.18 | Sy1.5 | ||
| 30 | SWIFT J0209.75226 | 32.464 | 52.484 | 11.75 | LEDA 138501 | 32.3929 | 52.4425 | 5.48 | 0.53 | 0.37 | 0.04 | 0.0492 | 44.50 | Sy1 | ||
| 31 | SWIFT J0216.35128 | 34.075 | 51.387 | 6.95 | 2MASX J02162987+5126246 | 34.1243 | 51.4402 | 2.93 | 0.48 | 0.34 | 0.07 | ? | likely Sy2 | |||
| 32 | SWIFT J0218.07348 | 34.279 | 73.846 | 6.99 | [HB89] 0212+735 | 34.3784 | 73.8257 | 3.33 | 0.57 | 0.43 | 0.06 | 2.3670 | 48.16 | BL Lac | ||
| 33 | SWIFT J0225.01847 | 36.260 | 18.785 | 5.42 | RBS 0315 | 36.2695 | 18.7802 | 2.71 | 0.60 | 0.42 | 0.08 | 2.6900 | 48.21 | BL Lac | ||
| 34 | SWIFT J0228.13118 | 37.024 | 31.299 | 14.34 | NGC 931 | 37.0603 | 31.3117 | 6.56 | 0.50 | 0.30 | 0.03 | 0.0167 | 43.61 | Sy1.5 | ||
| 35 | SWIFT J0231.63645 | 37.969 | 36.680 | 6.09 | IC 1816 | 37.9625 | 36.6721 | 2.58 | 0.48 | 0.39 | 0.07 | 0.0170 | 43.22 | Sy1.8 | ||
| 36 | SWIFT J0234.13233 | 38.513 | 32.576 | 5.69 | NGC 0973 | 38.5838 | 32.5056 | 3.09 | 0.58 | 0.42 | 0.08 | 0.0162 | 43.26 | Sy2 | ||
| 37 | SWIFT J0234.60848 | 38.658 | 8.758 | 7.70 | NGC 985 | 38.6574 | 8.7876 | 3.45 | 0.46 | 0.33 | 0.05 | 0.0430 | 44.17 | Sy1 | ||
| 38 | SWIFT J0235.32934 | 38.784 | 29.617 | 7.91 | ESO 416-G002 | 38.8061 | 29.6047 | 3.40 | 0.60 | 0.46 | 0.06 | 0.0592 | 44.46 | Sy1.9 | ||
| 39 | SWIFT J0238.25213 | 39.518 | 52.175 | 10.17 | ESO 198-024 | 39.5821 | 52.1923 | 4.98 | 0.50 | 0.41 | 0.04 | 0.0455 | 44.38 | Sy1 | ||
| 40 | SWIFT J0240.56118 | 40.132 | 61.307 | 7.04 | LS I +61 303 | V615 Cas | 40.1319 | 61.2293 | 3.09 | 0.52 | 0.35 | 0.06 | HMXB | |||
| 41 | SWIFT J0241.30816 | 40.326 | 8.272 | 7.08 | NGC 1052 | 40.2700 | 8.2558 | 3.75 | 0.67 | 0.43 | 0.07 | 0.0050 | 42.32 | Sy2 | ||
| 42 | SWIFT J0242.60000 | 40.638 | 0.000 | 7.07 | NGC 1068 | 40.6696 | 0.0133 | 3.72 | 0.53 | 0.37 | 0.06 | 0.0038 | 42.07 | Sy2 | ||
| 43 | SWIFT J0244.86227 | 41.172 | 62.441 | 16.54 | [HB89] 0241+622 | 41.2404 | 62.4685 | 8.59 | 0.57 | 0.39 | 0.03 | 0.0440 | 44.59 | Sy1 | ||
| 44 | SWIFT J0249.12627 | 42.275 | 26.455 | 6.00 | 2MASX J02485937+2630391 | 42.2472 | 26.5109 | 3.91 | 0.82 | 0.47 | 0.08 | 0.0579 | 44.50 | Sy2 | ||
| 45 | SWIFT J0251.35441 | 42.684 | 54.722 | 5.18 | 2MFGC 02280 | 42.6775 | 54.7049 | 3.30 | 0.57 | 0.43 | 0.08 | 0.0152 | 43.23 | Galaxy | ||
| 46 | SWIFT J0252.70822 | 43.064 | 8.534 | 5.10 | MCG -02-08-014 | 43.0975 | 8.5104 | 2.43 | 0.47 | 0.28 | 0.08 | 0.0168 | 43.19 | Sy2, hidden | ||
| 47 | SWIFT J0255.20011 | 43.774 | 0.199 | 17.53 | NGC 1142 | 43.8008 | 0.1836 | 10.13 | 0.60 | 0.43 | 0.02 | 0.0289 | 44.29 | Sy2 | ||
| 48 | SWIFT J0256.21925 | 44.047 | 19.408 | 7.11 | XY Ari | 2E 0253.3+1914 | 44.0375 | 19.4414 | 3.12 | 0.46 | 0.28 | 0.06 | CV/DQ Her | |||
| 49 | SWIFT J0256.43212 | 44.115 | 32.230 | 7.29 | ESO 417- G 006 | 44.0898 | 32.1856 | 3.06 | 0.46 | 0.36 | 0.06 | 0.0163 | 43.26 | Sy2 | ||
| 50 | SWIFT J0304.10108 | 45.951 | 1.096 | 7.47 | NGC 1194 | LEDA 11537 | 45.9546 | 1.1037 | 3.64 | 0.60 | 0.43 | 0.07 | 0.0136 | 43.18 | Sy1 | |
| 51 | SWIFT J0311.13241 | 47.778 | 32.685 | 4.89 | 2MASX J03104435+3239296 | 47.6850 | 32.6580 | 1.85 | 0.44 | 0.28 | 0.10 | 0.1270 | 44.89 | Sy | ||
| 52 | SWIFT J0311.52045 | 47.855 | 20.706 | 5.28 | RX J0311.3-2046 | 47.8284 | 20.7717 | 2.98 | 0.60 | 0.50 | 0.08 | 0.0660 | 44.50 | Sy1.5 | ||
| 53 | SWIFT J0318.76828 | 49.620 | 68.477 | 4.85 | 2MASX J03181899+6829322 | 49.5791 | 68.4921 | 3.16 | 0.58 | 0.40 | 0.07 | 0.0901 | 44.81 | Sy1.9 | ||
| 54 | SWIFT J0319.74132 | 49.960 | 41.515 | 24.24 | NGC 1275 | 49.9507 | 41.5117 | 6.85 | 0.28 | 0.14 | 0.02 | 0.0176 | 43.68 | Sy2 | ||
| 55 | SWIFT J0324.83410 | 51.198 | 34.168 | 5.91 | B2 0321+33 NED02 | 51.1715 | 34.1794 | 4.83 | 0.83 | 0.50 | 0.07 | 0.0610 | 44.64 | Sy1 | ||
| 56 | SWIFT J0324.94044 | 51.270 | 40.703 | 6.29 | UGC 02724 | 51.3565 | 40.7731 | 2.86 | 0.58 | 0.38 | 0.08 | 0.0477 | 44.19 | Sy2 binary AGN | ||
| 57 | SWIFT J0328.42846 | 52.138 | 28.753 | 5.15 | PKS 0326-288 | 52.1522 | 28.6989 | 3.25 | 0.73 | 0.54 | 0.09 | 0.1080 | 44.99 | Sy1.9 | ||
| 58 | SWIFT J0329.31320 | 52.335 | 13.397 | 4.84 | SWIFT J0329.3-1320 | 52.3347 | 13.3966 | 2.09 | 0.63 | 0.43 | 0.09 | |||||
| 59 | SWIFT J0331.14355 | 52.775 | 43.923 | 13.69 | GK Per | 3A 0327+438 | 52.7993 | 43.9047 | 4.83 | 0.35 | 0.18 | 0.04 | CV/DQ Her | |||
| 60 | SWIFT J0333.63607 | 53.377 | 36.111 | 20.10 | NGC 1365 | 53.4016 | 36.1404 | 7.19 | 0.44 | 0.35 | 0.02 | 0.0055 | 42.68 | Sy1.8 | ||
| 61 | SWIFT J0334.95308 | 53.737 | 53.132 | 312.24 | BQ Cam | EXO 0331+530 | 53.7495 | 53.1732 | 90.31 | 0.27 | 0.08 | 0.00 | HMXB/NS | |||
| 62 | SWIFT J0336.63217 | 54.146 | 32.281 | 6.55 | 4C 32.14 | 54.1255 | 32.3082 | 3.09 | 0.51 | 0.34 | 0.06 | 1.2580 | 47.45 | QSO | ||
| 63 | SWIFT J0336.52509 | 54.200 | 25.243 | 5.36 | ESO 482-14 | SWIFT J0336.8-2515 | 54.2632 | 25.2492 | 2.25 | 0.56 | 0.42 | 0.08 | 0.0437 | 44.00 | Sy2 | |
| 64 | SWIFT J0342.02115 | 55.477 | 21.207 | 9.64 | ESO 548-G081 | 55.5155 | 21.2444 | 4.57 | 0.49 | 0.40 | 0.04 | 0.0145 | 43.33 | Sy1 | ||
| 65 | SWIFT J0349.21159 | 57.320 | 11.954 | 7.28 | QSO B0347-121 | 1ES 0347-12.1 | 57.3467 | 11.9908 | 2.84 | 0.44 | 0.27 | 0.06 | 0.1800 | 45.41 | BL Lac | |
| 66 | SWIFT J0350.15019 | 57.601 | 50.328 | 7.03 | 2MASX J03502377-5018354 | 57.5990 | 50.3099 | 3.09 | 0.49 | 0.42 | 0.06 | 0.0365 | 43.98 | SyX 6df | ||
| 67 | SWIFT J0353.46830 | 58.148 | 68.531 | 5.24 | PKS 0352-686 | 58.2396 | 68.5214 | 1.65 | 0.37 | 0.26 | 0.08 | 0.0870 | 44.49 | BL Lac | ||
| 68 | SWIFT J0353.73711 | 58.483 | 37.190 | 5.21 | 2MASX J03534246+3714077 | 58.4270 | 37.2350 | 1.72 | 0.45 | 0.27 | 0.09 | 0.0183 | 43.11 | Sy2 | ||
| 69 | SWIFT J0355.53101 | 58.882 | 31.025 | 106.34 | X Per | 4U 0352+309 | 58.8462 | 31.0458 | 60.13 | 0.58 | 0.36 | 0.00 | HMXB/NS | |||
| 70 | SWIFT J0402.41807 | 60.600 | 18.102 | 5.20 | ESO 549- G 049 | 60.6070 | 18.0480 | 2.65 | 0.61 | 0.57 | 0.11 | 0.0263 | 43.62 | Sy2 LINER | ||
| 71 | SWIFT J0407.40339 | 61.837 | 3.748 | 6.92 | 3C 105 | 61.8186 | 3.7072 | 3.89 | 0.62 | 0.37 | 0.06 | 0.0890 | 44.89 | Sy2 | ||
| 72 | SWIFT J0414.80754 | 63.687 | 7.971 | 5.58 | IRAS 04124-0803 | 63.7195 | 7.9278 | 2.52 | 0.48 | 0.31 | 0.07 | 0.0379 | 43.93 | Sy1 | ||
| 73 | SWIFT J0418.33800 | 64.595 | 38.032 | 25.59 | 3C 111.0 | 64.5887 | 38.0266 | 14.12 | 0.61 | 0.40 | 0.02 | 0.0485 | 44.89 | Sy1 | ||
| 74 | SWIFT J0422.75611 | 65.644 | 56.223 | 5.26 | ESO 157- G 023 | 65.6008 | 56.2260 | 3.02 | 0.49 | 0.44 | 0.07 | 0.0435 | 44.13 | Sy2 | ||
| 75 | SWIFT J0426.25711 | 66.495 | 57.181 | 5.04 | 1H 0419-577 | 66.5035 | 57.2001 | 2.11 | 0.33 | 0.23 | 0.07 | 0.1040 | 44.77 | Sy1 | ||
| 76 | SWIFT J0431.36127 | 67.822 | 61.458 | 5.10 | ABELL 3266 | 67.7997 | 61.4063 | 1.23 | 0.22 | 0.16 | 0.09 | 0.0589 | 44.01 | Galaxy cluster | ||
| 77 | SWIFT J0433.00521 | 68.262 | 5.386 | 19.22 | 3C 120 | 68.2962 | 5.3543 | 11.89 | 0.63 | 0.39 | 0.02 | 0.0330 | 44.48 | Sy1 | ||
| 78 | SWIFT J0438.21048 | 69.554 | 10.837 | 5.85 | MCG -02-12-050 | 69.5591 | 10.7959 | 2.11 | 0.40 | 0.23 | 0.08 | 0.0364 | 43.81 | Sy1.2 | ||
| 79 | SWIFT J0443.92856 | 70.983 | 28.940 | 4.88 | UGC 03142 | 70.9450 | 28.9718 | 3.43 | 0.63 | 0.42 | 0.08 | 0.0217 | 43.56 | Sy1 | ||
| 80 | SWIFT J0444.12813 | 71.029 | 28.229 | 10.28 | 2MASX J04440903+2813003 | 71.0376 | 28.2168 | 7.02 | 0.69 | 0.44 | 0.04 | 0.0113 | 43.30 | Sy2 | ||
| 81 | SWIFT J0450.75813 | 72.869 | 58.205 | 5.44 | RBS 594 | 72.9335 | 58.1835 | 3.17 | 0.60 | 0.48 | 0.08 | 0.0907 | 44.82 | Sy1.5 | ||
| 82 | SWIFT J0452.24933 | 73.019 | 49.566 | 13.24 | 1RXS J045205.0+493248 | 73.0208 | 49.5459 | 6.87 | 0.56 | 0.39 | 0.03 | 0.0290 | 44.12 | Sy1 | ||
| 83 | SWIFT J0453.40404 | 73.312 | 4.094 | 6.45 | CGCG 420-015 | 73.3573 | 4.0616 | 4.08 | 0.68 | 0.47 | 0.08 | 0.0294 | 43.91 | Sy2 | ||
| 84 | SWIFT J0456.37532 | 74.065 | 75.538 | 4.86 | ESO 033- G 002 | 73.9957 | 75.5412 | 2.61 | 0.45 | 0.33 | 0.07 | 0.0181 | 43.29 | Sy2 | ||
| 85 | SWIFT J0503.02302 | 75.727 | 23.004 | 6.14 | LEDA 097068 | 75.7426 | 22.9977 | 3.41 | 0.63 | 0.35 | 0.07 | 0.0577 | 44.43 | Sy1 | ||
| 86 | SWIFT J0505.82351 | 76.455 | 23.861 | 13.95 | 2MASX J05054575-2351139 | 76.4405 | 23.8539 | 7.16 | 0.54 | 0.43 | 0.03 | 0.0350 | 44.31 | Sy2 HII | ||
| 87 | SWIFT J0510.71629 | 77.688 | 16.477 | 15.72 | IRAS 05078+1626 | 4U 0517+17 | 77.6896 | 16.4989 | 9.34 | 0.68 | 0.38 | 0.03 | 0.0179 | 43.83 | Sy1.5 | |
| 88 | SWIFT J0514.24002 | 78.559 | 40.030 | 14.07 | NGC 1851 XRB | 4U 0513-40 | 78.5275 | 40.0436 | 4.01 | 0.26 | 0.17 | 0.03 | LMXB/NS | |||
| 89 | SWIFT J0516.20009 | 79.001 | 0.143 | 14.12 | Ark 120 | 79.0476 | 0.1498 | 7.08 | 0.57 | 0.36 | 0.03 | 0.0323 | 44.23 | Sy1 | ||
| 90 | SWIFT J0501.93239 | 79.865 | 32.686 | 13.78 | ESO 362-18 | 79.8993 | 32.6578 | 6.22 | 0.52 | 0.43 | 0.03 | 0.0125 | 43.33 | Sy1.5 | ||
| 91 | SWIFT J0519.54545 | 79.973 | 45.802 | 8.82 | PICTOR A | 79.9570 | 45.7790 | 3.78 | 0.46 | 0.38 | 0.04 | 0.0351 | 44.03 | Sy1/LINER | ||
| 92 | SWIFT J0520.97156 | 80.226 | 71.930 | 5.85 | LMC X-2 | 4U 0520-72 | 80.1168 | 71.9648 | 1.65 | 0.16 | 0.00 | 0.08 | LMXB | |||
| 93 | SWIFT J0519.53140 | 80.762 | 36.458 | 7.74 | PKS 0521-36 | 80.7416 | 36.4586 | 3.42 | 0.49 | 0.47 | 0.05 | 0.0553 | 44.40 | BL Lac | ||
| 94 | SWIFT J0524.11210 | 80.988 | 12.187 | 5.93 | IRAS 05218-1212 | 81.0271 | 12.1666 | 2.50 | 0.54 | 0.37 | 0.08 | 0.0490 | 44.15 | Sy1 | ||
| 95 | SWIFT J0529.23247 | 82.408 | 32.859 | 18.98 | TV Col | 3A 0527-329 | 82.3560 | 32.8179 | 5.11 | 0.29 | 0.19 | 0.02 | CV/DQ Her | |||
| 96 | SWIFT J0532.56623 | 83.129 | 66.391 | 77.12 | LMC X-4 | 4U 0532-664 | 83.2075 | 66.3705 | 31.64 | 0.34 | B | 0.15 | 0.00 | HMXB/NS | ||
| 97 | ” | ” | ” | ” | RX J0531.2-6609 | IGR J05319-6601 | 82.8054 | 66.1181 | 4.99 | A | 0.20 | HMXB/NS | ||||
| 98 | SWIFT J0534.62204 | 83.644 | 22.067 | 3282.76 | Crab Nebula/Pulsar | 83.6332 | 22.0145 | 2386.15 | 0.66 | 0.35 | 0.00 | PSR/PWN | ||||
| 99 | SWIFT J0538.82620 | 84.689 | 26.326 | 132.18 | V725 Tau | 3A 0535+262 | 84.7274 | 26.3158 | 81.41 | 0.51 | 0.20 | 0.00 | HMXB/NS | |||
| 100 | SWIFT J0539.06406 | 84.762 | 64.098 | 7.08 | LMC X-3 | 4U 0538-64 | 84.7342 | 64.0823 | 3.11 | 0.48 | 0.32 | 0.06 | HMXB/NS | |||
| 101 | SWIFT J0539.56943 | 84.869 | 69.720 | 9.22 | LMC X-1 | 4U 0540-69 | 84.9113 | 69.7433 | 3.98 | 0.39 | 0.25 | 0.04 | HMXB/NS | |||
| 102 | SWIFT J0539.96919 | 84.970 | 69.320 | 8.41 | PSR B0540-69 | 85.0322 | 69.3348 | 4.80 | 0.53 | 0.38 | 0.04 | PSR | ||||
| 103 | SWIFT J0539.92839 | 84.986 | 28.692 | 7.12 | [HB89] 0537-286 | 84.9762 | 28.6655 | 5.06 | 0.69 | 0.59 | 0.07 | 3.1040 | 48.63 | Blazar | ||
| 104 | SWIFT J0542.66051 | 85.648 | 60.842 | 7.03 | BY Cam | 4U 0541+60 | 85.7038 | 60.8588 | 2.91 | 0.42 | 0.21 | 0.06 | CV/AM Her | |||
| 105 | SWIFT J0543.24104 | 85.796 | 41.063 | 6.08 | TX Col | 1H 0542-407 | 85.8343 | 41.0320 | 1.80 | 0.26 | 0.13 | 0.07 | CV/DQ Her | |||
| 106 | SWIFT J0543.92749 | 85.937 | 27.617 | 4.90 | MCG -05-14-012 | 85.8873 | 27.6514 | 2.05 | 0.44 | 0.36 | 0.08 | 0.0099 | 42.65 | Galaxy | ||
| 107 | SWIFT J0544.45909 | 86.083 | 59.154 | 5.23 | 2MASX J05442257+5907361 | 86.0941 | 59.1267 | 2.54 | 0.67 | 0.38 | 0.09 | 0.0660 | 44.43 | Sy1.9 | ||
| 108 | SWIFT J0550.73212 | 87.689 | 32.279 | 9.05 | PKS 0548-322 | 87.6699 | 32.2716 | 3.28 | 0.43 | 0.33 | 0.05 | 0.0690 | 44.58 | BL Lac | ||
| 109 | SWIFT J0552.20727 | 88.050 | 7.440 | 54.89 | NGC 2110 | 88.0474 | 7.4562 | 35.01 | 0.70 | 0.43 | 0.01 | 0.0078 | 43.67 | Sy2 | ||
| 110 | SWIFT J0554.84625 | 88.736 | 46.478 | 16.32 | MCG +08-11-011 | 88.7234 | 46.4393 | 9.64 | 0.61 | 0.37 | 0.02 | 0.0205 | 43.96 | Sy1.5 | ||
| 111 | SWIFT J0558.05352 | 89.501 | 53.871 | 8.20 | V405 Aur | RX J0558.0+5353 | 89.4970 | 53.8958 | 3.17 | 0.37 | 0.15 | 0.05 | CV/DQ Her | |||
| 112 | SWIFT J0557.93822 | 89.501 | 38.302 | 10.44 | 2MASX J05580206-3820043 | 4U 0557-38 | 89.5083 | 38.3346 | 3.99 | 0.37 | 0.27 | 0.04 | 0.0339 | 44.02 | Sy1 | |
| 113 | SWIFT J0602.22829 | 90.572 | 28.471 | 7.89 | IRAS 05589+2828 | 90.5446 | 28.4728 | 6.82 | 0.84 | 0.38 | 0.05 | 0.0330 | 44.23 | Sy1 | ||
| 114 | SWIFT J0601.98636 | 91.494 | 86.603 | 6.41 | ESO 005- G 004 | 91.4235 | 86.6319 | 4.48 | 0.60 | 0.49 | 0.07 | 0.0062 | 42.59 | Sy2 | ||
| 115 | SWIFT J0615.87101 | 94.005 | 71.013 | 25.20 | Mrk 3 | 93.9015 | 71.0375 | 15.65 | 0.61 | 0.47 | 0.02 | 0.0135 | 43.81 | Sy2 | ||
| 116 | SWIFT J0617.20907 | 94.290 | 9.125 | 87.32 | V1055 Ori | 4U 0614+091 | 94.2804 | 9.1369 | 51.72 | 0.62 | 0.30 | 0.00 | LMXB/NS | |||
| 117 | SWIFT J0623.83215 | 95.920 | 32.200 | 6.56 | ESO 426- G 002 | 95.9434 | 32.2166 | 2.72 | 0.45 | 0.40 | 0.07 | 0.0224 | 43.49 | Sy2 | ||
| 118 | SWIFT J0640.42554 | 100.024 | 25.864 | 10.94 | ESO 490-IG026 | 100.0487 | 25.8954 | 4.29 | 0.45 | 0.31 | 0.04 | 0.0248 | 43.78 | Sy1.2 | ||
| 119 | SWIFT J0640.14328 | 100.234 | 43.340 | 5.16 | 2MASX J06403799-4321211 | 100.1583 | 43.3558 | 2.00 | 0.46 | 0.37 | 0.09 | ? | Galaxy | |||
| 120 | SWIFT J0641.33257 | 100.285 | 32.880 | 6.59 | 2MASX J06411806+3249313 | 100.3252 | 32.8254 | 4.76 | 0.93 | 0.46 | 0.07 | 0.0470 | 44.39 | Sy2 | ||
| 121 | SWIFT J0651.97426 | 103.020 | 74.457 | 15.85 | Mrk 6 | 103.0511 | 74.4271 | 7.61 | 0.55 | 0.42 | 0.03 | 0.0188 | 43.78 | Sy1.5 | ||
| 122 | SWIFT J0655.83957 | 103.959 | 39.957 | 6.29 | UGC 03601 | 103.9564 | 40.0002 | 4.38 | 0.67 | 0.40 | 0.06 | 0.0171 | 43.46 | Sy1.5 | ||
| 123 | SWIFT J0731.50957 | 112.866 | 9.955 | 5.80 | BG CMi | 3A 0729+103 | 112.8708 | 9.9396 | 2.15 | 0.40 | 0.17 | 0.07 | CV/DQ Her | |||
| 124 | SWIFT J0732.51331 | 113.134 | 13.516 | 9.29 | SWIFT J073237.6-133109 | SWIFT J0732.5-1331 | 113.1563 | 13.5178 | 2.97 | 0.37 | 0.19 | 0.05 | CV/DQ Her | |||
| 125 | SWIFT J0742.54948 | 115.675 | 49.826 | 10.57 | Mrk 79 | 115.6367 | 49.8097 | 4.89 | 0.52 | 0.37 | 0.04 | 0.0222 | 43.74 | Sy1.2 | ||
| 126 | SWIFT J0746.32548 | 116.608 | 25.814 | 8.10 | SDSS J074625.87+254902.2 | 116.6078 | 25.8173 | 7.79 | 1.01 | 0.61 | 0.06 | 2.9793 | 48.77 | Blazar | ||
| 127 | SWIFT J0747.56057 | 116.898 | 60.970 | 5.05 | MRK 10 | 116.8714 | 60.9335 | 3.12 | 0.54 | 0.46 | 0.07 | 0.0293 | 43.79 | Sy1.2 | ||
| 128 | SWIFT J0748.86743 | 117.207 | 67.722 | 76.87 | UY Vol | EXO 0748-676 | 117.1388 | 67.7500 | 34.49 | 0.44 | 0.31 | 0.00 | LMXB/NS | |||
| 129 | SWIFT J0750.91439 | 117.816 | 14.731 | 7.22 | PQ Gem | RX J0751.2+1444 | 117.8225 | 14.7402 | 3.03 | 0.39 | 0.12 | 0.06 | CV/DQ Her | |||
| 130 | SWIFT J0759.83844 | 119.893 | 38.749 | 10.03 | 2MASS J07594181-3843560 | IGR J07597-3842 | 119.9208 | 38.7600 | 5.62 | 0.56 | 0.38 | 0.04 | 0.0400 | 44.32 | Sy1.2 | |
| 131 | SWIFT J0800.52327 | 120.028 | 23.419 | 6.88 | 2MASX J07595347+2323241 | CGCG 118-036 | 119.9728 | 23.3901 | 4.28 | 0.72 | 0.51 | 0.07 | 0.0292 | 43.92 | Sy2 | |
| 132 | SWIFT J0800.12638 | 120.080 | 26.638 | 5.37 | IC 0486 | 120.0874 | 26.6135 | 3.22 | 0.70 | 0.42 | 0.07 | 0.0269 | 43.73 | Sy1 | ||
| 133 | SWIFT J0804.20507 | 121.024 | 5.054 | 11.50 | Phoenix Galaxy | 121.0244 | 5.1138 | 5.34 | 0.57 | 0.35 | 0.04 | 0.0135 | 43.34 | Sy2 | ||
| 134 | SWIFT J0823.40457 | 125.810 | 4.908 | 5.30 | FAIRALL 0272 | 125.7546 | 4.9349 | 4.02 | 0.71 | 0.57 | 0.08 | 0.0218 | 43.64 | Sy2 | ||
| 135 | SWIFT J0826.27033 | 126.598 | 70.562 | 5.19 | 1RXS J082623.5-703142 | 1ES 0826-703 | 126.5979 | 70.5283 | 2.08 | 0.36 | 0.22 | 0.08 | SRC/X-ray | |||
| 136 | SWIFT J0835.24513 | 128.807 | 45.219 | 29.44 | Vela Pulsar | PSR B0833-45 | 128.8361 | 45.1764 | 18.19 | 0.56 | 0.40 | 0.01 | PSR | |||
| 137 | SWIFT J0838.04839 | 129.507 | 48.655 | 7.78 | EI UMa | RX J0838.3+4838 | 129.5916 | 48.6338 | 3.21 | 0.36 | 0.23 | 0.05 | CV/DQ Her | |||
| 138 | SWIFT J0838.43557 | 129.590 | 35.955 | 5.19 | FAIRALL 1146 | 129.6283 | 35.9926 | 3.27 | 0.51 | 0.30 | 0.06 | 0.0316 | 43.87 | Sy1.5 | ||
| 139 | SWIFT J0839.61213 | 129.944 | 12.218 | 6.00 | 3C 206 | 129.9609 | 12.2428 | 2.87 | 0.51 | 0.37 | 0.07 | 0.1976 | 45.51 | QSO | ||
| 140 | SWIFT J0841.47052 | 130.317 | 70.932 | 16.54 | [HB89] 0836+710 | 130.3515 | 70.8951 | 8.48 | 0.57 | 0.48 | 0.03 | 2.1720 | 48.48 | Blazar | ||
| 141 | SWIFT J0902.14034 | 135.517 | 40.574 | 1074.22 | VELA X-1 | 4U 0900-40 | 135.5286 | 40.5547 | 393.20 | 0.37 | 0.14 | 0.00 | HMXB/NS | |||
| 142 | SWIFT J0904.35538 | 136.039 | 55.626 | 5.51 | 2MASX J09043699+5536025 | 136.1540 | 55.6008 | 1.91 | 0.40 | 0.32 | 0.08 | 0.0370 | 43.78 | Sy1 | ||
| 143 | SWIFT J0908.90933 | 137.222 | 9.542 | 6.11 | ABELL 0754 | 137.2087 | 9.6366 | 1.76 | 0.23 | 0.00 | 0.10 | 0.0542 | 44.09 | Galaxy cluster | ||
| 144 | SWIFT J0911.24533 | 137.821 | 45.546 | 6.11 | 2MASX J09112999+4528060 | 137.8749 | 45.4683 | 1.81 | 0.44 | 0.30 | 0.08 | 0.0268 | 43.47 | Sy2 | ||
| 145 | SWIFT J0917.26221 | 139.137 | 62.288 | 8.24 | IRAS 09149-6206 | 139.0392 | 62.3249 | 3.26 | 0.46 | 0.32 | 0.05 | 0.0573 | 44.41 | Sy1 | ||
| 146 | SWIFT J0918.51618 | 139.637 | 16.315 | 8.09 | Mrk 704 | 139.6084 | 16.3053 | 3.63 | 0.51 | 0.35 | 0.05 | 0.0292 | 43.85 | Sy1.5 | ||
| 147 | SWIFT J0920.55511 | 140.122 | 55.191 | 18.57 | 2MASS J09202647-5512244 | 4U 0919-54 | 140.1105 | 55.2070 | 9.00 | 0.42 | 0.28 | 0.02 | LMXB | |||
| 148 | SWIFT J0920.80805 | 140.174 | 8.111 | 8.91 | MCG -01-24-012 | 140.1927 | 8.0561 | 4.58 | 0.51 | 0.33 | 0.05 | 0.0196 | 43.60 | Sy2 | ||
| 149 | SWIFT J0923.72255 | 140.921 | 22.947 | 10.19 | MCG +04-22-042 | 140.9292 | 22.9090 | 4.46 | 0.59 | 0.39 | 0.05 | 0.0323 | 44.03 | Sy1.2 | ||
| 150 | SWIFT J0924.23141 | 141.043 | 31.676 | 5.42 | 2MASX J09235371-3141305 | 140.9739 | 31.6919 | 1.77 | 0.41 | 0.22 | 0.09 | 0.0422 | 43.87 | Sy1.9 | ||
| 151 | SWIFT J0925.05218 | 141.321 | 52.292 | 14.14 | Mrk 110 | 141.3036 | 52.2863 | 6.15 | 0.47 | 0.39 | 0.03 | 0.0353 | 44.25 | Sy1 | ||
| 152 | SWIFT J0926.21244 | 141.548 | 12.740 | 5.12 | MRK 0705 | 141.5137 | 12.7343 | 2.13 | 0.45 | 0.30 | 0.09 | 0.0291 | 43.62 | Sy1.2 | ||
| 153 | SWIFT J0945.61420 | 146.434 | 14.313 | 8.95 | NGC 2992 | 146.4252 | 14.3264 | 4.82 | 0.63 | 0.41 | 0.05 | 0.0077 | 42.80 | Sy2 | ||
| 154 | SWIFT J0947.63057 | 146.893 | 30.979 | 41.91 | MCG -05-23-016 | 146.9173 | 30.9489 | 20.77 | 0.56 | 0.35 | 0.01 | 0.0085 | 43.52 | Sy2 | ||
| 155 | SWIFT J0947.70726 | 146.934 | 7.429 | 4.87 | 3C 227 | 146.9380 | 7.4224 | 2.65 | 0.50 | 0.35 | 0.08 | 0.0858 | 44.69 | Sy1 BLRG | ||
| 156 | SWIFT J0950.57318 | 147.619 | 73.294 | 4.80 | VII Zw 292 | 147.4410 | 73.2400 | 1.74 | AB | 0.38 | 0.0581 | 44.15 | NLRG | |||
| 157 | ” | ” | ” | ” | RIXOS F305-011 | 147.8070 | 73.3100 | 1.47 | AB | 0.39 | 0.2510 | 45.45 | AGN | |||
| 158 | SWIFT J0959.52248 | 149.861 | 22.854 | 17.16 | NGC 3081 | 149.8731 | 22.8263 | 10.24 | 0.67 | 0.42 | 0.03 | 0.0080 | 43.16 | Sy2 | ||
| 159 | SWIFT J1001.75543 | 150.423 | 55.716 | 7.40 | NGC 3079 | 150.4908 | 55.6798 | 3.44 | 0.44 | 0.43 | 0.05 | 0.0037 | 42.02 | Sy2 | ||
| 160 | SWIFT J1009.34250 | 152.415 | 42.834 | 5.33 | ESO 263- G 013 | 152.4509 | 42.8112 | 2.61 | 0.51 | 0.30 | 0.07 | 0.0333 | 43.82 | Sy2 | ||
| 161 | SWIFT J1010.05819 | 152.497 | 58.312 | 17.65 | GRO J1008-57 | 152.4417 | 58.2917 | 7.49 | 0.40 | 0.21 | 0.02 | HMXB | ||||
| 162 | SWIFT J1010.15747 | 152.774 | 57.808 | 5.16 | CD-57 3057 | IGR J10109-5746 | 152.7623 | 57.8039 | 2.25 | 0.36 | 0.13 | 0.07 | Symb/WD | |||
| 163 | SWIFT J1013.53601 | 153.368 | 35.988 | 5.23 | ESO 374- G 044 | 153.3330 | 35.9827 | 2.82 | 0.60 | 0.39 | 0.08 | 0.0284 | 43.72 | Sy2 | ||
| 164 | SWIFT J1023.51952 | 155.887 | 19.840 | 29.54 | NGC 3227 | 155.8774 | 19.8651 | 14.13 | 0.50 | 0.38 | 0.01 | 0.0039 | 42.67 | Sy1.5 | ||
| 165 | SWIFT J1031.73451 | 157.911 | 34.854 | 16.57 | NGC 3281 | 157.9670 | 34.8537 | 9.01 | 0.66 | 0.43 | 0.03 | 0.0107 | 43.36 | Sy2 | ||
| 166 | SWIFT J1038.84942 | 159.645 | 49.769 | 5.98 | 2MASX J10384520-4946531 | 159.6883 | 49.7816 | 4.89 | 0.76 | 0.55 | 0.07 | 0.0600 | 44.63 | Sy1 | ||
| 167 | SWIFT J1040.74619 | 160.096 | 46.489 | 6.21 | LEDA 093974 | 160.0939 | 46.4238 | 3.68 | 0.65 | 0.39 | 0.07 | 0.0239 | 43.68 | Sy2 | ||
| 168 | SWIFT J1049.42258 | 162.402 | 23.004 | 7.10 | Mrk 417 | 162.3789 | 22.9644 | 3.74 | 0.51 | 0.46 | 0.06 | 0.0328 | 43.97 | Sy2 | ||
| 169 | SWIFT J1052.81043 | 163.115 | 10.724 | 5.32 | 2MASX J10523297+1036205 | 163.1370 | 10.6060 | 2.60 | 0.61 | 0.51 | 0.09 | 0.0878 | 44.70 | Sy1 | ||
| 170 | SWIFT J1104.43812 | 166.144 | 38.212 | 63.14 | Mrk 421 | 166.1138 | 38.2088 | 19.19 | 0.31 | 0.24 | 0.01 | 0.0300 | 44.60 | BL Lac | ||
| 171 | SWIFT J1106.57234 | 166.716 | 72.545 | 30.47 | NGC 3516 | 166.6979 | 72.5686 | 12.54 | 0.45 | 0.42 | 0.01 | 0.0088 | 43.34 | Sy1.5 | ||
| 172 | SWIFT J1120.96037 | 170.235 | 60.619 | 249.54 | Cen X-3 | V779 Cen | 170.3158 | 60.6230 | 88.94 | 0.27 | 0.04 | 0.00 | HMXB/NS | |||
| 173 | SWIFT J1127.51906 | 171.853 | 19.182 | 5.16 | 2MASX J11271632+1909198 | 1RXS J112716.6+190914 | 171.8178 | 19.1556 | 3.45 | 0.67 | 0.49 | 0.07 | 0.1055 | 44.99 | Sy1.8 | |
| 174 | SWIFT J1130.11447 | 172.522 | 14.776 | 6.66 | PKS 1127-14 | 172.5294 | 14.8243 | 4.70 | 0.88 | 0.52 | 0.07 | 1.1840 | 47.57 | Blazar | ||
| 175 | SWIFT J1131.06256 | 172.758 | 62.925 | 14.14 | IGR J11305-6256 | 172.6417 | 62.9300 | 5.44 | 0.44 | 0.23 | 0.03 | HMXB | ||||
| 176 | SWIFT J1132.75301 | 173.184 | 53.024 | 5.64 | NGC 3718 | 173.1452 | 53.0679 | 2.69 | AB | 0.61 | 0.0033 | 41.81 | Sy1 LINER | |||
| 177 | ” | ” | ” | ” | UGC 06527 NED03 | 173.1678 | 52.9504 | 2.68 | AB | 0.57 | 0.0278 | 43.68 | Sy2 | |||
| 178 | SWIFT J1136.76738 | 174.179 | 67.597 | 5.07 | 2MASX J11363009+6737042 | 174.1253 | 67.6179 | 1.61 | 0.37 | 0.27 | 0.09 | 0.1342 | 44.89 | BL Lac | ||
| 179 | SWIFT J1139.03743 | 174.776 | 37.709 | 34.57 | NGC 3783 | 174.7572 | 37.7386 | 19.45 | 0.66 | 0.38 | 0.01 | 0.0097 | 43.61 | Sy1 | ||
| 180 | SWIFT J1142.77149 | 175.985 | 71.687 | 6.96 | DO Dra | YY Dra | 175.9098 | 71.6890 | 1.74 | 0.24 | 0.13 | 0.07 | CV/DQ Her | |||
| 181 | SWIFT J1144.06105 | 175.988 | 61.078 | 11.86 | IGR J11435-6109 | 1RXS J114358.1-610736 ? | 175.9667 | 61.1500 | 5.06 | 0.44 | 0.21 | 0.04 | HMXB/NS | |||
| 182 | SWIFT J1143.77942 | 176.070 | 79.624 | 10.84 | UGC 06728 | 176.3168 | 79.6815 | 2.95 | 0.37 | 0.32 | 0.05 | 0.0065 | 42.44 | Sy1.2 | ||
| 183 | SWIFT J1145.61819 | 176.401 | 18.427 | 9.28 | 2MASX J11454045-1827149 | 176.4186 | 18.4543 | 6.38 | 0.74 | 0.44 | 0.05 | 0.0329 | 44.20 | Sy1 | ||
| 184 | SWIFT J1147.26156 | 176.810 | 61.937 | 73.37 | 1E 1145.1-6141 | 176.8692 | 61.9539 | 30.96 | 0.44 | 0.23 | 0.01 | HMXB/NS | ||||
| 185 | SWIFT J1157.85529 | 179.446 | 55.477 | 6.32 | NGC 3998 | 179.4839 | 55.4536 | 3.03 | 0.48 | 0.51 | 0.07 | 0.0035 | 41.91 | Sy1 LINER | ||
| 186 | SWIFT J1200.80650 | 180.206 | 6.838 | 5.40 | 2MASX J12005792+0648226 | CGCG 041-020 | 180.2413 | 6.8064 | 2.45 | 0.48 | 0.32 | 0.08 | 0.0360 | 43.87 | Sy2 | |
| 187 | SWIFT J1200.25350 | 180.637 | 53.804 | 8.04 | LEDA 38038 | 180.6985 | 53.8355 | 4.34 | 0.61 | 0.35 | 0.05 | 0.0280 | 43.89 | Sy2 | ||
| 188 | SWIFT J1203.04433 | 180.750 | 44.557 | 11.92 | NGC 4051 | 180.7901 | 44.5313 | 4.34 | 0.35 | 0.31 | 0.03 | 0.0023 | 41.71 | Sy1.5 | ||
| 189 | SWIFT J1204.52019 | 181.060 | 20.293 | 5.98 | ARK 347 | 181.1237 | 20.3162 | 3.85 | 0.58 | 0.45 | 0.06 | 0.0224 | 43.64 | Sy2 | ||
| 190 | SWIFT J1206.25243 | 181.629 | 52.710 | 6.96 | NGC 4102 | 181.5963 | 52.7109 | 2.58 | 0.38 | 0.37 | 0.06 | 0.0028 | 41.66 | LINER | ||
| 191 | SWIFT J1209.54702 | 182.314 | 47.069 | 5.29 | MRK 0198 | 182.3088 | 47.0583 | 2.15 | 0.42 | 0.34 | 0.07 | 0.0242 | 43.46 | Sy2 | ||
| 192 | SWIFT J1209.44340 | 182.371 | 43.685 | 9.21 | NGC 4138 | 182.3741 | 43.6853 | 3.69 | 0.45 | 0.43 | 0.05 | 0.0030 | 41.85 | Sy1.9 | ||
| 193 | SWIFT J1210.53924 | 182.629 | 39.379 | 121.30 | NGC 4151 | 182.6357 | 39.4057 | 62.23 | 0.46 | 0.42 | 0.00 | 0.0033 | 43.18 | Sy1.5 | ||
| 194 | SWIFT J1213.26458 | 183.339 | 64.914 | 6.22 | SWIFT J121314.7-645231 | 4U 1210-64 | 183.3208 | 64.8800 | 2.06 | 0.36 | 0.19 | 0.07 | HMXB/NS | |||
| 195 | SWIFT J1217.30714 | 184.317 | 7.233 | 5.40 | NGC 4235 | 184.2912 | 7.1916 | 2.40 | 0.55 | 0.39 | 0.08 | 0.0080 | 42.54 | Sy1 | ||
| 196 | SWIFT J1218.52952 | 184.626 | 29.823 | 7.67 | Mrk 766 | 184.6105 | 29.8129 | 2.42 | 0.29 | 0.19 | 0.05 | 0.0129 | 42.96 | Sy1.5 | ||
| 197 | SWIFT J1219.44720 | 184.862 | 47.365 | 4.83 | M106 | 184.7396 | 47.3040 | 2.80 | 0.63 | 0.51 | 0.09 | 0.0015 | 41.14 | Sy1.9 LINER | ||
| 198 | SWIFT J1222.47520 | 185.611 | 75.326 | 7.02 | MRK 0205 | 185.4333 | 75.3107 | 2.37 | 0.43 | 0.37 | 0.07 | 0.0708 | 44.46 | BL Lac Sy1 | ||
| 199 | SWIFT J1223.70238 | 185.817 | 2.649 | 5.31 | MRK 0050 | 185.8506 | 2.6791 | 3.53 | 0.64 | 0.47 | 0.07 | 0.0234 | 43.64 | Sy1 | ||
| 200 | SWIFT J1225.81240 | 186.467 | 12.651 | 51.62 | NGC 4388 | 186.4448 | 12.6621 | 34.64 | 0.52 | 0.43 | 0.01 | 0.0084 | 43.74 | Sy2 | ||
| 201 | SWIFT J1202.53332 | 186.495 | 33.507 | 5.60 | NGC 4395 | 186.4538 | 33.5468 | 3.12 | 0.41 | 0.36 | 0.05 | 0.0011 | 40.89 | Sy1.9 | ||
| 202 | SWIFT J1226.66244 | 186.657 | 62.735 | 675.04 | GX 301-2 | 186.6567 | 62.7706 | 261.13 | 0.36 | 0.06 | 0.00 | LMXB/NS | ||||
| 203 | SWIFT J1227.84856 | 186.952 | 48.932 | 5.26 | 1RXS J122758.8-485343 | 186.9954 | 48.8956 | 3.17 | 0.60 | 0.31 | 0.07 | CV | ||||
| 204 | SWIFT J1229.10202 | 187.262 | 2.043 | 68.66 | 3C 273 | 187.2779 | 2.0524 | 38.35 | 0.60 | 0.44 | 0.01 | 0.1583 | 46.42 | Blazar | ||
| 205 | SWIFT J1234.76433 | 188.691 | 64.580 | 15.01 | RT Cru | 188.7239 | 64.5656 | 7.19 | 0.49 | 0.28 | 0.03 | Symb/WD | ||||
| 206 | SWIFT J1235.63954 | 188.896 | 39.867 | 35.96 | NGC 4507 | 188.9026 | 39.9093 | 22.51 | 0.68 | 0.40 | 0.01 | 0.0118 | 43.85 | Sy2 | ||
| 207 | SWIFT J1238.92720 | 189.697 | 27.283 | 22.02 | ESO 506-G027 | 189.7275 | 27.3078 | 13.75 | 0.72 | 0.44 | 0.02 | 0.0250 | 44.29 | Sy2 | ||
| 208 | SWIFT J1239.31611 | 189.821 | 16.166 | 10.85 | LEDA 170194 | IGR J12392-1612 | 189.7763 | 16.1799 | 6.87 | 0.76 | 0.45 | 0.04 | 0.0367 | 44.33 | Sy2 | |
| 209 | SWIFT J1239.60519 | 189.924 | 5.313 | 19.64 | NGC 4593 | 189.9143 | 5.3443 | 9.79 | 0.62 | 0.41 | 0.02 | 0.0090 | 43.25 | Sy1 | ||
| 210 | SWIFT J1240.93331 | 190.183 | 33.557 | 5.38 | ESO 381- G 007 | 190.1956 | 33.5700 | 3.96 | 0.78 | 0.48 | 0.09 | 0.0550 | 44.46 | Sy1.5 | ||
| 211 | SWIFT J1241.65748 | 190.485 | 57.795 | 5.07 | WKK 1263 | 190.3570 | 57.8340 | 4.03 | 0.78 | 0.58 | 0.10 | 0.0244 | 43.74 | Sy1.5 | ||
| 212 | SWIFT J1246.65435 | 191.716 | 54.536 | 7.22 | NGC 4686 | 191.6661 | 54.5342 | 3.08 | 0.45 | 0.42 | 0.06 | 0.0167 | 43.29 | Galaxy, XBONG | ||
| 213 | SWIFT J1249.35907 | 192.332 | 59.111 | 21.74 | 4U 1246-58 | 1A 1246-588 | 192.4140 | 59.0874 | 9.91 | 0.50 | 0.28 | 0.02 | LMXB | |||
| 214 | SWIFT J1252.32916 | 193.074 | 29.273 | 6.73 | EX Hya | 193.1017 | 29.2491 | 2.54 | 0.35 | 0.15 | 0.07 | CV/DQ Her | ||||
| 215 | SWIFT J1256.20551 | 194.031 | 5.786 | 6.91 | 3C 279 | 194.0465 | 5.7893 | 4.97 | 0.74 | 0.55 | 0.07 | 0.5362 | 46.75 | Blazar | ||
| 216 | SWIFT J1257.46915 | 194.357 | 69.254 | 18.93 | 4U 1254-690 | 194.4048 | 69.2886 | 5.80 | 0.23 | 0.05 | 0.02 | LMXB/NS | ||||
| 217 | SWIFT J1259.72755 | 194.914 | 27.923 | 8.29 | Coma Cluster | 194.9531 | 27.9807 | 3.59 | 0.19 | 0.02 | 0.03 | 0.0231 | 43.64 | Galaxy cluster | ||
| 218 | SWIFT J1301.26139 | 195.298 | 61.655 | 5.71 | GX 304-1 | 195.3217 | 61.6019 | 2.45 | 0.52 | 0.25 | 0.09 | HMXB | ||||
| 219 | SWIFT J1302.06358 | 195.495 | 63.964 | 8.81 | IGR J13020-6359 | 195.4983 | 63.9683 | 3.99 | 0.42 | 0.22 | 0.04 | PSR | ||||
| 220 | SWIFT J1303.85345 | 196.053 | 53.783 | 8.86 | SBS 1301+540 | 195.9978 | 53.7917 | 4.02 | 0.43 | 0.41 | 0.04 | 0.0299 | 43.92 | Sy1 | ||
| 221 | SWIFT J1305.44928 | 196.381 | 49.506 | 42.73 | NGC 4945 | 196.3645 | 49.4682 | 32.98 | 0.77 | 0.50 | 0.01 | 0.0019 | 42.41 | Sy2 | ||
| 222 | SWIFT J1306.44025 | 196.618 | 40.404 | 7.96 | ESO 323-077 | 196.6089 | 40.4146 | 4.70 | 0.66 | 0.35 | 0.05 | 0.0150 | 43.38 | Sy1.2 | ||
| 223 | SWIFT J1309.21139 | 197.276 | 11.678 | 13.08 | NGC 4992 | 197.2733 | 11.6341 | 6.16 | 0.52 | 0.44 | 0.03 | 0.0251 | 43.95 | Sy2 XBONG | ||
| 224 | SWIFT J1312.15631 | 197.920 | 56.492 | 5.12 | 2MASX J13103701-5626551 | SWIFT J1311.7-5629 | 197.6540 | 56.4490 | 1.96 | 0.71 | 0.46 | 0.13 | ? | Galaxy | ||
| 225 | SWIFT J1322.21641 | 200.644 | 16.717 | 6.31 | MCG -03-34-064 | 200.6019 | 16.7286 | 3.15 | 0.45 | 0.25 | 0.06 | 0.0165 | 43.29 | Sy1.8 | ||
| 226 | SWIFT J1325.44301 | 201.372 | 43.014 | 138.27 | Cen A | 201.3651 | 43.0191 | 92.62 | 0.71 | 0.42 | 0.00 | 0.0018 | 42.83 | Sy2 | ||
| 227 | SWIFT J1326.96207 | 201.713 | 62.114 | 48.17 | 4U 1323-619 | 201.6504 | 62.1361 | 24.60 | 0.53 | 0.29 | 0.01 | LMXB/NS | ||||
| 228 | SWIFT J1335.83416 | 203.928 | 34.317 | 13.03 | MCG -06-30-015 | 203.9741 | 34.2956 | 7.82 | 0.57 | 0.32 | 0.03 | 0.0077 | 43.02 | Sy1.2 | ||
| 229 | SWIFT J1338.20433 | 204.563 | 4.549 | 14.38 | NGC 5252 | 204.5665 | 4.5426 | 8.18 | 0.59 | 0.45 | 0.03 | 0.0230 | 43.99 | Sy1.9 | ||
| 230 | SWIFT J1347.46033 | 206.802 | 60.646 | 14.51 | 4U 1344-60 | 206.9000 | 60.6178 | 9.59 | 0.66 | 0.41 | 0.03 | 0.0129 | 43.55 | Sy1.5 | ||
| 231 | SWIFT J1349.33018 | 207.342 | 30.309 | 56.95 | IC 4329A | 207.3303 | 30.3094 | 33.08 | 0.62 | 0.37 | 0.01 | 0.0160 | 44.28 | Sy1.2 | ||
| 232 | SWIFT J1349.70209 | 207.423 | 2.133 | 6.29 | UM 614 | 207.4701 | 2.0791 | 2.24 | 0.47 | 0.34 | 0.08 | 0.0327 | 43.74 | Sy1 | ||
| 233 | SWIFT J1352.86917 | 208.263 | 69.313 | 15.04 | Mrk 279 | 208.2644 | 69.3082 | 5.30 | 0.38 | 0.35 | 0.03 | 0.0304 | 44.05 | Sy1.5 | ||
| 234 | SWIFT J1356.13832 | 209.013 | 38.530 | 6.29 | MRK 0464 | 208.9730 | 38.5746 | 2.21 | 0.32 | 0.25 | 0.07 | 0.0501 | 44.12 | Sy1.5 | ||
| 235 | SWIFT J1412.96522 | 213.224 | 65.363 | 43.42 | Circinus Galaxy | 213.2913 | 65.3390 | 27.48 | 0.57 | 0.35 | 0.01 | 0.0014 | 42.10 | AGN | ||
| 236 | SWIFT J1413.20312 | 213.304 | 3.200 | 44.78 | NGC 5506 | 213.3119 | 3.2075 | 25.64 | 0.50 | 0.35 | 0.01 | 0.0062 | 43.34 | Sy1.9 | ||
| 237 | SWIFT J1417.92507 | 214.506 | 25.098 | 13.73 | NGC 5548 | 214.4981 | 25.1368 | 8.08 | 0.50 | 0.41 | 0.03 | 0.0172 | 43.73 | Sy1.5 | ||
| 238 | SWIFT J1419.02639 | 214.887 | 26.644 | 7.07 | ESO 511-G030 | 214.8434 | 26.6447 | 4.71 | 0.65 | 0.44 | 0.06 | 0.0224 | 43.73 | Sy1 | ||
| 239 | SWIFT J1421.44747 | 215.347 | 47.781 | 5.12 | SBS 1419+480 | 215.3742 | 47.7902 | 2.11 | 0.39 | 0.34 | 0.07 | 0.0723 | 44.43 | Sy1.5 | ||
| 240 | SWIFT J1428.74234 | 217.180 | 42.674 | 8.52 | 1ES 1426+428 | 217.1361 | 42.6724 | 2.33 | 0.29 | 0.26 | 0.05 | 0.1290 | 45.01 | BL Lac | ||
| 241 | SWIFT J1436.45846 | 219.104 | 58.795 | 5.06 | MRK 0817 | 219.0920 | 58.7943 | 2.21 | 0.36 | 0.35 | 0.07 | 0.0314 | 43.70 | Sy1.5 | ||
| 242 | SWIFT J1442.51715 | 220.546 | 17.253 | 14.57 | NGC 5728 | 220.5997 | 17.2532 | 10.54 | 0.71 | 0.43 | 0.03 | 0.0093 | 43.31 | Sy2 | ||
| 243 | SWIFT J1451.05540 | 222.853 | 55.640 | 7.64 | WKK 4374 | 222.8881 | 55.6773 | 4.36 | AB | 0.39 | 0.0180 | 43.50 | Sy2 | |||
| 244 | ” | ” | ” | ” | 2MFGC 12018 | 222.3030 | 55.6050 | 3.71 | AB | 0.47 | ? | Galaxy | ||||
| 245 | SWIFT J1453.45524 | 223.344 | 55.408 | 6.20 | 1RXS J145341.1-552146 | IGR J14515-5542 | 223.4558 | 55.3622 | 2.28 | 0.35 | B | 0.10 | 0.08 | CV/AM Her | ||
| 246 | SWIFT J1454.95133 | 223.719 | 51.550 | 5.09 | WKK 4438 | 223.8230 | 51.5710 | 2.02 | 0.54 | 0.34 | 0.11 | 0.0160 | 43.07 | NLSy1 | ||
| 247 | SWIFT J1457.84308 | 224.464 | 43.102 | 5.99 | IC 4518A | 224.4216 | 43.1321 | 3.29 | 0.52 | 0.24 | 0.07 | 0.0163 | 43.29 | Sy2 | ||
| 248 | SWIFT J1504.21025 | 226.010 | 10.411 | 6.33 | Mrk 841 | 226.0050 | 10.4378 | 2.93 | 0.53 | 0.37 | 0.06 | 0.0364 | 43.96 | Sy1 | ||
| 249 | SWIFT J1506.70353 | 226.635 | 3.842 | 5.42 | 2MASX J15064412+0351444 | 226.6840 | 3.8620 | 2.12 | AB | 0.30 | 0.0377 | 43.84 | Sy2 | |||
| 250 | ” | ” | ” | ” | MRK 1392 | 226.4860 | 3.7070 | 1.99 | AB | 0.34 | 0.0361 | 43.78 | Sy1 | |||
| 251 | SWIFT J1512.80906 | 228.212 | 9.106 | 7.45 | PKS 1510-08 | 228.2106 | 9.1000 | 6.56 | 0.76 | 0.48 | 0.06 | 0.3600 | 46.46 | QSO | ||
| 252 | SWIFT J1513.85910 | 228.439 | 59.165 | 39.85 | PSR B1509-58 | Cir pulsar | 228.4813 | 59.1358 | 27.50 | 0.72 | 0.42 | 0.01 | PSR/PWN | |||
| 253 | SWIFT J1513.88125 | 228.567 | 81.415 | 5.29 | 2MASX J15144217-8123377 | 228.6751 | 81.3939 | 2.56 | 0.48 | 0.32 | 0.07 | 0.0684 | 44.46 | Sy1.9 | ||
| 254 | SWIFT J1515.04205 | 228.770 | 42.009 | 5.12 | NGC 5899 | 228.7635 | 42.0499 | 2.15 | 0.45 | 0.43 | 0.09 | 0.0086 | 42.54 | Sy2 | ||
| 255 | SWIFT J1515.21223 | 228.799 | 12.431 | 4.86 | SWIFT J1515.2+1223 | SWIFT J151447.0+122244 | 228.6958 | 12.3789 | 2.05 | 0.54 | 0.30 | 0.09 | ? | |||
| 256 | SWIFT J1521.05711 | 230.255 | 57.182 | 40.35 | BR Cir | Cir X-1 | 230.1703 | 57.1667 | 13.76 | 0.26 | 0.03 | 0.01 | LMXB | |||
| 257 | SWIFT J1533.20836 | 233.387 | 8.676 | 5.33 | MCG -01-40-001 | 233.3363 | 8.7005 | 3.76 | 0.57 | 0.34 | 0.07 | 0.0227 | 43.64 | Sy2 | ||
| 258 | SWIFT J1535.95751 | 233.935 | 57.909 | 5.25 | Mrk 290 | 233.9682 | 57.9026 | 2.55 | 0.41 | 0.33 | 0.06 | 0.0296 | 43.71 | Sy1 | ||
| 259 | SWIFT J1542.65222 | 235.658 | 52.362 | 69.23 | QV Nor | H 1538-522 | 235.5971 | 52.3861 | 30.41 | 0.38 | 0.09 | 0.01 | HMXB | |||
| 260 | SWIFT J1546.36928 | 236.538 | 69.466 | 5.77 | 2MASX J15462424+6929102 | 236.6014 | 69.4861 | 15.46 | 0.55 | B | 0.26 | 0.01 | 0.0380 | 44.72 | Sy2 | |
| 261 | ” | ” | ” | ” | 1RXS J154534.5+692925 | 236.3938 | 69.4903 | 1.69 | A | 0.20 | ? | SRC/X-RAY | ||||
| 262 | SWIFT J1547.96232 | 236.981 | 62.525 | 17.09 | 1XMM J154754.7-623404 | 4U 1543-62 | 236.9762 | 62.5698 | 5.70 | 0.29 | 0.06 | 0.03 | LMXB/NS | |||
| 263 | SWIFT J1548.04529 | 237.006 | 45.479 | 18.06 | NY Lup | IGR J15479-4529 | 237.0608 | 45.4778 | 10.14 | 0.55 | 0.29 | 0.02 | CV/DQ Her | |||
| 264 | SWIFT J1548.51344 | 237.068 | 13.738 | 5.92 | NGC 5995 | 237.1040 | 13.7578 | 4.51 | 0.61 | 0.36 | 0.07 | 0.0252 | 43.81 | Sy2 | ||
| 265 | SWIFT J1558.42718 | 239.602 | 27.298 | 8.42 | ABELL 2142 | 239.5672 | 27.2246 | 2.39 | 0.32 | 0.23 | 0.05 | 0.0909 | 44.69 | Galaxy cluster | ||
| 266 | SWIFT J1559.62554 | 239.903 | 25.905 | 14.80 | T CrB | Nova CrB 1866/1946 | 239.8757 | 25.9202 | 6.40 | 0.36 | 0.25 | 0.02 | Symb/WD | |||
| 267 | SWIFT J1613.26043 | 242.997 | 60.644 | 7.41 | WKK 6092 | 242.9642 | 60.6319 | 3.99 | 0.58 | 0.30 | 0.06 | 0.0156 | 43.34 | Sy1 | ||
| 268 | SWIFT J1612.95227 | 243.233 | 52.443 | 97.13 | QX Nor | 4U 1608-522 | 243.1792 | 52.4231 | 49.82 | 0.52 | 0.27 | 0.00 | LMXB | |||
| 269 | SWIFT J1617.54958 | 244.385 | 49.964 | 5.70 | 1RXS J161637.1-495847 | IGR J16167-4957 | 244.2800 | 49.9600 | 2.08 | 0.38 | 0.10 | 0.09 | CV | |||
| 270 | SWIFT J1619.42808 | 244.856 | 28.129 | 7.75 | USNO-A2.0 U0600-20227091 | IGR J16194-2810 | 244.8875 | 28.1272 | 4.74 | 0.45 | 0.19 | 0.05 | Symb/NS | |||
| 271 | SWIFT J1619.24945 | 244.947 | 49.722 | 8.71 | 2MASS J16193220-4944305 | IGR J16195-4945 | 244.8842 | 49.7418 | 3.55 | 0.43 | 0.15 | 0.06 | ? | Possible HMXB/FXT | ||
| 272 | SWIFT J1620.11539 | 245.014 | 15.650 | 4635.67 | V818 Sco | Sco X-1 | 244.9795 | 15.6402 | 1821.87 | 0.30 | 0.01 | 0.00 | LMXB/NS | |||
| 273 | SWIFT J1621.28104 | 245.209 | 81.081 | 6.74 | CGCG 367-009 | 244.8302 | 81.0465 | 3.20 | 0.52 | 0.47 | 0.06 | 0.0274 | 43.74 | Sy2 | ||
| 274 | SWIFT J1620.95129 | 245.222 | 51.486 | 9.64 | 2MASS J16203698-5130363 | IGR J16207-5129 | 245.1542 | 51.5100 | 4.34 | 0.47 | 0.22 | 0.05 | HMXB | |||
| 275 | SWIFT J1626.95156 | 246.718 | 51.932 | 9.09 | SWIFT J162636.2-515634 | SWIFT J1626.6-5156 | 246.6510 | 51.9428 | 3.84 | 0.36 | 0.11 | 0.05 | XRB/NS | |||
| 276 | SWIFT J1627.84913 | 246.956 | 49.209 | 25.04 | 4U 1624-490 | 4U 1624-490/ Big dipper | 247.0118 | 49.1985 | 8.95 | 0.27 | 0.04 | 0.02 | LMXB/NS | |||
| 277 | SWIFT J1628.15145 | 247.094 | 51.779 | 10.02 | Mrk 1498 | 247.0169 | 51.7754 | 4.37 | 0.44 | 0.39 | 0.04 | 0.0547 | 44.49 | Sy1.9 | ||
| 278 | SWIFT J1632.14753 | 248.016 | 47.877 | 47.01 | AX J1631.9-4752 | IGR J16320-4751; HESS J1632-478 | 248.0079 | 47.8742 | 26.52 | 0.46 | 0.17 | 0.01 | PSR | |||
| 279 | SWIFT J1632.14849 | 248.032 | 48.820 | 76.77 | IGR J16318-4848 | 247.9667 | 48.8083 | 48.15 | 0.54 | 0.27 | 0.01 | HMXB/NS | ||||
| 280 | SWIFT J1632.46729 | 248.090 | 67.480 | 64.78 | 4U 1626-67 | 248.0700 | 67.4619 | 26.33 | 0.34 | 0.04 | 0.01 | LMXB | ||||
| 281 | SWIFT J1638.76420 | 249.675 | 64.335 | 5.94 | TrA Cluster | 249.5671 | 64.3472 | 2.36 | 0.34 | 0.00 | 0.09 | 0.0508 | 44.16 | Galaxy cluster | ||
| 282 | SWIFT J1639.24641 | 249.796 | 46.676 | 17.44 | IGR J16393-4643 | 249.7583 | 46.6767 | 9.37 | 0.38 | 0.06 | 0.02 | Symb/NS | ||||
| 283 | SWIFT J1640.85343 | 250.199 | 53.718 | 100.33 | V801 Ara | 4U 1636-536 | 250.2313 | 53.7514 | 44.22 | 0.44 | 0.18 | 0.00 | LMXB | |||
| 284 | SWIFT J1641.94531 | 250.487 | 45.516 | 11.34 | IGR J16418-4532 | 2MASS J16415078-4532253 ? | 250.4375 | 45.5200 | 7.27 | 0.45 | 0.13 | 0.03 | SRC/GAMMA | |||
| 285 | SWIFT J1643.13951 | 250.776 | 39.858 | 6.43 | 3C 345 | 250.7450 | 39.8103 | 3.34 | 0.64 | 0.47 | 0.07 | 0.5928 | 46.69 | HPQ | ||
| 286 | SWIFT J1645.74538 | 251.424 | 45.635 | 175.21 | GX 340+0 | 4U 1642-45 | 251.4488 | 45.6111 | 77.93 | 0.32 | B | 0.02 | 0.00 | LMXB/NS | ||
| 287 | SWIFT J1647.94511 | 251.971 | 45.184 | 12.36 | 2MASS J16480656-4512068 | IGR J16479-4514 | 251.9958 | 45.2167 | 8.73 | AB | 0.22 | HMXB/fast trans | ||||
| 288 | ” | ” | ” | ” | IGR J16465-4507 | 251.6480 | 45.1170 | 2.84 | AB | 0.15 | ||||||
| 289 | SWIFT J1648.03037 | 252.082 | 30.545 | 10.15 | 2MASX J16481523-3035037 | 252.0635 | 30.5845 | 8.36 | 0.70 | 0.40 | 0.04 | 0.0310 | 44.27 | Sy1 | ||
| 290 | SWIFT J1649.34351 | 252.333 | 43.856 | 9.25 | 2MASS J16492695-4349090 | IGR J16493-4348 | 252.3375 | 43.8100 | 4.85 | 0.45 | 0.19 | 0.04 | XRB/NS | |||
| 291 | SWIFT J1650.50434 | 252.657 | 4.582 | 5.39 | LEDA 214543 | 252.6781 | 4.6050 | 3.38 | 0.61 | 0.48 | 0.09 | 0.0321 | 43.90 | Sy2 | ||
| 292 | SWIFT J1652.90223 | 253.208 | 2.427 | 9.38 | NGC 6240 | 253.2454 | 2.4009 | 7.30 | 0.62 | 0.44 | 0.04 | 0.0245 | 44.00 | Sy2 | ||
| 293 | SWIFT J1653.83952 | 253.448 | 39.859 | 49.78 | GRO J1655-40 | 253.5006 | 39.8458 | 35.24 | 0.65 | 0.35 | 0.01 | LMXB/BH | ||||
| 294 | SWIFT J1654.03946 | 253.494 | 39.795 | 14.88 | Mrk 501 | 253.4676 | 39.7602 | 5.46 | 0.39 | 0.27 | 0.03 | 0.0337 | 44.15 | BL Lac | ||
| 295 | SWIFT J1656.15200 | 254.032 | 52.005 | 5.75 | 1RXS J165605.6-520345 | 254.0234 | 52.0614 | 3.81 | 0.77 | 0.41 | 0.08 | 0.0540 | 44.42 | Sy1.2 | ||
| 296 | SWIFT J1656.33302 | 254.041 | 33.001 | 8.86 | 2MASS J16561677-3302127 | SWIFT J1656.3-3302 | 254.0699 | 33.0369 | 8.50 | 0.81 | 0.47 | 0.05 | 2.4000 | 48.58 | Blazar | |
| 297 | SWIFT J1657.73518 | 254.432 | 35.305 | 281.06 | HZ Her | Her X-1 | 254.4576 | 35.3424 | 90.54 | 0.28 | 0.07 | 0.00 | LMXB/NS | |||
| 298 | SWIFT J1700.64222 | 255.141 | 42.368 | 6.10 | AX J1700.2-4220 | 255.1050 | 42.3170 | 3.46 | 0.50 | 0.25 | 0.07 | |||||
| 299 | SWIFT J1700.84139 | 255.191 | 41.650 | 168.95 | Roche star 10B | OAO 1657-415 | 255.1996 | 41.6731 | 97.40 | 0.50 | 0.23 | 0.00 | HMXB/NS | |||
| 300 | SWIFT J1700.94610 | 255.218 | 46.171 | 57.73 | XTE J1701-462 | 255.2436 | 46.1857 | 24.02 | 0.30 | 0.01 | 0.01 | LMXB | ||||
| 301 | SWIFT J1702.84849 | 255.708 | 48.816 | 38.26 | V821 Ara | GX 339-4 | 255.7063 | 48.7897 | 38.26 | 0.80 | 0.48 | 0.01 | LMXB | |||
| 302 | SWIFT J1703.93753 | 255.979 | 37.883 | 581.69 | V884 Sco | 4U 1700-377 | 255.9866 | 37.8441 | 362.89 | 0.49 | 0.23 | 0.00 | HMXB/NS | |||
| 303 | SWIFT J1705.93624 | 256.474 | 36.400 | 259.90 | V1101 Sco | GX 349+2 | 256.4354 | 36.4231 | 117.09 | 0.31 | 0.00 | 0.00 | LMXB/NS | |||
| 304 | SWIFT J1706.24303 | 256.544 | 43.058 | 73.91 | Ara X-1 | 4U 1702-429 | 256.5638 | 43.0358 | 40.43 | 0.48 | 0.22 | 0.00 | LMXB/NS | |||
| 305 | SWIFT J1706.72401 | 256.675 | 24.012 | 7.49 | V934 Her | 4U 1700+24 | 256.6438 | 23.9718 | 3.93 | 0.46 | 0.32 | 0.05 | LMXB/NS | |||
| 306 | SWIFT J1706.66146 | 256.686 | 61.755 | 5.52 | SWIFT J179616.4-614240 | IGR J17062-6143 | 256.5677 | 61.7113 | 3.81 | 0.63 | 0.39 | 0.07 | ||||
| 307 | SWIFT J1708.54008 | 257.137 | 40.130 | 5.47 | RX J170849.0-400910 | 257.2050 | 40.1530 | 5.06 | 0.86 | 0.55 | 0.10 | NS/AXP | ||||
| 308 | SWIFT J1708.73216 | 257.180 | 32.267 | 8.09 | 2XMM J170854.2-321858 | 4U 1705-32 | 257.2267 | 32.3160 | 6.16 | 0.68 | 0.37 | 0.05 | LMXB | |||
| 309 | SWIFT J1708.94404 | 257.213 | 44.061 | 69.48 | 4U 1705-440 | 257.2270 | 44.1020 | 29.50 | 0.34 | 0.11 | 0.01 | LMXB/NS | ||||
| 310 | SWIFT J1709.83627 | 257.448 | 36.458 | 6.33 | SWIFT J170945.9-362759 | IGR J17098-3628 | 257.4424 | 36.4660 | 6.08 | AB | 0.42 | SRC/GAMMA | ||||
| 311 | ” | ” | ” | ” | IGR J17091-3624 | 257.2750 | 36.4110 | 3.49 | AB | 0.40 | SRC/GAMMA | |||||
| 312 | SWIFT J1710.32806 | 257.581 | 28.103 | 8.29 | 1RXS J171012.3-280754 | XTE J1710-281 | 257.5513 | 28.1317 | 5.16 | 0.50 | 0.26 | 0.04 | LMXB | |||
| 313 | SWIFT J1712.24051 | 258.056 | 40.855 | 7.84 | 1RXS J171224.8-405034 | 4U 1708-40 | 258.0958 | 40.8433 | 3.00 | 0.30 | 0.08 | 0.05 | LMXB | |||
| 314 | SWIFT J1712.52322 | 258.134 | 23.363 | 19.03 | Oph Cluster | 258.1082 | 23.3759 | 9.70 | 0.36 | 0.07 | 0.02 | 0.0280 | 44.24 | Galaxy cluster | ||
| 315 | SWIFT J1712.72412 | 258.165 | 24.195 | 9.45 | V2400 Oph | 1RXS J171236.3-241445 | 258.1519 | 24.2457 | 5.27 | 0.42 | 0.16 | 0.04 | CV/DQ Her | |||
| 316 | SWIFT J1712.83737 | 258.192 | 37.614 | 11.96 | 1RXS J171237.1-373834 | SAX J1712.6-3739 | 258.1417 | 37.6433 | 7.10 | 0.55 | 0.27 | 0.03 | LMXB/NS | |||
| 317 | SWIFT J1717.16249 | 259.263 | 62.859 | 15.53 | NGC 6300 | 259.2478 | 62.8206 | 10.35 | 0.64 | 0.37 | 0.03 | 0.0037 | 42.50 | Sy2 | ||
| 318 | SWIFT J1719.64102 | 259.907 | 41.035 | 6.32 | 1RXS J171935.6-410054 | CXOU J171935.8-410053 | 259.8983 | 41.0151 | 3.59 | 0.43 | 0.12 | 0.05 | CV | |||
| 319 | SWIFT J1719.74900 | 259.919 | 49.003 | 5.22 | ARP 102B | 259.8104 | 48.9804 | 1.89 | 0.45 | 0.35 | 0.09 | 0.0242 | 43.40 | Sy1 LINER | ||
| 320 | SWIFT J1720.33115 | 260.076 | 31.249 | 6.99 | 2MASS J17200591-3116596 | IGR J17200-3116 | 260.0254 | 31.2839 | 3.58 | 0.42 | 0.07 | 0.06 | HMXB | |||
| 321 | SWIFT J1725.13616 | 261.272 | 36.275 | 18.54 | 2MASS J17251139-3616575 | EXO 1722-363 | 261.2975 | 36.2831 | 12.03 | 0.45 | 0.12 | 0.02 | HMXB/NS | |||
| 322 | SWIFT J1725.23258 | 261.308 | 32.968 | 5.16 | IGR J17254-3257 | 261.3500 | 32.9500 | 3.25 | 0.53 | 0.24 | 0.07 | SRC/GAMMA | ||||
| 323 | SWIFT J1727.43046 | 261.862 | 30.774 | 52.66 | 4U 1722-30 | 4U1724-30 | 261.8883 | 30.8019 | 32.40 | 0.51 | 0.24 | 0.01 | LMXB | |||
| 324 | SWIFT J1730.40558 | 262.590 | 5.964 | 10.84 | 1RXS J173021.5-055933 | 1H 1726-058 | 262.5896 | 5.9926 | 6.78 | 0.51 | 0.29 | 0.03 | CV/DQ Her | |||
| 325 | SWIFT J1731.61657 | 262.903 | 16.953 | 87.04 | V2216 Oph | GX 9+9 | 262.9342 | 16.9617 | 35.58 | 0.29 | 0.00 | 0.00 | LMXB/NS | |||
| 326 | SWIFT J1731.92444 | 262.964 | 24.737 | 149.22 | V2116 Oph | GX 1+4 | 263.0090 | 24.7456 | 109.08 | 0.57 | 0.30 | 0.00 | HMXB/NS | |||
| 327 | SWIFT J1732.13349 | 263.025 | 33.820 | 145.26 | Slow burster | 4U1728-33 | 262.9892 | 33.8347 | 70.50 | 0.38 | 0.09 | 0.00 | LMXB/NS | |||
| 328 | SWIFT J1737.52908 | 264.375 | 29.107 | 14.84 | AX J1737.4-2907 | GRS 1734-292 | 264.3512 | 29.1800 | 12.33 | 0.69 | 0.38 | 0.03 | 0.0214 | 44.11 | Sy1 | |
| 329 | SWIFT J1738.32657 | 264.578 | 26.953 | 33.24 | SLX 1735-269 | SLX 1735-269 | 264.5667 | 27.0044 | 24.94 | 0.62 | 0.33 | 0.01 | LMXB/NS | |||
| 330 | SWIFT J1739.24428 | 264.792 | 44.473 | 147.81 | V926 Sco | 4U 1735-44 | 264.7429 | 44.4500 | 61.59 | 0.29 | 0.01 | 0.00 | LMXB/NS | |||
| 331 | SWIFT J1740.03651 | 265.011 | 36.845 | 5.23 | IGR J17404-3655 | 265.1110 | 36.9270 | 2.86 | 0.49 | 0.25 | 0.07 | XRB | ||||
| 332 | SWIFT J1740.62821 | 265.143 | 28.350 | 15.92 | SLX 1737-282 | 265.2375 | 28.3100 | 10.20 | AB | 0.34 | LMXB | |||||
| 333 | ” | ” | ” | ” | CXO J170058.6-461108.6 | XTE J1739-285 | 264.9748 | 28.4963 | 7.68 | AB | 0.29 | LMXB | ||||
| 334 | SWIFT J1743.13620 | 265.769 | 36.339 | 5.80 | XTE J1743-363 | 265.7500 | 36.3450 | 3.53 | 0.55 | 0.30 | 0.06 | SRC/X-ray | ||||
| 335 | SWIFT J1743.72946 | 265.937 | 29.761 | 80.30 | 1E 1740.7-2942 | 265.9785 | 29.7452 | 76.10 | 0.74 | B | 0.40 | 0.00 | LMXB/BH | |||
| 336 | SWIFT J1746.23214 | 266.561 | 32.239 | 8.02 | H 1743-322 | 266.5650 | 32.2335 | 5.95 | 0.60 | 0.30 | 0.04 | LMXB | ||||
| 337 | SWIFT J1746.32931 | 266.564 | 29.509 | 44.90 | 2E1742-2929 | 1A 1742-294 | 266.5229 | 29.5153 | 23.95 | AB | 0.17 | LMXB | ||||
| 338 | SWIFT J1746.32850 | 266.585 | 28.837 | 32.02 | CXOGC J174702.6-285258 | SAX J1747.0-2853 | 266.7608 | 28.8830 | 15.02 | AB | 0.25 | LMXB | ||||
| 339 | ” | ” | ” | ” | 2E 1743.1-2842 | 266.5800 | 28.7353 | 13.48 | AB | 0.19 | LMXB | |||||
| 340 | ” | ” | ” | ” | IGR J17461-2853 | 266.5250 | 28.8820 | 17.33 | AB | 0.24 | Molecular cloud? | |||||
| 341 | ” | ” | ” | ” | SGR A* | 266.4168 | 29.0078 | 14.83 | AB | 0.26 | Galactic center | |||||
| 342 | SWIFT J1747.42719 | 266.853 | 27.323 | 8.40 | IGR J17473-2721 | 266.8253 | 27.3441 | 7.87 | 0.77 | B | 0.42 | 0.05 | XRB burster | |||
| 343 | SWIFT J1747.43003 | 266.858 | 30.053 | 25.58 | AX J1747.4-3000 | SLX 1744-299 | 266.8579 | 29.9994 | 14.38 | AB | 0.20 | LMXB/NS | ||||
| 344 | ” | ” | ” | ” | AX J1747.4-3003 | SLX 1744-300 | 266.8558 | 30.0447 | 15.38 | AB | 0.21 | LMXB | ||||
| 345 | SWIFT J1747.72253 | 266.920 | 22.876 | 4.82 | NVSS J174729-225245 | 266.8740 | 22.8790 | 3.37 | 0.61 | 0.32 | 0.08 | ? | Possible QSO | |||
| 346 | SWIFT J1747.92631 | 266.969 | 26.509 | 60.05 | GX 3+1 | 4U 1744-26 | 266.9833 | 26.5636 | 25.48 | 0.30 | 0.00 | 0.01 | LMXB/NS | |||
| 347 | SWIFT J1748.83257 | 267.203 | 32.956 | 6.81 | 2MASS J17485512-3254521 | IGR J17488-3253 | 267.2297 | 32.9145 | 4.88 | 0.67 | 0.33 | 0.06 | 0.0200 | 43.65 | Sy1 | |
| 348 | SWIFT J1749.42822 | 267.352 | 28.368 | 17.72 | SWIFT J174938.1-282116.9 | IGR J17497-2821 | 267.4088 | 28.3547 | 16.34 | 0.78 | 0.45 | 0.02 | LMXB | |||
| 349 | SWIFT J1750.23701 | 267.560 | 37.020 | 17.53 | 4U 1746-37 | 267.5529 | 37.0522 | 7.33 | 0.32 | 0.03 | 0.02 | LMXB/NS | ||||
| 350 | SWIFT J1753.50130 | 268.385 | 1.494 | 150.99 | SWIFT J175328.5-012704 | SWIFT J1753.5-0127 | 268.3679 | 1.4525 | 129.95 | 0.72 | 0.45 | 0.00 | LMXB/ BHC | |||
| 351 | SWIFT J1759.92201 | 269.971 | 22.021 | 10.09 | XTE J1759-220 | IGRJ17597-2201 | 269.9417 | 22.0150 | 6.89 | 0.49 | 0.19 | 0.03 | LMXB | |||
| 352 | SWIFT J1801.12504 | 270.270 | 25.062 | 238.67 | GX 5-1 | 270.2842 | 25.0792 | 127.44 | 0.33 | 0.01 | 0.00 | LMXB/NS | ||||
| 353 | SWIFT J1801.12544 | 270.271 | 25.734 | 173.08 | 1XMM J180112.7-254440 | GRS 1758-258 | 270.3012 | 25.7433 | 196.30 | 0.79 | 0.44 | 0.00 | LMXB/BH | |||
| 354 | SWIFT J1801.52031 | 270.385 | 20.509 | 113.79 | GX 9+1 | 270.3846 | 20.5289 | 53.19 | 0.33 | 0.00 | 0.00 | LMXB/NS | ||||
| 355 | SWIFT J1808.72024 | 272.179 | 20.400 | 7.12 | CXOU J180839.3-202439 | SGR 1806-20 | 272.1638 | 20.4110 | 6.76 | 0.85 | 0.43 | 0.06 | SGR | |||
| 356 | SWIFT J1814.61709 | 273.661 | 17.156 | 79.81 | V5512 Sgr | GX 13+1 | 273.6315 | 17.1574 | 34.91 | 0.32 | 0.04 | 0.00 | LMXB/NS | |||
| 357 | SWIFT J1815.11208 | 273.771 | 12.128 | 81.92 | 4U 1812-12 | 273.8000 | 12.0833 | 58.17 | 0.65 | 0.35 | 0.01 | LMXB/NS | ||||
| 358 | SWIFT J1815.81403 | 273.948 | 14.051 | 265.05 | NP Ser | GX 17+2 | 274.0058 | 14.0364 | 127.18 | 0.31 | 0.01 | 0.00 | LMXB/NS | |||
| 359 | SWIFT J1817.83301 | 274.451 | 33.011 | 19.21 | XTE J1817-330 | 274.4314 | 33.0188 | 15.15 | 0.62 | 0.33 | 0.02 | XRB/BHC | ||||
| 360 | SWIFT J1822.06421 | 275.503 | 64.353 | 5.35 | [HB89] 1821+643 | 275.4888 | 64.3434 | 1.74 | 0.35 | 0.26 | 0.08 | 0.2970 | 45.69 | Sy1 | ||
| 361 | SWIFT J1823.73023 | 275.917 | 30.380 | 170.72 | 4U 1820-30 | 275.9186 | 30.3611 | 85.23 | 0.35 | 0.02 | 0.00 | LMXB/NS | ||||
| 362 | SWIFT J1824.35624 | 276.073 | 56.392 | 8.04 | IC 4709 | 276.0808 | 56.3692 | 5.30 | 0.67 | 0.37 | 0.05 | 0.0169 | 43.53 | Sy2 | ||
| 363 | SWIFT J1825.40000 | 276.344 | 0.007 | 14.06 | 4U 1822-000 | 276.3421 | 0.0122 | 5.38 | 0.27 | 0.00 | 0.03 | LMXB/NS | ||||
| 364 | SWIFT J1825.73705 | 276.426 | 37.075 | 101.08 | V691 CrA | 4U 1822-371 | 276.4450 | 37.1053 | 45.15 | 0.35 | 0.05 | 0.00 | LMXB | |||
| 365 | SWIFT J1829.44846 | 277.359 | 48.770 | 4.82 | 3C 380 | 277.3820 | 48.7460 | 2.56 | 0.54 | 0.47 | 0.10 | 0.6920 | 46.73 | Sy1.5 LPQ | ||
| 366 | SWIFT J1829.42346 | 277.360 | 23.763 | 244.65 | V4634 Sgr | Ginga 1826-24 | 277.3675 | 23.7969 | 175.79 | 0.61 | 0.30 | 0.00 | LMXB/NS | |||
| 367 | SWIFT J1830.80928 | 277.686 | 9.506 | 6.72 | 2MASX J18305065+0928414 | 277.7110 | 9.4783 | 3.94 | 0.64 | 0.36 | 0.06 | 0.0190 | 43.51 | Sy2 | ||
| 368 | SWIFT J1833.72105 | 278.418 | 21.078 | 8.52 | PKS 1830-21 | 278.4162 | 21.0611 | 9.41 | 0.91 | 0.51 | 0.05 | 2.5000 | 48.67 | Blazar | ||
| 369 | SWIFT J1833.71032 | 278.425 | 10.536 | 13.54 | SNR G21.5-00.9 | 278.3833 | 10.5600 | 8.63 | 0.63 | 0.33 | 0.03 | SNR | ||||
| 370 | SWIFT J1835.03240 | 278.760 | 32.665 | 16.94 | 3C 382 | 278.7641 | 32.6963 | 8.42 | 0.50 | 0.35 | 0.02 | 0.0579 | 44.83 | Sy1 | ||
| 371 | SWIFT J1835.63259 | 278.907 | 32.990 | 33.38 | XB 1832-330 | 278.9338 | 32.9914 | 24.31 | 0.63 | 0.36 | 0.01 | LMXB/NS | ||||
| 372 | SWIFT J1836.95924 | 279.225 | 59.403 | 5.56 | FAIRALL 0049 | 279.2429 | 59.4024 | 2.93 | 0.54 | 0.30 | 0.08 | 0.0202 | 43.43 | Sy2 | ||
| 373 | SWIFT J1837.90657 | 279.464 | 6.949 | 8.21 | PSR J1838-0655 | AX J1838.0-0655/ HESS J1837-069 | 279.4279 | 6.9275 | 4.69 | 0.67 | 0.41 | 0.07 | PSR/PWN | |||
| 374 | SWIFT J1838.46524 | 279.638 | 65.448 | 17.29 | ESO 103-035 | 279.5848 | 65.4276 | 11.14 | 0.59 | 0.35 | 0.02 | 0.0133 | 43.64 | Sy2 | ||
| 375 | SWIFT J1840.00501 | 279.992 | 5.025 | 98.36 | MM Ser | Ser X-1 | 279.9896 | 5.0358 | 33.58 | 0.24 | 0.01 | 0.00 | LMXB/NS | |||
| 376 | SWIFT J1841.20458 | 280.304 | 4.973 | 11.30 | AXP 1E 1841-045 | Kes 73 | 280.3300 | 4.9364 | 10.89 | 0.81 | 0.54 | 0.04 | AXP | |||
| 377 | SWIFT J1842.07945 | 280.655 | 79.768 | 25.24 | 3C 390.3 | 280.5375 | 79.7714 | 10.97 | 0.46 | 0.39 | 0.02 | 0.0561 | 44.92 | Sy1 | ||
| 378 | SWIFT J1844.56221 | 281.120 | 62.357 | 6.93 | Fairall 0051 | 281.2249 | 62.3648 | 4.57 | 0.66 | 0.44 | 0.07 | 0.0142 | 43.31 | Sy1 | ||
| 379 | SWIFT J1844.90435 | 281.236 | 4.581 | 5.19 | AX J1845.0-0433 | IGR J18450-0435 | 281.2588 | 4.5653 | 3.46 | 0.67 | 0.34 | 0.07 | HMXB | |||
| 380 | SWIFT J1845.70052 | 281.420 | 0.870 | 11.48 | Ginga 1843+00 | 281.4125 | 0.8917 | 6.28 | 0.52 | 0.27 | 0.04 | HMXB | ||||
| 381 | SWIFT J1846.50257 | 281.623 | 2.942 | 4.88 | AX J1846.4-0258 | 281.6020 | 2.9740 | 3.45 | 0.60 | 0.39 | 0.08 | PSR | ||||
| 382 | SWIFT J1848.20310 | 282.054 | 3.161 | 14.82 | IGR J18483-0311 | 282.0750 | 3.1617 | 9.03 | 0.56 | 0.29 | 0.03 | HMXB/NS | ||||
| 383 | SWIFT J1853.00843 | 283.256 | 8.712 | 26.23 | 4U 1850-086 | 283.2703 | 8.7057 | 14.72 | 0.59 | 0.33 | 0.02 | LMXB/NS | ||||
| 384 | SWIFT J1855.03110 | 283.760 | 31.170 | 18.77 | V1223 Sgr | 283.7593 | 31.1635 | 9.71 | 0.46 | 0.13 | 0.02 | CV/DQ Her | ||||
| 385 | SWIFT J1855.50237 | 283.866 | 2.616 | 39.39 | XTE J1855-026 | 283.8804 | 2.6067 | 21.54 | 0.48 | 0.25 | 0.01 | HMXB/NS | ||||
| 386 | SWIFT J1856.11539 | 284.022 | 15.644 | 5.47 | 2E 1853.7+1534 | 284.0053 | 15.6349 | 3.16 | 0.53 | 0.39 | 0.07 | 0.0840 | 44.74 | Sy1 | ||
| 387 | SWIFT J1856.27829 | 284.061 | 78.479 | 5.06 | 2MASX J18570768-7828212 | 284.2823 | 78.4725 | 2.47 | AB | 0.42 | 0.0420 | 44.01 | Sy1 | |||
| 388 | ” | ” | ” | ” | [HB91] 1846-786 | 283.4860 | 78.5400 | 1.75 | AB | 0.49 | 0.0760 | 44.39 | Sy1 | |||
| 389 | SWIFT J1858.90329 | 284.734 | 3.480 | 5.12 | XTE J1858+034 | 284.6790 | 3.4340 | 2.20 | 0.32 | 0.03 | 0.08 | HMXB/NS | ||||
| 390 | SWIFT J1900.22455 | 285.050 | 24.914 | 79.77 | HETE J1900.1-2455 | 285.0360 | 24.9205 | 55.74 | 0.64 | 0.33 | 0.00 | LMXB/msPSR | ||||
| 391 | SWIFT J1901.60129 | 285.401 | 1.475 | 10.25 | XTE J1901+014 | 285.4208 | 1.4385 | 6.73 | 0.60 | 0.34 | 0.04 | SRC/GAMMA | ||||
| 392 | SWIFT J1907.32050 | 286.882 | 20.830 | 5.78 | V1082 Sgr | 286.8411 | 20.7808 | 2.75 | 0.53 | 0.25 | 0.08 | CV | ||||
| 393 | SWIFT J1909.60948 | 287.408 | 9.804 | 66.62 | 4U 1907+09 | 287.4079 | 9.8303 | 26.23 | 0.34 | 0.05 | 0.01 | HMXB/NS | ||||
| 394 | SWIFT J1910.80739 | 287.688 | 7.645 | 58.10 | 2MASS J19104821+0735516 | 4U 1909+07 | 287.7000 | 7.5983 | 25.79 | 0.46 | 0.23 | 0.01 | HMXB/NS | |||
| 395 | SWIFT J1911.20036 | 287.807 | 0.603 | 21.25 | Aql X-1 | 287.8167 | 0.5850 | 13.17 | 0.56 | 0.32 | 0.02 | LMXB | ||||
| 396 | SWIFT J1912.00500 | 287.999 | 5.003 | 27.20 | SS 433 | 287.9565 | 4.9827 | 12.01 | 0.43 | 0.21 | 0.02 | uQuasar | ||||
| 397 | SWIFT J1914.00951 | 288.496 | 9.853 | 31.99 | 2MASS J19140422+0952577 | IGR J19140+0951 | 288.5083 | 9.8883 | 16.82 | 0.46 | 0.23 | 0.01 | HMXB | |||
| 398 | SWIFT J1915.31057 | 288.816 | 10.953 | 840.73 | GRS 1915+105 | 288.7983 | 10.9456 | 386.66 | 0.40 | 0.17 | 0.00 | LMXB/BH | ||||
| 399 | SWIFT J1918.60516 | 289.654 | 5.265 | 31.84 | V1405 Aql | 4U 1916-053 | 289.6995 | 5.2381 | 16.17 | 0.51 | 0.22 | 0.01 | LMXB/NS | |||
| 400 | SWIFT J1921.14356 | 290.273 | 43.925 | 10.36 | ABELL 2319 | 290.1889 | 43.9619 | 2.62 | 0.26 | 0.10 | 0.05 | 0.0557 | 44.29 | Galaxy cluster | ||
| 401 | SWIFT J1921.15842 | 290.275 | 58.694 | 8.23 | ESO 141- G 055 | 290.3090 | 58.6703 | 5.27 | 0.58 | 0.32 | 0.04 | 0.0360 | 44.20 | Sy1 | ||
| 402 | SWIFT J1922.71716 | 290.692 | 17.283 | 20.96 | SWIFT J1922.7-1716 | SWIFT J192237.0-171702 | 290.6542 | 17.2842 | 14.69 | 0.67 | 0.33 | 0.02 | XRB/ uQuasar? | |||
| 403 | SWIFT J1924.55014 | 291.114 | 50.239 | 7.87 | CH Cyg | 2MASS J19243305+5014289 | 291.1378 | 50.2414 | 2.26 | 0.24 | 0.08 | 0.06 | Symb/WD | |||
| 404 | SWIFT J1930.53414 | 292.656 | 34.193 | 7.63 | 2MASX J19301380+3410495 | 292.5575 | 34.1805 | 3.26 | 0.52 | 0.40 | 0.07 | 0.0629 | 44.49 | Sy1 | ||
| 405 | SWIFT J1933.93258 | 293.426 | 32.938 | 5.43 | 2MASS J19334715+3254259 | 1RXS J193347.6+325422 | 293.4483 | 32.9061 | 2.30 | 0.49 | 0.37 | 0.08 | 0.0578 | 44.26 | Sy1.2 | |
| 406 | SWIFT J1940.31028 | 295.076 | 10.473 | 10.25 | V1432 Aql | 295.0478 | 10.4236 | 5.40 | 0.49 | 0.21 | 0.04 | CV/AM Her | ||||
| 407 | SWIFT J1942.61024 | 295.684 | 10.322 | 11.28 | NGC 6814 | 295.6694 | 10.3235 | 7.82 | 0.69 | 0.38 | 0.04 | 0.0052 | 42.67 | Sy1.5 | ||
| 408 | SWIFT J1942.83220 | 295.690 | 32.339 | 4.81 | V2491 Cyg | 295.7582 | 32.3205 | 1.84 | 0.54 | 0.38 | 0.11 | CV/Nova | ||||
| 409 | SWIFT J1943.52120 | 295.957 | 21.289 | 7.94 | SWIFT J194353.0+212119 | IGR J19443+2117 | 295.9842 | 21.3064 | 4.42 | 0.55 | 0.38 | 0.05 | SRC/X-ray | |||
| 410 | SWIFT J1947.34447 | 296.833 | 44.790 | 5.13 | 2MASX J19471938+4449425 | 296.8307 | 44.8284 | 2.44 | 0.52 | 0.40 | 0.09 | 0.0539 | 44.23 | Sy2 | ||
| 411 | SWIFT J1949.53012 | 297.423 | 30.156 | 20.98 | KS 1947+300 | 297.3771 | 30.2067 | 8.18 | 0.38 | 0.24 | 0.02 | HMXB/NS | ||||
| 412 | SWIFT J1952.40237 | 298.039 | 2.449 | 5.45 | 3C 403 | 298.0660 | 2.5070 | 4.27 | 0.81 | 0.55 | 0.09 | 0.0590 | 44.55 | Sy2 | ||
| 413 | SWIFT J1955.83203 | 298.953 | 32.049 | 97.31 | TYC 2673-2004-1 | 4U 1954+31 | 298.9264 | 32.0970 | 35.52 | 0.33 | 0.17 | 0.00 | LMXB | |||
| 414 | SWIFT J1958.43510 | 299.602 | 35.171 | 4304.23 | Cyg X-1 | 299.5903 | 35.2016 | 2245.76 | 0.52 | 0.41 | 0.00 | HMXB/BH | ||||
| 415 | SWIFT J1959.44044 | 299.807 | 40.731 | 25.99 | Cygnus A | 299.8682 | 40.7339 | 12.23 | 0.49 | 0.37 | 0.02 | 0.0561 | 44.96 | Sy2 | ||
| 416 | SWIFT J1959.66507 | 299.990 | 65.195 | 11.23 | QSO B1959+650 | 1ES 1959+650 | 299.9994 | 65.1485 | 3.87 | 0.36 | 0.24 | 0.04 | 0.0470 | 44.30 | BL Lac | |
| 417 | SWIFT J2000.63210 | 300.063 | 32.176 | 7.87 | USNO-A2.0 1200-14131541 | 2MASS J20002185+3211232 | 300.0913 | 32.1894 | 3.25 | 0.40 | 0.26 | 0.05 | HMXB | |||
| 418 | SWIFT J2009.06103 | 302.159 | 61.078 | 8.71 | NGC 6860 | 302.1954 | 61.1002 | 6.50 | 0.73 | 0.40 | 0.05 | 0.0149 | 43.51 | Sy1 | ||
| 419 | SWIFT J2018.84041 | 304.697 | 40.691 | 5.36 | 2MASX J20183871+4041003 | IGR J20187+4041 | 304.6613 | 40.6834 | 3.36 | 0.55 | 0.47 | 0.08 | 0.0144 | 43.19 | Sy2 | |
| 420 | SWIFT J2028.52543 | 307.114 | 25.784 | 14.88 | MCG +04-48-002 | 307.1461 | 25.7333 | 8.77 | 0.59 | 0.45 | 0.03 | 0.0139 | 43.58 | Sy2 | ||
| 421 | SWIFT J2032.23738 | 308.053 | 37.626 | 276.33 | EXO 2030+375 | 308.0633 | 37.6375 | 99.67 | 0.35 | 0.21 | 0.00 | HMXB/NS | ||||
| 422 | SWIFT J2032.54055 | 308.125 | 40.915 | 753.06 | Cyg X-3 | V1521 Cyg | 308.1074 | 40.9578 | 238.90 | 0.32 | 0.16 | 0.00 | HMXB/NS | |||
| 423 | SWIFT J2033.42147 | 308.341 | 21.774 | 6.48 | 4C +21.55 | 308.3835 | 21.7729 | 3.26 | 0.49 | 0.38 | 0.06 | 0.1735 | 45.44 | QSO | ||
| 424 | SWIFT J2037.24151 | 309.214 | 41.871 | 7.02 | SWIFT J203705.78-415005.1 | SWIFT J2037.2+4151 | 309.3000 | 41.8500 | 1.71 | 0.19 | 0.00 | 0.07 | transient | |||
| 425 | SWIFT J2042.37507 | 310.753 | 75.121 | 13.49 | 4C +74.26 | 310.6554 | 75.1340 | 5.02 | 0.41 | 0.32 | 0.03 | 0.1040 | 45.14 | Sy1 | ||
| 426 | SWIFT J2044.02832 | 311.042 | 28.510 | 5.83 | RX J2044.0+2833 | 311.0188 | 28.5534 | 2.53 | 0.46 | 0.35 | 0.07 | 0.0500 | 44.17 | Sy1 | ||
| 427 | SWIFT J2044.21045 | 311.047 | 10.699 | 14.89 | Mrk 509 | 311.0406 | 10.7235 | 9.44 | 0.68 | 0.37 | 0.03 | 0.0344 | 44.41 | Sy1.2 | ||
| 428 | SWIFT J2052.05704 | 312.979 | 57.057 | 10.93 | IC 5063 | 313.0098 | 57.0688 | 8.59 | 0.72 | 0.40 | 0.04 | 0.0114 | 43.39 | Sy2 | ||
| 429 | SWIFT J2114.48206 | 318.530 | 82.065 | 9.44 | 2MASX J21140128+8204483 | 318.5049 | 82.0801 | 4.21 | 0.51 | 0.44 | 0.05 | 0.0840 | 44.87 | Sy1 | ||
| 430 | SWIFT J2117.55139 | 319.365 | 51.649 | 6.88 | 2MASX J21174741+5138523 | 319.4480 | 51.6483 | 3.14 | 0.52 | 0.46 | 0.06 | ? | Galaxy | |||
| 431 | SWIFT J2118.93336 | 319.715 | 33.638 | 4.84 | 2MASX J21192912+3332566 | 319.8714 | 33.5491 | 1.53 | 0.44 | 0.39 | 0.12 | 0.0507 | 43.97 | Sy1 | ||
| 432 | SWIFT J2123.54217 | 320.871 | 42.279 | 4.99 | V2069 Cyg | 320.9370 | 42.3010 | 1.21 | 0.29 | 0.10 | 0.12 | CV | ||||
| 433 | SWIFT J2123.62506 | 320.911 | 25.095 | 4.86 | 3C 433 | 320.9356 | 25.0700 | 1.74 | 0.44 | 0.29 | 0.08 | 0.1016 | 44.66 | Sy2 NLRG | ||
| 434 | SWIFT J2124.65057 | 321.156 | 51.000 | 43.15 | 4C 50.55 | IGR J21247+5058 | 321.1641 | 50.9738 | 17.81 | 0.47 | 0.39 | 0.01 | 0.0200 | 44.21 | BLRG, not Sy 1 | |
| 435 | SWIFT J2127.45654 | 321.953 | 56.892 | 9.99 | SWIFT J212745.58+565635.6 | IGR J21277+5656 | 321.9373 | 56.9444 | 3.87 | 0.39 | 0.25 | 0.04 | 0.0147 | 43.27 | Sy1 | |
| 436 | SWIFT J2129.91209 | 322.468 | 12.147 | 22.11 | NGC 7078 AC 211 | 4U 2129+12 | 322.4929 | 12.1674 | 9.16 | 0.45 | 0.27 | 0.02 | LMXB | |||
| 437 | SWIFT J2132.03343 | 322.972 | 33.698 | 8.26 | 6dF J2132022-334254 | 323.0092 | 33.7150 | 5.55 | 0.74 | 0.42 | 0.05 | 0.0293 | 44.04 | Sy1 | ||
| 438 | SWIFT J2133.65105 | 323.409 | 51.080 | 16.49 | RX J2133.7+5107 | 323.4320 | 51.1236 | 5.23 | 0.33 | 0.19 | 0.03 | CV/DQ Her | ||||
| 439 | SWIFT J2156.14728 | 324.064 | 47.523 | 6.11 | 2MASX J21355399+4728217 | 323.9750 | 47.4727 | 2.68 | 0.47 | B | 0.41 | 0.07 | 0.0250 | 43.58 | Sy1 | |
| 440 | ” | ” | ” | ” | IGR J21347+4737 | 323.8460 | 47.5770 | 1.50 | A | 0.44 | XRB | |||||
| 441 | SWIFT J2135.56222 | 324.067 | 62.387 | 7.37 | 1RXS J213623.1-622400 | 324.0963 | 62.4002 | 3.88 | 0.57 | 0.35 | 0.06 | 0.0588 | 44.51 | Sy1 | ||
| 442 | SWIFT J2142.74337 | 325.686 | 43.621 | 13.88 | SS Cyg | 325.6784 | 43.5861 | 4.57 | 0.33 | 0.18 | 0.03 | CV/Dwarf N | ||||
| 443 | SWIFT J2144.73816 | 326.166 | 38.274 | 257.42 | Cyg X-2 | 326.1717 | 38.3217 | 59.99 | 0.18 | 0.02 | 0.00 | LMXB/NS | ||||
| 444 | SWIFT J2152.03030 | 328.002 | 30.503 | 12.42 | PKS 2149-306 | 327.9814 | 30.4649 | 10.58 | 0.96 | 0.54 | 0.04 | 2.3450 | 48.65 | Blazar | ||
| 445 | SWIFT J2200.91032 | 330.144 | 10.567 | 6.16 | MRK 520 | 330.1724 | 10.5524 | 3.58 | 0.64 | 0.43 | 0.07 | 0.0266 | 43.76 | Sy1.9 | ||
| 446 | SWIFT J2201.93152 | 330.550 | 31.838 | 27.37 | NGC 7172 | 330.5080 | 31.8698 | 18.11 | 0.70 | 0.42 | 0.02 | 0.0087 | 43.48 | Sy2 | ||
| 447 | SWIFT J2202.84218 | 330.698 | 42.304 | 7.72 | BL Lac | 330.6804 | 42.2778 | 4.40 | 0.51 | 0.44 | 0.06 | 0.0686 | 44.70 | BL Lac | ||
| 448 | SWIFT J2207.85432 | 331.952 | 54.539 | 61.64 | BD+53 2790 | 4U 2206+54 | 331.9843 | 54.5185 | 22.44 | 0.40 | 0.28 | 0.01 | HMXB/NS | |||
| 449 | SWIFT J2209.44711 | 332.301 | 47.191 | 8.06 | NGC 7213 | 332.3177 | 47.1667 | 5.75 | 0.67 | 0.44 | 0.05 | 0.0058 | 42.64 | Sy1.5 | ||
| 450 | SWIFT J2217.50812 | 334.467 | 8.371 | 13.02 | FO AQR | 334.4810 | 8.3513 | 5.85 | 0.36 | 0.11 | 0.03 | CV/DQ Her | ||||
| 451 | SWIFT J2223.90207 | 335.977 | 2.119 | 7.62 | 3C 445 | 335.9566 | 2.1034 | 4.37 | 0.58 | 0.40 | 0.05 | 0.0562 | 44.52 | Sy2 | ||
| 452 | SWIFT J2223.81143 | 335.991 | 11.801 | 5.71 | MCG +02-57-002 | 335.9380 | 11.8360 | 2.08 | 0.45 | 0.32 | 0.09 | 0.0290 | 43.60 | Sy1.5 | ||
| 453 | SWIFT J2229.96646 | 337.354 | 66.753 | 5.37 | 87GB 222741.2+663124 | 337.2999 | 66.7846 | 2.79 | 0.61 | 0.51 | 0.08 | 0.1130 | 44.96 | Sy1 | ||
| 454 | SWIFT J2232.51141 | 338.136 | 11.685 | 6.20 | [HB89] 2230+114 | 338.1517 | 11.7308 | 4.17 | 0.65 | 0.53 | 0.07 | 1.0370 | 47.38 | Blazar HP | ||
| 455 | SWIFT J2235.92602 | 338.906 | 26.117 | 9.31 | NGC 7314 | 338.9426 | 26.0503 | 4.63 | 0.59 | 0.37 | 0.05 | 0.0048 | 42.37 | Sy1.9 | ||
| 456 | SWIFT J2235.93358 | 339.006 | 33.925 | 8.35 | NGC 7319 | 339.0148 | 33.9757 | 3.96 | 0.52 | 0.41 | 0.05 | 0.0225 | 43.66 | Sy2 | ||
| 457 | SWIFT J2236.71233 | 339.176 | 12.550 | 6.41 | MRK 0915 | 339.1938 | 12.5452 | 4.99 | 0.71 | 0.49 | 0.07 | 0.0241 | 43.82 | Sy1 | ||
| 458 | SWIFT J2246.03941 | 341.462 | 39.638 | 9.43 | 3C 452 | 341.4532 | 39.6877 | 3.78 | 0.48 | 0.37 | 0.05 | 0.0811 | 44.79 | Sy2 | ||
| 459 | SWIFT J2251.92215 | 343.008 | 22.281 | 5.14 | MG3 J225155+2217 | 342.9729 | 22.2937 | 3.11 | 0.63 | 0.52 | 0.09 | 3.6680 | 48.59 | QSO | ||
| 460 | SWIFT J2253.91608 | 343.477 | 16.140 | 26.13 | 3C 454.3 | 343.4906 | 16.1482 | 15.89 | 0.65 | 0.53 | 0.02 | 0.8590 | 47.76 | Blazar | ||
| 461 | SWIFT J2254.11734 | 343.491 | 17.572 | 17.90 | MR 2251-178 | 343.5242 | 17.5819 | 9.17 | 0.53 | 0.35 | 0.02 | 0.0640 | 44.96 | Sy1 | ||
| 462 | SWIFT J2255.40309 | 343.838 | 3.154 | 8.83 | AO Psc | 3A 2253-033 | 343.8249 | 3.1779 | 2.92 | 0.28 | 0.07 | 0.06 | CV/DQ Her | |||
| 463 | SWIFT J2258.94054 | 344.761 | 40.896 | 6.14 | UGC 12282 | 344.7312 | 40.9315 | 2.49 | 0.50 | 0.38 | 0.07 | 0.0170 | 43.21 | Sy1.9 | ||
| 464 | SWIFT J2259.72458 | 344.932 | 24.942 | 7.17 | KAZ 320 | 344.8871 | 24.9182 | 2.88 | 0.51 | 0.37 | 0.07 | 0.0345 | 43.90 | Sy1 | ||
| 465 | SWIFT J2303.30852 | 345.800 | 8.839 | 15.16 | NGC 7469 | 345.8151 | 8.8740 | 6.66 | 0.44 | 0.32 | 0.03 | 0.0163 | 43.60 | Sy1.2 | ||
| 466 | SWIFT J2304.80843 | 346.168 | 8.697 | 18.38 | Mrk 926 | 346.1811 | 8.6857 | 10.17 | 0.57 | 0.39 | 0.02 | 0.0469 | 44.72 | Sy1.5 | ||
| 467 | SWIFT J2318.44223 | 349.630 | 42.380 | 16.24 | NGC 7582 | 349.5979 | 42.3706 | 7.92 | 0.55 | 0.40 | 0.03 | 0.0052 | 42.68 | Sy2 | ||
| 468 | SWIFT J2318.90013 | 349.734 | 0.220 | 9.70 | NGC 7603 | 349.7359 | 0.2440 | 4.70 | 0.51 | 0.34 | 0.04 | 0.0295 | 43.97 | Sy1.5 | ||
| 469 | SWIFT J2319.42619 | 349.893 | 26.307 | 5.14 | MRK 322 | 350.0130 | 26.2160 | 0.64 | A | 0.19 | 0.0266 | 43.02 | Galaxy | |||
| 470 | ” | ” | ” | ” | UGC 12515 | 349.9630 | 26.2630 | 1.28 | 0.37 | B | 0.24 | 0.11 | 0.0265 | 43.31 | Galaxy | |
| 471 | ” | ” | ” | ” | SWIFT J231930.4+261517 | 349.8765 | 26.2548 | 0.28 | A | 0.13 | CV/AM Her | |||||
| 472 | SWIFT J2323.35849 | 350.830 | 58.813 | 22.84 | Cas A | 350.8500 | 58.8150 | 6.78 | 0.32 | 0.19 | 0.02 | SNR | ||||
| 473 | SWIFT J2325.53827 | 351.334 | 38.484 | 5.64 | LCRS B232242.2-384320 | 351.3508 | 38.4470 | 2.41 | 0.47 | 0.27 | 0.07 | 0.0359 | 43.86 | Sy1 | ||
| 474 | SWIFT J2325.62157 | 351.410 | 21.952 | 4.85 | 2MASX J23255427+2153142 | 351.4760 | 21.8870 | 1.63 | 0.42 | 0.22 | 0.10 | 0.1200 | 44.79 | Sy1 | ||
| 475 | SWIFT J2327.60629 | 351.935 | 6.418 | 4.92 | SWIFT J2327.6+0629 | 351.9350 | 6.4180 | 2.55 | 0.62 | 0.40 | 0.09 | ? | ||||
| 476 | SWIFT J2328.90328 | 352.218 | 3.465 | 5.04 | NGC 7682 | 352.2664 | 3.5333 | 2.27 | AB | 0.35 | 0.0171 | 43.18 | Sy2 | |||
| 477 | ” | ” | ” | ” | NGC 7679 | 352.1944 | 3.5114 | 2.33 | AB | 0.35 | 0.0171 | 43.19 | Sy1 / LIRG | |||
| 478 | SWIFT J2341.83033 | 355.464 | 30.614 | 6.69 | UGC 12741 | 355.4811 | 30.5818 | 4.00 | 0.59 | 0.52 | 0.07 | 0.0174 | 43.44 | Galaxy | ||
| 479 | SWIFT J2358.43339 | 359.601 | 33.642 | 4.85 | SWIFT J2358.4+3339 | 359.6010 | 33.6420 | 2.08 | 0.61 | 0.42 | 0.10 | ? |
References. — Bikmaev et al. (2008, 2006); Bodaghee et al. (2006, 2007); Burenin et al. (2008); Butler et al. (2009); Chakrabarty et al. (2002); Coe et al. (1994); Homer et al. (2002); Israel et al. (2001); Juett & Chakrabarty (2005); Markwardt et al. (2005); Masetti et al. (2008, 2009); Rodriguez et al. (2009); Tomsick et al. (2008); Tueller et al. (2008); Walter et al. (2006); Wilson et al. (2003)