11email: Matteo.Guainazzi@sciops.esa.int
2Institute of Technology, University of Linköping, SE-581 83, Linköping, Sweden
3Harvard-Smithsonian Centre for Astrophysics, 60 Garden St., Cambridge, MA 02138, USA
4Departamento de Astrofísica Molecular e Infrarroja, Instituto de Estructura de la Materia (CSIC), Madrid, Spain
5H. H. Wills Physics Laboratory, University of Bristol, Tyndall Avenue, Bristol BS8 1TL, United Kingdom
6Istituto di Astrofisica Spaziale e Fisica Cosmica-Bologna, INAF, via Gobetti 101, I-40129 Bologna
7Osservatorio Astronomico di Roma (INAF), via Frascati 33, 00040 Monteporzio Catone, Roma, Italy
The X-ray view of Giga-Hertz peaked spectrum radio galaxies
Abstract
Context. This paper presents the X-ray properties of a flux- and volume-limited complete sample of 16 Giga-Hertz Peaked Spectrum (GPS) galaxies.
Aims. This study addresses three basic questions in our understanding of the nature and evolution of GPS sources: a) What is the physical origin of the X-ray emission in GPS galaxies? b) What physical system is associated with the X-ray obscuration? c) What is the “endpoint” of the evolution of compact radio sources?
Methods. We discuss the results of the X-ray spectral analysis, and compare the X-ray properties of the sample sources with radio observables.
Results. We obtain a 100% (94%) detection fraction in the 0.5–2 keV (0.5–10 keV) energy band. GPS galaxy X-ray spectra are typically highly obscured ( cm-2; dex). The X-ray column density is higher than the HI column density measured in the radio by a factor of 10 to 100. GPS galaxies lie well on the extrapolation to high radio powers of the correlation between radio and X-ray luminosity known in low-luminosity FR I radio galaxies. On the other hand, GPS galaxies exhibit a comparable X-ray luminosity to FR II radio galaxies, notwithstanding their much higher radio luminosity.
Conclusions. The X-ray to radio luminosity ratio distribution in our sample is consistent with the bulk of the high-energy emission being produced by the accretion disk, as well as with dynamical models of GPS evolution where X-rays are produced by Compton upscattering of ambient photons. Further support for the former scenario comes from the location of GPS galaxies in the X-ray to O[iii] luminosity ratio versus plane. We propose that GPS galaxies are young radio sources, which would reach their full maturity as classical FR II radio galaxies. However, column densities 1022 cm-2 could lead to a significant underestimate of dynamical age determinations based on the hotspot recession velocity measurements.
Key Words.:
Galaxies: jets – Galaxies: active – X-ray: galaxies1 The nature of GPS radio galaxies
This paper presents an X-ray study of a complete radio-selected sample of giga-hertz peaked spectrum (GPS) galaxies. GPS sources are characterised by a simple convex radio spectrum peaking near 1 GHz (Stanghellini 2006, Lister 2003, O’Dea 1998). They represent about 10% of the 5-GHz selected sources. About half of the known GPS sources are morphologically classified as galaxies, the remaining as quasars. They often exhibit symmetric, very compact (10–100 pc) structures, reminiscent of those present in extended radio galaxies on much larger scales.
Little is known about their high-energy emission. GPS galaxies are rather elusive in X-rays (O’Dea et al. 1996). X-ray spectroscopic studies prior to modern X-ray observatories were inconclusive on whether this low detection rate is due to intrinsic weakness or to obscuration of the active nucleus (Elvis et al. 1994a ). Deep Chandra and XMM-Newton observations of GPS galaxies are scanty. One of the few exceptions is a deep XMM-Newton pointing of 3C301.1 (O’Dea et al. (2006)); it revealed a hard X-ray emission component, which could be associated with hot gas shocked by the expansion of the radio source or to synchrotron self-Compton emission. Analysis of small samples of GPS galaxies observed with XMM-Newton were presented by Vink et al. (2005) and Guainazzi et al. (2006). Our paper represents an extension of their results.
Understanding the origin of high-energy emission in these objects may have important implications for the birth and evolution of the “radio power” in the Universe. GPS sources were originally suggested to represent radio galaxies in the early stage of their life (typical ages years; Fanti et al. 1995; Murgia 2003). This possibility was recently supported by the detection of hotspot proper motions (Poladitis & Conway 2003; Gugliucci et al. 2005). Alternatively, as originally suggested by Gopal-Krishna & Wiita (1991), GPS sources could remain compact during their whole radiative lifetime, because interaction with dense circumnuclear matter impedes their full growth.
In order to address the above issues, and provide the best possible estimate of the gas density in the GPS galaxy nuclear environment, we have undertaken an XMM-Newton observation program of a radio-selected complete sample of GPS galaxies. The three main issues which originally motivated our study, that will be discussed throughout the paper, are:
-
•
What is the physical origin of the X-ray emission in GPS galaxies?
-
•
Which physical system is associated with the X-ray obscuration?
-
•
What is the “endpoint” of the evolution of compact radio sources?
This paper is structured as follows: in Sect. 2 we present the sample. The data reduction procedure and the results of the spectral analysis on the unpublished sources are presented in Sect. 3 and 4, respectively. This paper does not discuss the X-ray spectral analysis of sources published elsewhere (Guainazzi et al. (2006); Vink et al. (2005)). In Sect. 5 we summarise the X-ray properties of the whole GPS sample, and compare these with a control sample of large-scale radio galaxies. Finally, we discuss our results in Sect. 6, and summarise our findings and their possible implications for the evolution of GPS sources in Sect. 7. We adopt throughout the paper a cosmology with km s-1 Mpc-1, =0.73, and =0.27 (Spergel et al. (2007)).
2 The sample
The sources discussed in this paper constitute a flux- and volume-limited sub-sample extracted from the complete radio-selected sample of GPS galaxies of Stanghellini et al. (1998). We refer to this sub-sample as “our GPS sample” hereafter. We selected all sources with redshift 1, and flux density at 5 GHz 1 Jy. The whole sample (16 sources) has been observed with XMM-Newton across different observing cycles. The only exceptions are PKS 094108 and PKS1345+125, for which archival Chandra and ASCA data are available, respectively. Preliminary results, based on a small sub-sample of 5 objects, were presented in Guainazzi et al. (2006)111Guainazzi et al. (2006) present also data of COINSJ0029+3456; this source was later discovered to host a blazar, and will not be considered in the sample discussed in this paper.. Some of the sample sources were included in Vink et al. (2005). The whole sample is listed in Table 1.
| NED name | J2000 name | za | Observation IDb | Observation date | Referencec |
|---|---|---|---|---|---|
| 4C+00.02 | 002225+001456 | 0.305 | 0407030101 | 2006-Jun-26 | (1) |
| COINSJ0111+3906 | 011137+390628 | 0.668 | 0202520101 | 2004-Jan-09 | (2) |
| PKS0428+20 | 043103+203734 | 0.219 | 0407030201 | 2006-Sep-02 | (1) |
| PKS0500+019 | 050321+020305 | 0.585 | 0205180601 | 2004-Aug-18 | (3) |
| B30710+439 | 071338+434917 | 0.518 | 0202520201 | 2004-Mar-23 | (2) |
| PKS0941080 | 094336081931 | 0.228 | Chandra | (3) | |
| B1031+567 | 103507+562847 | 0.450 | 0202520301 | 2004-Oct-21 | (2) |
| 4C+14.41 | 112027+142054 | 0.362 | 0502510201 | 2007-Jun-13 | (1) |
| 4C+32.44 | 132616+315409 | 0.370 | 0502510301 | 2007-Dec-05 | (1) |
| PKS1345+125 | 134733+121724 | 0.122 | ASCA | (4) | |
| 4C+62.22 | 140028+621038 | 0.431 | 0202520401 | 2004-Apr-14 | (2) |
| OQ+208 | 140700+133438 | 0.077 | 0140960101 | 2003-Jan-31 | (5) |
| PKS1607+26 | 160913+264129 | 0.473 | 0502510401 | 2008-Jan-17 | (1) |
| 0502510801 | 2008-Jan-19 | ||||
| PKS2008068 | 201114064403 | 0.547 | 0502510501 | 2007-Oct-12 | (1) |
| PKS2127+04 | 213032+050217 | 0.990 | 0502510601 | 2007-May-17 | (1,6,7) |
| COINSJ2355+4950 | 235509+494008 | 0.238 | 0202520501 | 2003-Dec-26 | (2) |
A more general discussion of the X-ray and multiwavelength properties of our whole GPS sample is deferred to Sect. 5. A summary of the X-ray and radio properties of the whole sample is in Appendix B.
3 Observations and data reduction
In this paper [as also originally done by Guainazzi et al. (2006) and Vink et al. (2005)] we will consider only X-ray data taken with the XMM-Newton EPIC cameras (pn, Strüder et al. (2001); MOS, Turner et al. (2001)), because the sources were too faint to yield a measurable signal in the high-resolution RGS cameras. Observational information for the sources for which new measurements are presented here is listed in Table 2.
| Source | NH,Gal | Texp | |||
|---|---|---|---|---|---|
| (ks) | (s-1) | (″) | (10-3 s-1) | ||
| 4C+00.02 | 2.7 | 22.2 | 2.1 | … | a |
| PKS0428+20 | 19.6 | 15.4 | 0.75 | 23 | |
| 4C+14.41 | 2.0 | 16.3 | 0.5 | 15 | |
| 4C+32.44 | 1.2 | 20.5 | 0.5 | 16 | |
| PKS1607+26 | 3.8 | 18.5 | 18 | 20 | |
| PKS2008068 | 5.0 | 23.2 | 0.75 | 15 | |
| PKS2127+04 | 5.0 | 10.8 | 0.5 | 25 |
adetected only in the soft X-ray band (0.5–2 keV), with a count rate: s-1.
XMM-Newton data were reduced with SASv7.1 (Gabriel et al. (2003)) according to standard procedures as in, e.g., Guainazzi et al. (2006). The most updated calibration files available at the date of the analysis (February 2008) were used. Source scientific products were accumulated from circular regions surrounding the position of the optical nucleus of each source (extracted from the NED catalogue)222http://nedwww.ipac.caltech.edu/. The size of the source extraction regions are shown in Table 2. Following Guainazzi (2008), background scientific products were extracted from source free circular regions close to the source and on the same CCD as the source for the MOS cameras; and from source-free regions centred at the same row in detector coordinates as the source in nearby CCDs for the pn. As many of the sources were X-ray faint, particular care has been applied in the choice of flaring particle background rejection thresholds optimising the signal-to-noise ratio of the final scientific products. Using a single-event, 10 keV full field-of-view light curve as a monitoring tool of the instantaneous intensity of the background, ten different logarithmically spaced thresholds between 0.1 and about two times the highest light curve count rates were tried. For each threshold the radius of the source extraction region was also varied to obtain the highest number of net counts for a given signal-to-noise ratio. Spectra were binned in such a way as to avoid oversampling of the intrinsic instrumental energy resolution by a factor larger than 3, and to have at least 25 background-subtracted counts in each spectral bin. These conditions ensure the applicability of the statistic as a goodness-of-fit test.
In this paper, errors on the spectral parameters and on any derived quantities are at the 90% confidence level for one interesting parameter; errors on the count rates and derived quantities are at 1 level. Whenever statistical moments or correlations on distributions including upper limits are calculated, an extension of the regression method on censored data originally described by Schmitt (1985) and Isobe et al. (1986) has been used. More details on this method were presented by Guainazzi et al. (2006).
4 Results
In this Section we present spectral-analysis for the 7 unpublished sources in our GPS sample.
No significant variability in either integrated X-ray flux or spectral shape was detected in any source presented in this paper on timescales 104 s. We therefore focus on the properties of their time-averaged spectra.
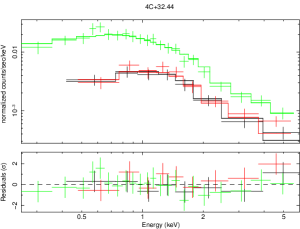
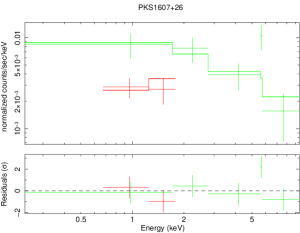
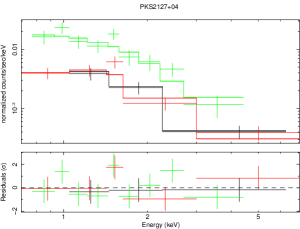
For 3 of these sources the number of degrees of freedom in the binned spectra was larger than 4: 4C+32.44, PKS1607+26, PKS 2127+04. In these cases a standard spectral analysis was possible. The spectra were fitted in the 0.2–10 keV energy range with Xspec (version 11; Arnaud (1996)). A model consisting of three components was used:
| (1) |
where the photo-electric absorption components use Wisconsin cross-sections (Morrison & McCammon (1983)), and is the unabsorbed spectral normalisation at 1 keV. We’ll refer to this model as our “baseline” model hereafter. The column density was kept fixed to the contribution by intervening gas in the Galaxy as measured in the Leiden/Argentine/Bonn (LAB) Survey of Galactic HI (Kalberla et al. (2005))333http://heasarc.gsfc.nasa.gov/cgi-bin/Tools/w3nh/w3nh.pl, whereas is the column density of local gas at the galaxy redshift. The results of the spectral fitting are shown in Fig. 1 and summarised in Table 3.
| Source | F2-10 | Fe Kα EW | ||||
|---|---|---|---|---|---|---|
| (1021 cm2) | (10-13 ergs cm-2 s-1) | (keV) | ||||
| 4C+32.44 | 1.0 | 20.6/36 | ||||
| PKS1607+26 | 2 | 0.7 | 32.2/21 | |||
| PKS2127+04 | 1.98 | 0.9 | 14.7/16 |
ain erg s-1
X-ray luminosities in this table and hereafter are K-corrected and based on the best-fit model for each source. Addition of a Gaussian profile to the baseline model to characterise line emission never improved significantly the quality of the fit. The upper limits on the Equivalent Width (EW) of an unresolved Fe neutral fluorescent line are also reported in Table 3. They are generally inconclusive. Best-fit models and residuals are shown in Fig. 1.
For 4 other sources (4C+00.02, PKS 0428+20, 4C+14.41, and PKS 2008068) the low signal-to-noise did not allow for spectral analysis. We have therefore based our estimation of the spectral parameters of the baseline model on the Hardness Ratio (HR), here defined as the ratio between the counts in the energy bands 1–10 keV and 0.2–1 keV. The measured HRs (or lower limit thereof) have been compared with the predictions of grids of simulated baseline models. Iso-HR contour plots in the ([0.5:3]) versus ([1020,1024 cm-2]) parameter space were built (see Fig. 2)
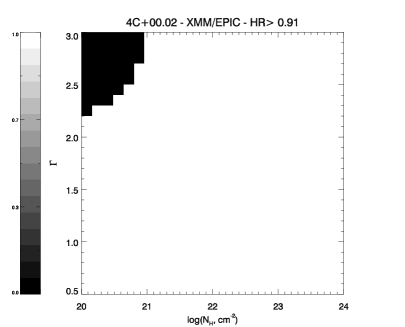
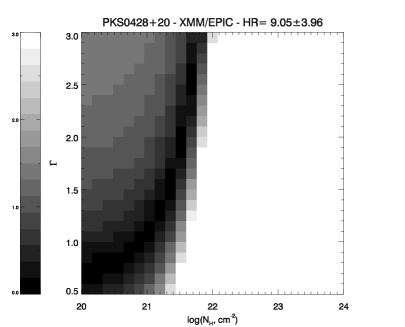
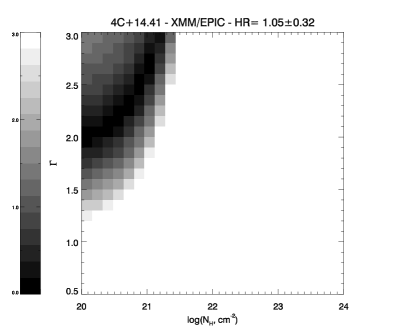
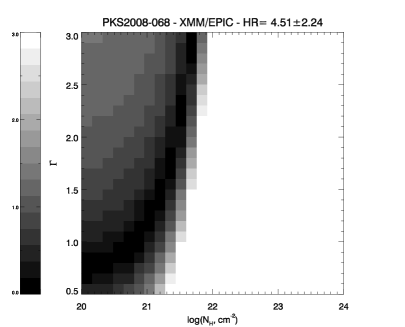
The confidence interval in column density was estimated as the minimum and maximum value of the 1.6 interval around the curve corresponding to the nominal HR, when was constrained in the range: [0.63,2.62]. The photon-index range corresponds to the interval of the distribution, calculated on the whole sample of GPS galaxy for which the data quality allowed us to perform a spectral analysis (cf. Fig. 6). The resulting constraints on the column density are shown in Table 4.
| Source | a | ||
|---|---|---|---|
| (1021 cm-2) | |||
| PKS0428+20 | 6.9 | [0.3, 0.6] | 43.1 |
| 4C+14.41 | 1.6 | [0.2, 0.5] | 43.1 |
| PKS2008068 | 4.8 | [0.2, 0.5] | 43.8 |
aranges in units of 10-13 erg s-1 cm-2 corresponding to the range as in this table, and to the photon index in the range: [0.63,2.62] (more details in the text).
4.1 A Compton-thick AGN in PKS1607+26?
The fit of the EPIC spectra of PKS1607+26 yields an unusually flat spectral index: . A flat spectrum may be indicative of a blazar-type spectral component. Alternatively, in radio-quiet AGN spectral indices are generally interpreted as evidence for a Compton-thick AGN, whose primary X-ray emission is totally suppressed by optically thick matter with a column density cm-2 (see Comastri 2004 for a review). In Compton-thick AGN, residual X-ray emission red-wards the photoelectric cutoff could be due to Compton-reflection of the otherwise invisible primary radiation off the obscuring matter444the GPS galaxy OQ+208 was the first radio-loud Compton-thick AGN discovered (Guainazzi et al. (2004)). Fe Kα fluorescent emission with large EW ( eV; Risaliti 2002, Guainazzi et al. 2005) is the unmistakable sign of a Compton-thick AGN. We have therefore applied the baseline spectral model for Compton-thick AGN to the PKS1627+06 pn spectrum (the MOS spectra have very poor statistics, and do not provide any further constraints): a pure Compton-reflection continuum (model pexrav in Xspec; Magdziarz & Zdziarski 1995) plus a Gaussian unresolved emission line. In order to take advantage of the full energy resolution of the EPIC cameras we fit the unbinned spectrum using the Cash statistic, (Cash (1976)). Although the Cash statistic does not provide an absolute level of statistical confidence on the quality of the fit, the resulting value (=25.2/21 degrees of freedom) and the smoothness of the residuals (Fig. 3) indicate that the fit is good. Once this continuum is adopted, an emission line is

required at a confidence level larger than 90% for two interesting parameters (or 95% for one parameter; Fig. 4).
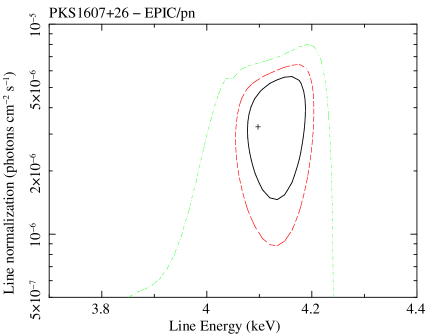
The EW ( eV) is consistent with values typically observed in Compton-thick AGN. However, the best-fit centroid energy of this feature ( keV) is slightly inconsistent with Fe Kα fluorescence if converted into the rest frame with the quoted redshift for this object: keV. No other known atomic transition could be responsible for a feature at this energy. We do not have a convincing explanation for this finding. The redshift quoted in the literature for PKS1607+26 dates back to Philips & Shaffer (1983). Biretta et al. (1985) refer to previous mis-identification of this object, and indeed the value of =0.47 in the original paper corresponds to the wrong identifier in Biretta et al. (1985). If the emission line is indeed the Fe Kα, the redshift is 0.55. Notwithstanding the ultimate redshift value, the very flat hard X-ray spectral index, alongside the detection of a strong emission-line features point to a Compton-thick nature for this object. In order to determine a lower-limit to the column density covering the primary continuum, we have added to the pure reflection model a power law obscured by photoelectric absorption. We have used a combination of the models phabs and cabs in Xspec to take into account the contribution of Compton scattering, which is no longer negligible for column densities close to the Compton-thick limit. The obscuring column density is constrained to be higher than cm-2 (90% confidence level for one interesting parameter; Fig. 5).
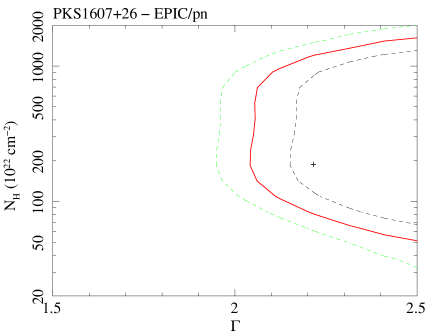
This is the value we will associate with PKS1607+26 in all subsequents plots and distribution functions. However, given the pending uncertainties on the ultimate identification of this source, we will not use this measurement to derive statistical estimators in the distribution of the whole sample.
5 Comparison with control samples of “normal” radio galaxies
In this Section we present X-ray spectral properties of the flux density and redshift-selected complete sub-sample extracted from the Stanghellini et al. (1998) GPS sample described in Sect. 2. Readers are referred to the Guainazzi et al. (2006) and Vink et al. (2005) for the spectral analysis of the sources not discussed in this paper. We have repeated the analysis of the sources of the Vink et al. (2005) with the same reduction and data screening criteria as in Guainazzi et al. (2006) and in this paper. The results of our re-analysis are consistent with theirs. 5 GHz luminosities are taken from Stanghellini et al. (1998) and O’Dea (1998).
Our goal is also to compare the properties of the complete radio-selected flux-limited GPS sample with a control sample of “normal” radio galaxies. The control sample has been built from results recently published in the literature. It is based on observations of radio galaxies taken by ASCA (Sambruna et al. (1999)), BeppoSAX (Grandi et al. (2006)), XMM-Newton and Chandra (FR I: Donato et al. (2004); Evans et al. (2006); Balmaverde et al. (2006); FR II Belsole et al. (2006); Evans et al. (2006); Hardcastle et al. (2006)). Only one measurement per source has been retained in the control sample, based on the latest published result. However, we have considered the latest Chandra measurement, even when a later XMM-Newton observation was available, under the assumption that the superior spatial resolution of the Chandra optics provides a more reliable measurement of the core emission. The control sample comprises 93 sources (32 FR I, 54 FR II, the remaining ones have no FR classification). We stress that the control sample is neither complete nor unbiased. Moreover, it is not well matched with our GPS sample in redshift. The probability that the redshift distribution of the GPS sample is the same as in the entire control sample is 2% only. This difference is mainly due to FR Is being generally at lower redshift than our GPS sample, whereas our GPS and the control FR II samples are well matched in redshift (cf. Fig. 8). Whenever pertinent, we will explicitly show in the following the redshift dependence of the observables, and discuss any possible bias associated with comparing samples inhomogeneous in redshift coverage.
5.1 X-ray detection fraction
We obtain a very large detection fraction; all the sources of our sample yield a detection in the soft X-ray band (0.5–2 keV), whereas 15 out of 16 are detected in the full band (0.5–10 keV). All of them but one (PKS1345+125) were unknown in X-rays prior to our Chandra (see also Siemiginowska et al. 2008) and XMM-Newton observations.
5.2 Spectral shape
In Fig. 6 we show the distribution of spectral indices for

the 8 GPS of our sample5554C+32.44, 4C+62.22, B03710+439, COINSJ2355+4950, PKS0500+019, PKS1345+125, PKS2127+04, OQ+208, where the number of counts is good enough for the spectral analysis to be possible. The distribution has a mean value , and a standard deviation . The weighted mean is if the measurements are weighted according to the inverse square of their statistical uncertainties.
5.3 Obscuration
In Fig. 7 the distribution of column density for the GPS sources of our sample is shown. The mean value of the distribution is cm-2 with a standard deviation 0.5 dex. The same Figure shows the comparison with the control sample.
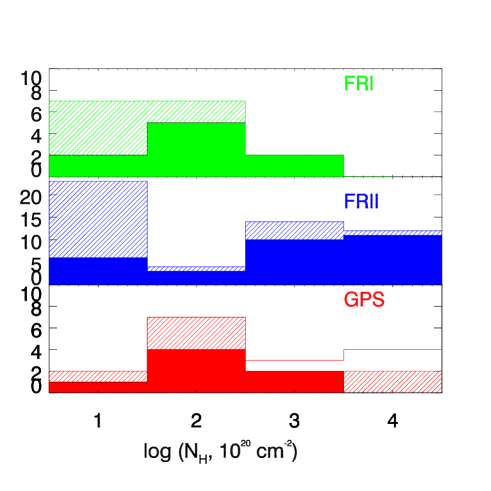
The core emission of FR I radio galaxies is generally unobscured or only mildly obscured. In the Donato et al. (2004) FR I sample, less than one-third of the sample exhibits excess obscuration above the Galactic contribution, with rest-frame column densities in the range cm-2, thus significantly lower than observed in our sample. The average of the column density distribution in the FR I control sample is cm-2.
FR II cores tend instead to include a heavily obscured component. However, a detailed quantitative comparison between the GPS and the FR II control sample is difficult. For 11 out of 54 FR II sources neither a measurement nor an upper limit on the column density is available in the literature. These sources are generally considered as unobscured (Hardcastle et al. (2006)). Lack of inclusion of these sources could potentially bias the control sample distribution towards higher values. Bearing this caveat in mind, GPS galaxies seems to fill a gap in the distribution between highly obscured ( cm-2) and unobscured ( cm-2) FR II spectral components.
A potential area of concern is the comparison of column density measurements in samples, which are not well matched in redshift.

However, Fig. 8 shows that this bias is not responsible for the difference between the average of the column density distribution in the GPS and FR II samples. Moreover, low-redshift GPS galaxies exhibit column densities not systematically lower than high-redshift ones.
Hardcastle et al. (2006) remark that heavily absorbed nuclei are rather common in narrow-line radio galaxies, whereas they are comparatively rare in Low-Excitation Radio Galaxies (LERG; Laing et al. (1994)). There are 7 LERGs in our control sample; 5 of them have no column density measurement; the remaining two have column density of cm-2 (3C 123; Hardcastle et al. (2006)) and cm-2 (3C 427.1; Belsole et al. (2006)). Taking into account the low number statistics and the uncertainties on the column density upper limits on formally “unobscured” LERGs, the comparison between X-ray obscuration in LERGs and GPSs is inconclusive.
The X-ray column density is significantly larger than the column density measured by HI observations by a factor 10 to 100. The comparison is shown in Fig. 9.

The estimate of the HI column density depends on the values assumed for the spin temperature, , and for the fraction of background source covered by the absorber, . The data in Fig. 9 assume =100 K and =1 (Vermeulen et al. (2003); Pihlström et al. (2003); Gupta et al. (2006)). The X-ray versus HI column density relation can be fit with a zero-offset linear function if is of the order of a few thousands K (Ostorero et al. (2009)). Alternatively, a low covering fraction could be responsible for the large X-ray to HI column density ratio, although this explanation is less likely given the large column densities measured in X-rays.
Holt et al. (2003) proposed an “onion-skin” model for the nuclear environment gas in B1345+125, to explain the reddening properties of the different components of the optical lines. The jet would pierce its way through a dense cocoon of gas and dust, with decreasing density at larger distances from the radio core. If this scenario would apply to the whole class of GPS samples, and X-ray and radio emission originate in the same physical system, one might expect an anti-correlation between the measured column density and the size of the radio structure, with a large scatter due to the unknown line-of-sight angles distribution. This correlation is shown in Fig. 10.

A censored fit on this data with a function: yields: , and , where is the size of the radio structure in units of kpc. This result is formally robust, but admittedly mainly driven by the two extreme data points. A confirmation of this correlation by increasing the number of small (100 pc) and large ( kpc) objects for which spectroscopic X-ray data are available is a task we are actively pursuing. Interestingly enough, an anti-correlation between the linear dimension of the sub-galactic radio galaxy and the radio HI column density was discovered by Pihilstöm et al. (2003). As already pointed out by Gupta et al. (2006), this anti-correlation could be driven by small sources probing gas closer to the AGN and hence at a higher spin temperatures. In this context, it is also interesting to observe that GPS quasars exhibit no absorption (with upper limits cm-2; Siemiginowska et al. (2008)), as well as diffuse emission associated with jets, binary structures or embedding clusters. The detection rate as well as the column density of HI absorption increases with core prominence (Gupta & Saikia (2006)). The core prominence is a statistical indicator of the orientation of the jet axis to the line of sight. On average HI absorbers are more common and exhibit higher column densities in galaxies than in quasars. This can be explained if the HI absorbing gas is distributed in a circumnuclear disk much smaller than the size of the radio emitting region, and only a small fraction of it is obscured in objects at large inclinations.
5.4 Radio-to-X-ray correlations
In the left panel of Fig. 11 we compare the logarithmic ratio between the
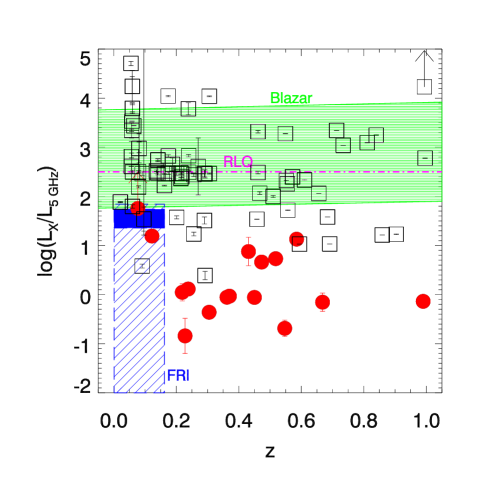

2–10 keV and the core 5 GHz luminosity (, where is the luminosity density at 5 GHz) for the GPS and the control sample. Values for the GPS sample range between -0.5 and 1.5. No clear dependence on redshift is observed. GPS galaxies are X-ray under-luminous by about an order of magnitude with respect to their radio power once compared to FR II radio galaxies, blazars (Fossati et al. (1998)) and radio-loud quasars (Elvis et al. 1994b ). On the other hand, the X-ray-to-radio luminosity ratios in GPS galaxies well match values observed in FR I galaxies: . It is important to stress again that there is almost no overlap in redshift between the GPS and the FR I samples, though.
The interpretation of the X-ray-to-radio luminosity correlation depends on the origin of the bulk of the VLA radio emission in compact galaxies. VLBI observations of GPS galaxies revealed a fraction of Compact Symmetric Objects (CSO) between 30% and 100% (Stanghellini et al. 1997, 1999; Xiang et al. (2005); Liu et al. (2007)). Three objects in our sample show a CSO morphology: PKS 0050+019, PKS 1345+125, and PKS 2008068 (Stanghellini et al. 1997, 1999), although in all these cases the morphology is rather complex, with multiple components on scales 20 pc. High-resolution, multi-frequency observations of our sample would be required to estimate which fraction of the VLA flux can be safely attributed to a core.
From Fig. 11 a possible bimodality of the X-ray-to-radio luminosity ratio in the GPS sample is apparent. The fit of the cumulative distribution function of this quantity with a single Gaussian yields a Kolmogornov/Smirnov value of 0.33, corresponding to null hypothesis probability of about 4%. A fit with a double Gaussian yields instead a value of 0.18, with a null hypothesis probability of 65%. We consider this as a tentative piece of evidence for bimodality only. We will refer in the following to “X-ray bright” and to “X-ray weak” GPS galaxies as those, whose ratio is larger/smaller than 0.5, respectively. No significant difference in the spectral shape between the the “X-ray bright” and “X-ray weak” sources was observed. In particular, the obscuring column density distributions are indistinguishable.
In the right panel of Fig. 11 the 2-10 keV luminosity is plotted against the 5 GHz luminosity. In FR I galaxies a strong correlation between core X-ray, radio and optical flux is known (Chiaberge et al. (1999); Hardcastle & Worrall (2000)). In our control sample, the slope of this correlation is consistent with unity: . Interestingly enough, this slope is consistent with the slope observed in “X-ray weak” GPS galaxies ,with a 0.5 dex offset at face-value. The “X-ray bright” sample exhibits a significantly flatter slope, although with large uncertainties (). Again, it is hard to estimate any bias associated with the coarse spatial resolution of the GPS radio measurements.
6 Discussion
In this Section we will review the main X-ray observational properties of our whole GPS sample, trying to address the three issues which originally motivated our study:
-
•
What is the physical origin of the X-ray emission in GPS galaxies?
-
•
Which physical system is associated with the X-ray obscuration?
-
•
What is the “endpoint” of the evolution of compact radio sources?
6.1 X-ray spectral support for an accretion-disk origin
The distribution of spectral indices in the GPS sample by itself does not provide any stringent constraints on the origin of X-ray emission in GPS galaxies. The mean value, (), is consistent with spectral components associated with the jet in radio galaxies (), as well as with accretion (; Evans et al. 2006), although is nominally closer to the latter. A possible clue may come from the fact that the column density measured in X-rays is invariably larger by 1-2 orders of magnitudes than that measured in radio. This finding could be naturally explained by X-rays being produced in a smaller region than the radio. On average, the radio morphology of compact radio sources strikingly resembles that of large-scale radio doubles, although on a scale which is entirely confined within the optical narrow-line emission regions. Radio emission traces therefore the radio hotspot and lobes. X-rays could be instead generated by the base of the jet, or by the accretion disk.
Support for the X-rays arising from a relatively compact region comes from the comparison with radio-quiet AGN. Once a similar baseline model is employed, Seyfert galaxies have: (Bianchi et al., submitted)666This is not the intrinsic spectral index, which can be significantly larger due to the hardening effect of ionised absorbers of disk/torus reflection.. GPS galaxy X-ray spectra lack the complexity that Seyferts typically exhibit. There is no strong evidence for a soft excess (with the only exception of OQ+208; Guainazzi et al. 2004), warm absorber, warm scattering or Fe Kα fluorescent emission (with, again, the notable exceptions of OQ+208 and, possibly PKS1607+26) in our sample. However, most of the GPS galaxy spectra collected so far with either XMM-Newton or Chandra do not possess the statistical quality that would be needed for these additional spectral features to be unambiguously detected.
The scatter in the X-ray to radio luminosity ratio, and its lack of dependence on source size and age (cf. also Fig. 13) may indicate a link between accretion disk and jet activity primarily driven by disk instabilities. 10-20% of GPS objects exhibit very extended radio (Baum et al. (1990); Stanghellini et al. (1990); Schoenmakers et al. (1999); Marecki et al. (2003)) or X-ray (Siemiginowska et al. (2002), 2003) emission. These components have been interpreted as remnants of past enhanced activity. A similar behaviour on much shorter time scales is observed in Galactic Black Hole Candidates and micro-quasars, such as GRS 1915+105 (Belloni et al. (2000); Fender et al. (2004)). Jet blobs are supposed to be fed by the evacuation of the innermost accretion disk regions. This mechanism yields alternating X-rays- (disk-dominated) and radio-bright (jet blob-dominated) phases. Models based on disk radiation pressure instabilities reproduce well the timescales of these transitions (Czerny et al., in preparation), although they do not make yet specific predictions on the evolution of the spectral energy distribution.
6.2 Dilution by X-rays from radio-emitting regions?
Most likely, the baseline model is indeed too simple. X-ray absorption could be “diluted” by X-rays coming from the high surface-brightness radio components, thus complicating the interpretation of the results derived by our simple baseline model. This scenario would also explain the (still tentative) anti-correlation between the X-ray column density and the size of the radio source (Fig. 10). In larger sources, a larger fraction of the X-ray emission associated with the radio hot-spots or lobes may be visible beyond the rim of the obscuring matter. Should this indeed be the case, we should, however, observe deviations from a simple power-law spectral shape. We indeed observe a soft excess in the radio-loud Compton-thick GPS galaxy OQ+208. This is the closest object in our sample, and the only one where high-resolution spatially-resolved spectroscopy with Chandra could provide direct observational clues on the physical location of the X-ray emitting plasma.
6.3 The X-ray obscuring environment
Lacking other direct evidence from X-rays alone, one may use multiwavelength diagnostics to obtain further clues on the origin of the X-ray emission in GPS galaxies. A well established diagnostic tool for X-ray obscuration in radio-quiet AGN involves the comparison between the column density measured in X-rays and the absorption-corrected ratio of X-ray to O[iii] fluxes (Maiolino et al. (1998)). In the context of Seyfert galaxies, this diagram is used to calibrate the latter quantity as an estimator for obscuration. We use here the same plot with a different purpose, namely to test whether the ionising continuum powering the Narrow Line Regions in GPS galaxies has the same properties as in Seyfert galaxies once normalised to the X-ray primary emission. If this is the case, one may conclude that the “normalising primary continua” share the same properties in the two populations. The results of this comparison are shown in Fig. 12. 5 objects in our GPS sample

have spectroscopic O[iii] measurements (O’Dea 1998, Labiano et al. 2005, 2008 and references therein). The “control sample” is a collection of Seyfert 2-galaxy measurements in Guainazzi et al. (2005). The agreement is good. Although more GPS data would be required to ensure a homogeneous coverage of this plane, this evidence further points towards an accretion origin for the X-ray emission in GPS galaxies.
Interestingly, the fraction of Compton-thick AGN in the GPS sample (, if PKS1607+26 is considered) is comparable to fractions observed in radio-quiet AGN (Heckman et al. (2005)). Conversely, only one Compton-thick AGN has been detected in large-scale radio galaxies (Erlund et al. (2008)), although FR II typically exhibit spectral components with very large obscuration (Belsole et al. (2006); Evans et al. (2006)).
6.4 X-ray emission entirely associated with radio-emitting regions?
We now investigate the implications of the difference between X-ray and radio HI column densities, possibly due to the ionisation state of a single gas system simultaneously covering the radio and the X-ray emission. Attributing this difference solely to ionisation effects would mean ionisation fractions of 90% to 99% (see the discussion in Vink et al. 2005). Photoionisation simulations with Cloudy (Ferland et al. (1998)) show that this corresponds to an ionisation parameter for a gaseous nebula photoionised by a typical AGN continuum. An anti-correlation between the HI column density and the linear projected size of the radio source is now well established (Vermeulen et al. (2003); Pihlström et al. (2003); Gupta & Saikia (2006)). Smaller sources ( kpc) tend to have higher Hi column density than larger sources ( kpc). If not driven by uncertainties in the spin temperature of the HI absorbing gas, this anticorrelation can be explained by GPS galaxies hosting young radio sources, which evolve in a disk distribution of gas with a power-law radial density dependence. The same explanation could lie behind the (tentative) anti-correlation between X-ray column density and radio size in GPS galaxies (Fig. 10). One can assume a scenario where the radio and X-ray source are seen through the same line-of-sight and are both embedded in a screen of ionised gas, responsible for X-ray photoelectric absorption as well as for radio free-free absorption. From the definition of the ionisation parameter, it follows for the X-ray regime:
where is the plasma density in units of cm-3, is the distance between the ionising source and the innermost side of the absorbing material in kpc, and is the ionising luminosity in units of erg s-1. It is plausible that densities in GPS sources are high enough that free-free absorption may play a role (O’Dea et al. (1991); Stawarz et al. (2008)). The emission measure for free-free absorption at 5 GHz is (see, e.g., Osterbrock 1977):
where is the path length in parsecs and is the temperature in units of K. Assuming , one can constrain the plasma temperature:
where is the conversion factor between the absorption-corrected 2–10 keV and the bolometric luminosity divided by 30. For standard values of (Elvis et al. 1994b ), almost all GPS sources in our sample require temperatures above that at the dust sublimation radius in this scenario. This outcome could be tested by measurements of the optical reddening in our sample.
If the compact jet “drills” its way through such a medium, would it be significantly decelerated or even “frustrated”, i.e. permanently confined? This issue was discussed by Guainazzi et al. (2004) for the case of the Compton-thick absorber in OQ+208. They concluded that for large inclination angles or large thickness of the Compton-thick layer, the jet could have been significantly decelerated by the interaction with the ambient medium. Although permanent confinement is unlikely in OQ+208, underestimating the evolution time scale by one-two orders of magnitude is possible. We revise their argument for the whole sample of GPS galaxies. The expansion time for a jet propagating in pressure equilibrium through in homogeneous medium can be expressed as (Scheuer (1974); Carvalho (1985, 1998)):
where is the (unknown) luminosity injected in the jet in units of erg s-1, and is the jet opening angle in units of 10 degrees. If we assume the censored best-fit for the linear size versus X-ray column density relation:
where we have compacted all the geometrical factors in the variable . There are admittedly several uncertainties in deriving the above scaling law. Most importantly, we know very little of the actual gas distribution in the environment surrounding compact radio sources (as well as in any other type of AGN). Still, the above estimate indicates that a GPS may expand during a time of the order of at least years. This is longer than currently existing observational estimates (Poladitis & Conway 2003; Gugliucci et al. 2005), but not enough to make the hypothesis of permanent confinement viable.
6.5 Evolution of GPS sources
If the jet can indeed survive its eventful youth, and grow to reach a full level of kpc-scale maturity and beyond, what would it look like? The radio-to-X-ray luminosity plane does not ultimately elucidate the possible connection between GPS and “mature” radio galaxies. GPS galaxies are intriguingly well aligned along the extrapolation at high radio power of the correlation between radio core and X-ray luminosity valid for FR I radio galaxies (Evans et al. (2006)). This correlation was proposed as evidence supporting a jet origin of unabsorbed X-ray spectral components in FR I radio galaxies. On the other hand, GPS galaxies have a comparable X-ray luminosity to FR IIs (cf. Fig. 11). In FR IIs, the obscured X-ray spectral component is probably associated with accretion onto the supermassive black hole obscured by a “torus”, in analogy to the accepted paradigm applicable to radio-quiet AGN (Piconcelli et al. (2008)). If the X-ray emission in GPS galaxies is due to accretion, the evolution of the radio and X-ray wavebands could be totally decoupled. Radio power would decline with the linear size (see, e.g., Fanti et al. 1995) while the sources expand through the ISM; at the same time the accretion disk would maintain a stable flow. At the end of their infancy, GPS galaxies would reach maturity as FR II radio galaxies.
Evolutionary scenarios require that the radio luminosity of GPS sources decreases with evolution, not to exceed the number of observed FR II galaxies (Readhead et al. (1996)). Recently, Stawarz et al. (2008) have proposed an evolutionary model for GPS sources, which explicitly predicts the dependency of the broadband Spectral Energy Distribution on the source linear size. In their model high-energy emission is produced by upscattering of various photon fields by the lobes’ electrons. They predict a decrease of the X-ray to radio luminosity ratio by 1–2 orders of magnitude when the GPS source size increases from 30 pc to 1 kpc. In Fig. 13

we compare this prediction with our observations. There is no evidence for a strong anti-correlation between the two quantities; the slope of the best linear fit is (1- statistical error). Still, the observational data are consistent with the Stawarz et al. model predictions, if the GPS galaxies in our sample cover a wide range in jet kinetic power.
It is still impossible with the available data to decide between an evolutionary scenario in which the source evolves into a conventional FR II or FR I radio galaxy. To achieve this goal, photometric X-ray observations of sizable samples of low-luminosity ( erg s-1) GPS galaxies would be crucial. Fortunately, it is now in principle possible to perform this experiment, thanks to the point-like source sensitivity and scheduling flexibility of Chandra.
7 Summary and conclusions
This paper reports our current knowledge on X-ray emission in GPS galaxies. For the first time a complete radio-selected sample of GPS galaxies has been almost entirely observed with a modern X-ray observatory (mostly with XMM-Newton). The sample is comprised all the sources of the Stanghellini et al. (1998) sample having a 5 GHz flux density 1 Jy. The main results of our study can be summarised as follows:
-
•
we obtain a very large detection fraction; all the sources of our sample yield a detection in the soft X-ray band (0.5–2 keV), whereas 15 out of 16 are detected in the full band (0.5–10 keV)
-
•
in almost all cases, a simple power law modified by photoelectric absorption represents an adequate description of the 0.5–10 keV spectrum. In a few objects the number of net counts is not good enough to allow a full spectral analysis. In this case basic spectral parameters were derived from hardness ratios assuming the baseline model above
-
•
the mean of the spectral indices distribution is (). Although the uncertainty on this parameter is still too large to pinpoint the physical mechanism responsible for the observed X-ray emission, at face value the distribution is closer to those AGN classes whose X-ray emission is believed to be dominated by accretion: Seyfert Galaxies and the obscured spectral component in FR II radio galaxies
-
•
we report the possible discovery of a Compton-thick AGN in PKS1607+26. Radio-loud Compton-thick AGN are still an elusive population (Comastri (2004)). Together with OQ+208 - the other Compton-thick AGN in the sample - PKS1607+26 is the only GPS galaxy where an X-ray emission line has been detected, possibly associated with Fe Kα fluorescence
-
•
X-ray spectra of GPS galaxies are significantly obscured. The mean value of the column density distribution (without PKS1607+26, due to pending uncertainties on the identification of this source) is cm-2 with a standard deviation 0.5 dex. Such a value is much larger than column densities measured in a control sample of FR I radio galaxies, but still less than column densities covering accretion-related X-ray spectral components in FR II radio galaxies (Balmaverde et al. (2006); Belsole et al. (2006); Evans et al. (2006)).
-
•
the X-ray column density measured in almost all GPS galaxies is larger than the HI column density measured in the radio by a factor of 10 to 100. This could be the signature of physically different absorption systems (Vink et al. (2005); Guainazzi et al. (2006)) or of a single system characterised by a spin temperature 103 K (Ostorero et al. (2009)). We report a possible anti-correlation between the projected linear size of the radio source and the X-ray column density, analogous to the anti-correlation between radio size and HI column density reported by Pihlström et al. (2003) and Gupta et al. (2006)
-
•
GPS galaxies occupy a specific locus in the radio versus X-ray luminosity plane. They lie well on the extrapolation to high radio powers of the correlation between these two quantities discovered in low-luminosity FR I radio galaxies. On the other hand, GPS galaxies exhibit a comparable X-ray luminosity to FR II radio galaxies, notwithstanding their much greater radio luminosity
-
•
GPS galaxies occupy the same locus as Seyfert galaxies in the O[III] to X-ray luminosity ratio versus X-ray column density diagnostic plane
If the bulk of the X-ray emission in GPS galaxies is due to the accretion disk, one may expect that the X-ray and the radio source evolution in GPS galaxies would be decoupled. The accretion disk would maintain a stable flow of gas and (mostly sublimated) dust to the supermassive black hole, while the radio source fades away with its expansion into the ISM. This would imply an increase of the X-ray to radio luminosity ratio with size. On the other hand, models of the dynamical evolution of GPS sources, where the X-ray emission is primarily produced by Compton upscattering of ambient photons (Stawarz et al. (2008)), predict a decrease of the X-ray to radio luminosity ratio with size. The ratios observed in our sample are consistent with both possibilities. Measurements in -rays by Fermi (as originally proposed by Stawarz et al. (2008)) could be crucial to discriminate between them. Alternatively, the large scatter observed in this quantity may be indicative of a coupling between the accretion disk and the jet activity driven by disk instabilities.
The evolutionary scenarios described above postulate that GPS sources are young objects, as also indicated by the direct measurement of their dynamical age. Eventually GPS galaxies would reach their full maturity as classical FR II radio galaxies. However, column densities 1022 cm-2 fully surrounding the expanding radio source could significantly brake, if not entirely inhibit, this state, leading to a significant underestimate of dynamical ages based on hotspot recession velocity measurements. Extending the number of X-ray measurements of low-luminosity ( erg s-1) GPS galaxies is the next step we intend to pursue, in order to pinpoint the endpoint of their evolution.
Appendix A: a serendipitous blazar in the field of 4C+00.02
A bright off-axis source is visible in the EPIC field of view of the XMM-Newton 4C+00.02 observation. This source will be referred to in the following as XMMU J002200.8+000655. It is outside the field of view of the XMM-Newton Optical Monitor. The best-fit parameters when the baseline model is applied to its spectrum are summarised in Table 5.
| a | |||
| ( cm-2) | (10-4 cm-2 s-1) | ||
| 1.00/350 |
ain excess of the Galactic contribution along the line-of-sight to XMMU J002200.8+000655.
The EW of a unresolved Fe Kα neutral fluorescent line is constrained to be lower than 400 eV.
This source was already known as 1RXS J002200.9+000659 (Voges et al. (1999)). We have searched with Aladin for available measurements at other wavelengths. We found data in GALEX GR4, SDSS (Adelman-McCarthy et al. (2008)), 2MASS, and FIRST (White et al. (1997)) results. In Fig. 14 we compare the Spectral Energy Distribution (SED), with the average SED for radio-quiet and radio-loud quasars normalised at 1 keV (Elvis et al. 1994b ) and with the “blazar track” corresponding to objects with the same radio luminosity as XMMU J002200.8+000655 (Fossati et al. (1998)). As can be seen in Fig.14 the blazar SED track qualitatively agrees with the XMMU J002200.8+000655 SED.
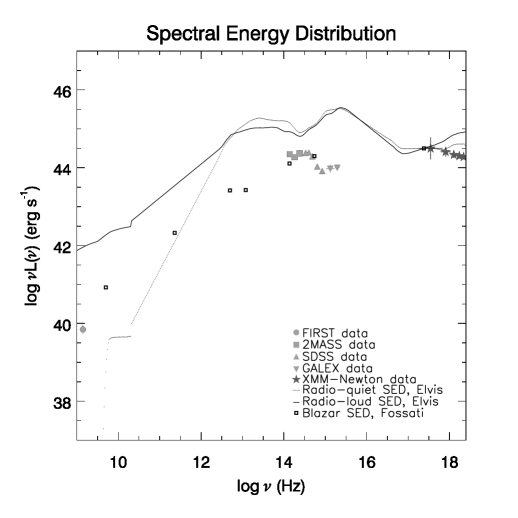
This source appears in NED as a BL Lac candidate, and in Véron-Cetty & Veron (2006) as a confirmed BL Lac object. Its optical spectrum was previously studied by Collinge et al. (2005), but heavy contamination by the host galaxy prevented its properties from being properly studied.
Appendix B: summary of the radio and X-ray properties of the whole GPS sample
In Table 6 we report a summary of the X-ray properties of the whole GPS sample discussed in this paper, together with the 5 GHz luminosity after O’Dea (1998) and Stanghellini et al. (1998).
| Source name | Size | HI ) | ||||
|---|---|---|---|---|---|---|
| ( erg s-1) | ( cm-2) | (kpc) | ||||
| 4C+00.02 | 43.1 | † | 0.220 | … | … | |
| COINSJ0111+3906 | 44.0 | 0.033 | 21.9 | … | ||
| PKS0428+20 | 43.1 | 0.653 | 20.5 | … | ||
| PKS0500+019 | 43.6 | 0.055 | 20.8 | |||
| B30710+439 | 43.8 | 0.118 | … | |||
| PKS0941080 | 42.8 | 0.148 | 20.1 | … | ||
| B1031+567 | 43.4 | 0.206 | 20.1 | … | ||
| 4C+14.41 | 43.2 | 0.306 | 19.8 | … | ||
| 4C+32.44 | 43.6 | 0.247 | 19.9 | |||
| PKS1345+125 | 42.7 | 0.166 | 20.6 | |||
| 4C+62.22 | 43.6 | 0.218 | 20.3 | |||
| OQ+208 | 42.2 | 0.010 | 20.3 | |||
| PKS1607+26 | 43.8 | 0.262 | … | … | ||
| PKS2008-068 | 44.5 | 0.218 | … | … | ||
| PKS2127+04 | 44.6 | 0.218 | … | |||
| COINSJ2355+4950 | 43.0 | 0.199 | 20.5 |
†extrapolated from the detection in the 0.5–2 keV band with and
Acknowledgements.
Based on observations obtained with XMM-Newton, an ESA science mission with instruments and contributions directly funded by ESA Member States and NASA This research has made use of data obtained through the High Energy Astrophysics Science Archive Research Centre Online Service, provided by the NASA/Goddard Space Flight Centre and of the NASA/IPAC Extragalactic Database (NED) which is operated by the Jet Propulsion Laboratory, California Institute of Technology, under contract with the National Aeronautics and Space Administration. OT thanks the whole ESA administration, and in particular Nienke de Boer, Marcus Kirsch and Fernando Maura, for their support during a six-month traineeship at ESAC, where most of the data analysis included in this paper was performed. This research is funded in part by NASA grant NNX07AQ55G. OT gratefully acknowledge an ESA Internal Fellowship Trainee grant. AS is partly supported by NASA contract NAS8-39073. The authors thank C.Stanghellini for a critical revision of an early version of this manuscript. Last, but not least, the authors gratefully acknowledge a careful and accurate referee report by Dr.D. J. Saikia, which greatly improved the overall presentation of the paper, while allowing us to better clarify some aspects of the radio measurements discussed in this paper.References
- Adelman-McCarthy et al. (2008) Adelman-McCarthy J. K., Agüeros M. A, Allam, S. S., et al., 2008, ApJS, 175, 297
- Arnaud (1996) Arnaud, K.A., 1996, Astronomical Data Analysis Software and Systems V, eds. Jacoby G. and Barnes J., 17, ASP Conf. Series volume 101.
- Balmaverde et al. (2006) Balmaverde B., Capetti A., Grandi P., 2006, A&A, 451, 35
- Baum et al. (1990) Baum S.A., O’Dea C.P., de Bruyn A.G., Murphy D.W., 1990, A&A, 232, 19
- Belloni et al. (2000) Belloni T., Migliari S., Fender R.P., 2000, 358, L29
- Belsole et al. (2006) Belsole E., Worrall D.M., Hardcastle M.J., 2006, MNRAS, 366, 339
- Biretta et al. (1985) Biretta J.A., Schneider D.P., Gunn J.E., 1985, AJ, 90, 2508
- Carvalho (1985) Carvalho J.C., 1985, A&A, 150, 129
- Carvalho (1998) Carvalho J.C., 1998, A&A, 329, 845
- Cash (1976) Cash W., 1976, A&A, 52, 307
- Chiaberge et al. (1999) Chiaberge M., Capetti A., Celotti A., 1999, A&A, 349, 77
- Collinge et al. (2005) Collinge M.-J., Strauss M.-A., Hall P.-B., et al., 2005, AJ, 129, 2542
- Comastri (2004) Comastri A., 2004, ASSL, 308, 245
- Donato et al. (2004) Donato D., Sambruna R.M., Gliozzi M., 2004, ApJ, 617, 915
- (15) Elvis M., Fiore F., Wilkes B., McDowell J., Bechtold J., 1994a, ApJ, 422, 60
- (16) Elvis M., Wilkes B.J., McDowell J.C., et al., 1994b, ApJS, 95, 1
- Erlund et al. (2008) Erlund M.C., Fabian A.C., Blundell K.M., Crawford C.S., 2008, MNRAS, 385, L125
- Evans et al. (2006) Evans D.A., Worrall D.M., Hardcastle M.J., Kraft R.P., Birkinshaw M., 2006, ApJ, 642, 96
- Fanti et al. (1995) Fanti C., Fanti R., Dallacasa D., Schilizzi R.T., Spencer R.E., Stanghellini C., 1995, A&A, 302, 317
- Fender et al. (2004) Fender R.P., Belloni T.M., Gallo E., 2004, MNRAS, 355, 1105
- Ferland et al. (1998) Ferland G. J., Korista K.T., Verner D.A., Ferguson J.W., Kingdon J.B., Verner E.M., 1998, PASP, 110, 761
- Fossati et al. (1998) Fossati G., Maraschi L., Celotti A., Comastri A., Ghisellini G., 1998, MNRAS 299, 433
- Gabriel et al. (2003) Gabriel C., Denby M., Fyfe D. J., Hoar J., Ibarra A., 2003, in ASP Conf. Ser., Vol. 314 Astronomical Data Analysis Software and Systems XIII, eds. F. Ochsenbein, M. Allen, & D. Egret (San Francisco: ASP), 759
- Gopal-Krishna & Wiita (1991) Gopal-Krishna, Wiita P.J., 1991, ApJ, 373, 325
- Grandi et al. (2006) Grandi P., Malaguti G., Fiocchi M., 2006, ApJ 642, 113
- Guainazzi (2008) Guainazzi M., 2008, “Status of EPIC Calibrations”, (XMM-Newton SOC:ESAC), available at: http://xmm2.esac.esa.int/docs/documents/CAL-TN-0018.pdf
- Guainazzi et al. (2005) Guainazzi M., Matt G., Perola G.C., 2005, A&A, 444, 119
- Guainazzi et al. (2004) Guainazzi M., Siemiginowska A., Rodriguez-Pascual P., Stanghellini C., 2004, A&A, 421, 461
- Guainazzi et al. (2006) Guainazzi M., Siemiginowska A., Stanghellini C., et al., 2006, A&A, 446, 87
- Gugliucci et al. (2005) Gugliucci N.E., Taylor G.B., Peck A.B., Giroletti M., 2005, ApJ, 622, 136
- Gupta & Saikia (2006) Gupta N., Saikia D.J., 2006, MNRAS, 370, 738
- Gupta et al. (2006) Gupta N., Salter C.J., Saikia D.J., Ghosh T., Jeyakumar S., 2006, MNRAS, 373, 972
- Hardcastle et al. (2006) Hardcastle M.J., Evans D.A., Croston J.H., 2006, MNRAS, 370, 1893
- Hardcastle & Worrall (2000) Hardcastle M.J., Worrall D.A., 2000, MNRAS, 314, 969
- Heckman et al. (2005) Heckman T.M., Ptak A., Hornschemeier A., Kauffmann G., 2005, ApJ 634, 161
- Holt et al. (2003) Holt J., Tadhunter C.N., Morganti R., 2003, MNRAS, 342, 227
- Kalberla et al. (2005) Kalberla P.M.W., Burton W.M., Hartmann D., et al., 2005, A&A, 440. 775
- Isobe et al. (1986) Isobe T., Feigelson E.D., Nelson P.I., 1986, ApJ, 306, 490
- Labiano et al. (2005) Labiano A., O’Dea C., Gelderman R., et al., 2005, A&A, 436, 493
- Labiano et al. (2008) Labiano A., O’Dea C., Barthel P.D., de Vries W.H., Baum S.A., 2008, A&A, 477, 491
- Laing et al. (1994) Laing R.A., Jenkins C.R., Wall J.V., Unger S.W., 1994, in “The First Stromlo Symposium: The Physics of Active Galactic Nuclei”, Bicknell G.V., Dopita M.A., Quinn P.A., ASP Conf. Ser., 54, 201
- Lister (2003) Lister M., 2003, ASPC, 300, 71
- Liu et al. (2007) Liu X., Fuo W.-F., Shi W.-Z., Song H.-G., 2007, A&A, 470, 97
- Magdziarz & Zdziarski (1995) Magdziarz P.& Zdziarski A.A., 1995, MNRAS 273, 837
- Marecki et al. (2003) Marecki A., Barthel P.D., Polatidis A., Owsianik I., 2003, PASA, 20, 16
- Maiolino et al. (1998) Maiolino R., Salvati M., Bassani L., et al., 1998, A&A 338, 781
- Mazzarella et al. (1991) Mazzarella J.M., Bothun G.D., Boroson T.A., 1991, AJ, 101, 2034
- Morrison & McCammon (1983) Morrison R., McCammon D., 1983, ApJ, 270, 199
- Murgia (2003) Murgia M., 2003, PASA, 20, 19
- O’Dea et al. (1998) O’Dea C., PASP, 1998, 110, 493
- O’Dea et al. (1991) O’Dea C., Baum S.A., Stanghellini C., 1991, ApJ, 380 66
- O’Dea et al. (2000) O’Dea C., de Vries W.H., Worrall D.M., Baum S., Koekmoer A., 2000, AJ, 119, 478
- O’Dea et al. (2006) O’Dea C., Mu B., Worrall D.M., Kastner J., Baum S., de Vries W.N., 2006, ApJ, 653, 1115
- O’Dea et al. (1996) O’Dea C., Stanghellini C., Baum S., Charlot S., 1996, ApJ, 470, 806
- Osterbrock (1977) Osterbrock D.E., 1977, ApJ, 215, 733
- Ostorero et al. (2009) Ostorero L., Moderski R., Stawarz Ł, et al., 2009, AN, 330, 275
- Phillips & Shaffer (1983) Phillips R.B., Shaffer D.B., 1983, ApJ, 271, 32
- Piconcelli et al. (2008) Piconcelli E., Bianchi S., Miniutti G., et al., 2008, A&A, 480, 671
- Pihlström et al. (2003) Pihlström Y.M., Conway J.E., Vermeulen R.C., 2003, A&A, 404, 871
- Polatidis & Conway (2003) Polatidis A.G., Conway J.E., 2003, PASA, 20, 69
- Readhead et al. (1996) Readhead A.C.S., Taylor G.B., Pearson T.J., Wilkinson P.N., 1996, ApJ, 460, 634
- Risaliti (2002) Risaliti G., 2002, A&A, 386, 379
- Sambruna et al. (1999) Sambruna R., Eracleous M., Mushotzky R., 1999, ApJ, 526, 60
- Schoenmakers et al. (1999) Schoenmakers A.P., de Bryun A.G., Röttgering H.J.A., van der Laan H., 1999, A&A, 341, 44
- Scheuer (1974) Scheuer P.A.G., 1974, MNRAS, 166, 513
- Schmitt (1985) Schmitt J.H.M.M., 1985, A&A, 293, 178
- Siemiginowska et al. (2002) Siemiginowska A., Bechtold J., Aldcroft T.L., Elvis M., Harris D.E., Dobrzycki A., 2002, ApJ, 570, 543
- Siemiginowska et al. (2005) Siemiginowska A., Cheung C.C., LaMassa S., Burke D.J., Aldcroft T.L., Bechtold J., Elvis M., Worrall D.M., 2005, ApJ, 632
- Siemiginowska et al. (2008) Siemiginowska A., LaMassa S., Aldcroft T.L., Bechtold J., Elvis M., 2008, 684, 811
- Siemiginowska et al. (2003) Siemiginowska A., Stanghellini C., Brunetti G., et al., 2003, ApJ, 595, 643
- Spergel et al. (2007) Spergel D.N., Bean R., Doré O., et al., 2007, ApJS, 170, 377
- Stanghellini (2006) Stanghellini C., 2006, in Proceedings of the 8th VLBI Network Symposium, A.Marecki et al. (eds), 18
- Stanghellini et al. (1990) Stanghellini C., Baum S.A., O’Dea C.P., Morris G.B., 1990, A&A, 233, 379
- Stanghellini et al. (1997) Stanghellini C., O’Dea C.P., Baum S.A., Dallacasa D. Fanti R., Fanti C., 1997, A&A, 325, 953
- Stanghellini et al. (1998) Stanghellini C., O’Dea C.P., Dallacasa D., Baum S.A., Fanti R., Fanti C., 1998, A&AS, 131, 303
- Stanghellini et al. (1999) Stanghellini C., O’Dea C.P., Murphy D.W., 1999, A&ASS, 134, 309
- Stawarz et al. (2008) Stawarz Ł., Ostorero L., Begelman M.C., Moderski R., Kataoka J., Wagner S., 2008, ApJ, 680, 911
- Strüder et al. (2001) Strüder L., Briel U., Dannerl K., et al., 2001, A&A 365, L18
- Turner et al. (2001) Turner M.J.L., Abbey A., Arnaud M., et al., 2001, A&A 365, L27
- Vermeulen et al. (2003) Vermeulen R.C., Pihlström Y.M., Tschager W., et al., 2003, A&A, 404, 861
- Véron-Cetty & Veron (2006) Véron-Cetty M.-P. & Veron P., 2006, “A catalogue of quasars and active nuclei: 12th edition”
- Vink et al. (2005) Vink J., Snellen I., Mack K.-H., Schillizzi R., 2005, MNRAS, 367, 928
- Voges et al. (1999) Voges W., Aschenbach B., Boller T., et al., 1999, A&AS, 349, 389
- White et al. (1997) White R.-L., Becker R.-H., Helfand D.-J., Gregg M.-D., 1997, ApJ, 475, 479
- Xiang et al. (2005) Xiang L., Dallacasa R., Cassaro P., Jiang D., Reynolds C., 2005, 434, 123