Step bunching of vicinal 6H-SiC{0001} surfaces
Abstract
We use kinetic Monte Carlo simulations to understand growth- and etching-induced step bunching of 6H-SiC{0001} vicinal surfaces oriented towards and . By taking account of the different rates of surface diffusion on three inequivalent terraces, we reproduce the experimentally observed tendency for single bilayer height steps to bunch into half unit cell height steps. By taking account of the different mobilities of steps with different structures, we reproduce the experimentally observed tendency for adjacent pairs of half unit cell height steps to bunch into full unit cell height steps. A prediction of our simulations is that growth-induced and etching-induced step bunching lead to different surface terminations for the exposed terraces when full unit cell height steps are present.
pacs:
81.10.Aj, 81.15.Kk, 81.65.CfI Introduction
Silicon carbide (SiC) is a very promising material for microelectronic applications because of its superior electronic properties, high thermal and chemical stability, high-power and high-frequency capability, and high tolerance to radiation damage.Matsunami ; Fissel SiC is also an attractive candidate as a substrate for the heteroepitaxial growth of other materials.Davis ; Okumura A particulary exciting example (which motivated the present study) is the growth of epitaxial graphene by thermal decomposition of the basal surfaces of single crystal 4H and 6H SiC.Haas Nevertheless, SiC will not reach its anticipated potential until a variety of problems are solved, not least being the need to controllably grow device-quality single crystal material on a large scale.Matsunami ; Fissel ; Powell
One approach to the growth problem is “step-controlled” epitaxy, where new layers grown onto surfaces vicinal to the hexagonal basal planes inherit the stacking order of the substrate through the step-flow mode of growth.Matsunami Unfortunately, step-flow growth on vicinal surfaces does not always proceed by the uniform motion of a train of evenly spaced steps. Instead, growth-induced step bunching often occurs, as it invariably does when vicinal surfaces are etched by exposure to hot hydrogen gas. Suggestions for the origin of SiC step bunching include impurity adsorption, Ohtani ; Papaioannou differences in surface energetics for different bilayers of -SiC polytypes, Heine ; Chien ; Kimoto ; Tanaka differences in intrinsic step velocities and step configurations, Kimoto ; Tanaka ; Stout and other differences in growth kinetics.Frisch ; Heuell However, no systematic exploration of any particular mechanism and comparison of the results with all available data seems to have been performed until now.
This paper reports the results of kinetic Monte Carlo (KMC) simulations designed to identify the kinetic pathways that promote growth- and etching-induced step bunching of vicinal 6H-SiC surfaces. We focus on surfaces vicinal to (0001) (Si-terminated) and () (C-terminated) with steps running perpendicular to the and directions. These particular starting surfaces were chosen to make contact with experimental observations made using atomic force microscopy (AFM), low-energy electron diffraction (LEED) analysis, high-resolution transmission electron microscopy (HRTEM), and scanning tunnelling microscopy (STM).Kimoto ; Nakamura ; Nakamura2 ; Nakagawa ; Nakajima ; Feenstra ; Hayashi Our main conclusion is that the experimental results for the Si-face are quite explicable using a lattice model that recognizes that there are three inequivalent terraces for surface diffusion and two inequivalent steps with different mobilities. The C-face data are similarly explicable (or at least rationalizable) if the terrace diffusion rates and step mobilities are less different on this face than on the Si-face.
II Previous Work
II.1 Experimental Observations
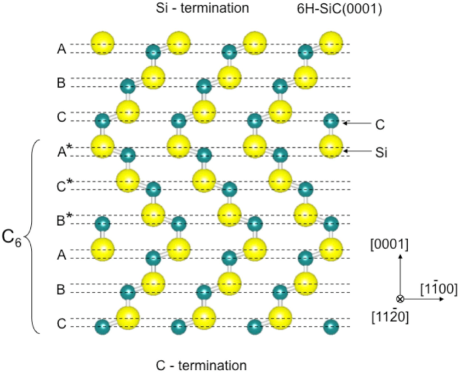
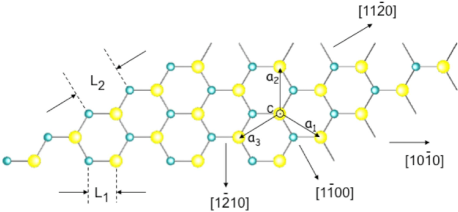
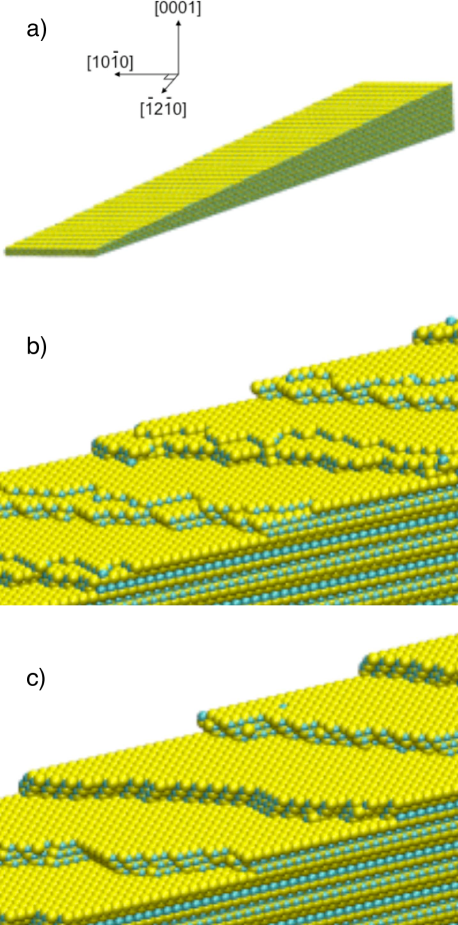
This section reviews the experimental observations of etching- and growth-induced bunching for surfaces vicinal to the basal planes of 6H-SiC. The designation 6H refers to the bulk unit cell indicated in Figure 1 where six bilayers of silicon and carbons atoms are arranged in the particular stacking sequence shown. If it were exposed to vacuum, the top layer of silicon atoms would be a typical Si-terminated surface. The bottom layer of carbon atoms similarly exposed would be a typical C-terminated surface. Along the c-axis of 6H-SiC crystal, the bilayers are arranged in two groups of three bilayers each. Each bilayer is exactly the same apart from rigid lateral shifts within one group of bilayers and rotation of the lattice by around the c-axis from one group of bilayers (A, B, C) to the other (). The hexagonal arrangement of atoms shown in Figure 2 is a (projected) view along of one of the bilayers from the -group seen in edge-view in Figure 1.
There have been many experimental studies of growthKimoto ; Tanaka ; Papaioannou ; Ohtani ; Syvajarvi ; Kong ; Ueda ; Nakamura2 and etchingNakamura ; Nakagawa ; Nakajima ; Feenstra ; Hayashi of 6H SiC surfaces cut slightly vicinal to its basal planes. The details vary (temperature, doping, and Si/C ratio during growth), but most papers focus on the Si-terminated face with miscuts oriented along the direction. Only a few report results for the C-terminated surface or for vicinal miscuts oriented along the direction. For our purposes the systematic H-etching experiments conducted by Feenstra and co-workers are particularly valuable.Feenstra Table I summarizes their AFM and HRTEM observations for nominally on-axis samples and samples with intentional miscuts of and . The numbers and in the table refer to observations of more-or-less ordered arrays of bunches where 3 Si-C bilayer steps have bunched into a single step with the height of unit cell and where two such bunches have further bunched into one unit cell height steps. Etching of surfaces miscut along produces increased bunching into - unit cell height steps which may more properly be regarded as “nanofacets”.Nakagawa For the same surface miscut along , the authors find no average step orientation due to large-scale step meandering. From the corresponding image of the C-face, we infer (hence the quotation marks in the table) similar, but less pronounced, step meandering. Quite generally, the data summarized Table I demonstrate that the tendency for etching-induced bunching is greater on the Si-face than on the C-face and greater for steps oriented perpendicular to than for steps oriented perpendicular to .
| 6H SiC(0001) | Etching Results | (Ref. Feenstra, ) | |
|---|---|---|---|
| vicinal angle | |||
| Si-terminated | |||
| 1 | 1 | 4-5 | |
| “1/2” | 1/2 | MEANDER | |
| C-terminated | |||
| 1/2 | “1” | 1 | |
| “1/2” | 1 | “meander” |
There is no single data set for growth-induced step bunching comparable to the etching-induced results summarized in Table I. Nevertheless, a survey of the literature reveals trends very similar to the etching data. Thus, for surfaces miscut by toward , Kimoto et al.Kimoto find that growth on Si-terminated surfaces produces unit cell height bunches while growth on comparable C-terminated surfaces is twice as likely to remain completely unbunched (only SiC bilayer steps appear) as to bunch into unit cell height steps. Similarly, data obtained for step-flow growth on vicinal Si-terminated surfaces oriented toward exhibit 6 bilayer bunches (full unit cell), compared to only 3 bilayer bunches (half unit cell) observed for similar surfaces miscut along .Nakamura2 Therefore, as during etching, the tendency for growth-induced bunching is greater on the Si-face than on the C-face and greater for steps oriented perpendicular to than for steps oriented perpendicular to . For both growth and etching, step bunching is always more pronounced on surfaces with higher miscut angles.
II.2 KMC Simulations
Three groups have used kinetic Monte Carlo simulations to study step flow growth on vicinal SiC{0001} surfaces. Heuell used a one-dimensional model that did not distinguish carbon atoms from silicon atoms.Heuell Two inequivalent types of steps were considered and the probabilities for a diffusing adatom to attach to each step from the terraces below and above were treated as independent parameters. A parameter set was found were an initial train of height-one steps bunched into a train of height-six steps. However, trains of unit cell height steps are commonly observed in experiments, which suggests that a train of single bilayer steps bunches first into a train of unit cell height steps, which then bunch into full unit cell height steps.Kimoto ; Feenstra Heuell’s model does not produce this behavior.
Stout developed a very elaborate KMC simulation that took account of the SiC crystal structure, the transport, adsorption, and surface diffusion of physisorbed precursors, the dissociative chemisorption, surface diffusion, and desorption of dissociated species, and the attachment/detachment of adatoms to/from step edges.Stout The energy barrier for a particular atom to make an activated Monte Carlo move was taken to be proportional to the product of the coordination numbers of the initial state site and the final state site. For growth onto surfaces vicinal to 6H SiC{}, Stout’s simulations bunched an initial train of single bilayer steps into a train where two nearby single bilayer steps accompany a 4 bilayer height step. No bunching into 3 bilayer height steps or 6 bilayer height steps was observed.
Finally, Camarda and co-workers used a full lattice KMC model including defect sites to study step flow growth onto surfaces vicinal to 4H SiC(0001).Camarda These authors did not treat silicon and carbon atoms as diffusing species; the smallest growth unit considered was a Si-C dimer. Bunching was observed, but the step heights were not reported.
III Simulation Model
We have developed a three-dimensional KMC simulation model based on the crystal structure of SiC. In this paper, the model is used to study step-flow etching and step-flow growth of surfaces vicinal to 6H-SiC{0001}. Later work will address island nucleation and multilayer roughness on singular surfaces and thermal decomposition of stepped and flat surfaces to produce epitaxial graphene. The starting vicinal surface studied was usually a uniform train of 36 single bilayer steps with a miscut angle of () for miscut oriented towards () . Otherwise (see Figure 2), miscuts oriented towards were treated using “helicoidal” boundary conditions (HBC)Camarda2 along the direction and periodic boundary conditions (PBC) along the direction. The typical system size was . Miscuts oriented towards were treated using HBC along the direction and PBC along the direction. The typical system size was .
The standard KMC methodBKL identifies a set of elementary “moves” and catalogs their relative rates. For our simulations, thermal desorption directly into the gas phase was not allowed, but all atoms (except fully coordinated bulk atoms) were permitted to move to empty nearest-neighbor or next-nearest-neighbor surface sites (with equal probability) at a rate , where , is Boltzmann’s constant, and is the substrate temperature ( K for most of our simulations). The activation energy depends on the atom type and its local coordination through a bond-counting rule that includes only the four possible nearest neighbors. All the simulations we report used
with 0.75 eV, 0.35 eV, and 0.65 eV. The absolute values of these parameters are not crucial because they only represent effective pair-bond energies. What matters is their relative ordering, which reflects (i) the stability of the SiC crystal and (ii) the much greater strength of the C-C bond compared to the Si-Si bond.
We come now to the crucial feature that distinguishes our simulations from others. For one species type (C or Si), the surface jump rate computed using Eq. (1) is exactly the same when the atom sits on any of the six 6H -type terraces (called , , , , , and in Figure 1) exposed by a vicinal surface with only single bilayer steps. However, the beyond nearest-neighbor interactions that energetically distinguish the many different polytypes of SiC from one other imply that the energy barriers to surface migration cannot be exactly the same for all six terraces. The relevant surface diffusion barriers have not been reliably computed or measured. However, the first-principles, surface total energy calculations of Righi et al.Righi show a clear energetic preference for SiC(0001) surfaces to continue their subsurface stacking order. This conclusion agrees with the observation that 3C polytype islands nucleate on 4H- and 6H-SiC(0001) substrates and with observed stable surface terminations for these exposed faces.Starke ; Heinz ; Nakagawa Accordingly, we use the surface energy ordering computed in Ref. Righi, to scale the energy barriers for terrace surface diffusion. The scaling factors used were 1.0 for the atoms sitting on and terraces, 1.15 for the atoms sitting on and terraces, and 1.3 for the atoms sitting on and terraces. This procedure is consistent with our use of the binding energies in Eq. (1) to estimate the bare energy barrier. Our choice of the scaling factors, or, more exactly, their ordering, is in agreement with the relative stability of the inequivalent terraces implied by the three different step velocities observed during the step flow growth of graphene by the decomposition of vicinal 6H-SiC(0001).Hupalo
Etching was simulated very simply. Every time an atom was selected to move along the surface, it was instead removed entirely from the simulation with a probability , where . The etching results were quite insensitive to the exact value of . To study growth, we ignored precursor effects and deposited silicon and carbon with equal probability at randomly chosen empty surface sites of the SiC lattice. The average deposition rate used, , corresponds to a typical SiC growth rate of 1 m/h.
IV Results
Our model produces very similar results for growth and etching of the Si-terminated face and C-terminated face of 6H SiC. This differs from the experimental observations summarized in Section II. For that reason, this section reports results only for the Si-terminated face. The C-terminated face is discussed in Section V(D).
IV.1 Si-face with vicinal miscut towards
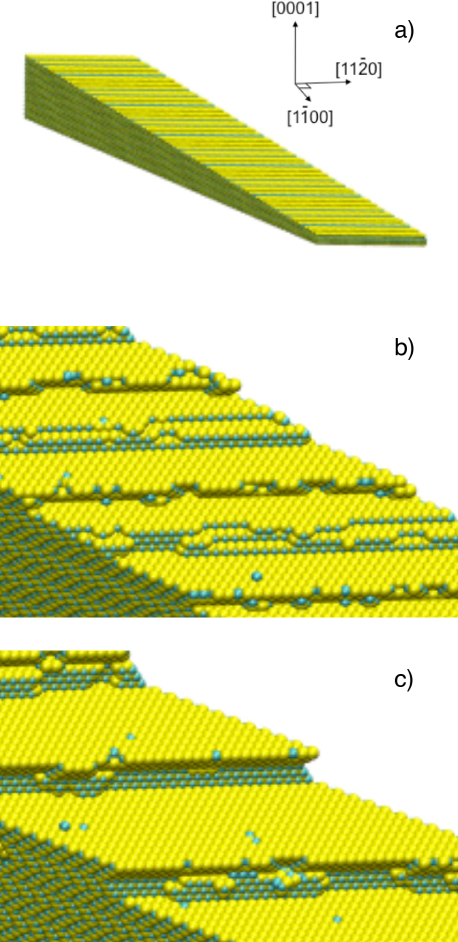
Figure 3 shows a sequence of simulated morphologies during step flow growth onto a vicinal 6H-SiC(0001) surface with the miscut towards the direction. The step bunches that eventually form have the height of one 6H unit cell (6 bilayers). Note, however, that unit cell height steps (3 bilayers) form first. The faster growing bunch () catches up with the slower growing bunch (ABC) to form the final full unit cell height bunch. The step-edges of the final bunches are mostly straight and aligned along direction, which is the energetically most stable configuration. The overhanging step risers produced by the simulation is an artifact of the nearest-neighbor approximation used in (1). A less steep (and smoother) step occurs when next-nearest-neighbors are included, but at the cost of a much slower simulation. This change introduces no qualitative effects on the bunching, so we used only the simpler model in this paper.
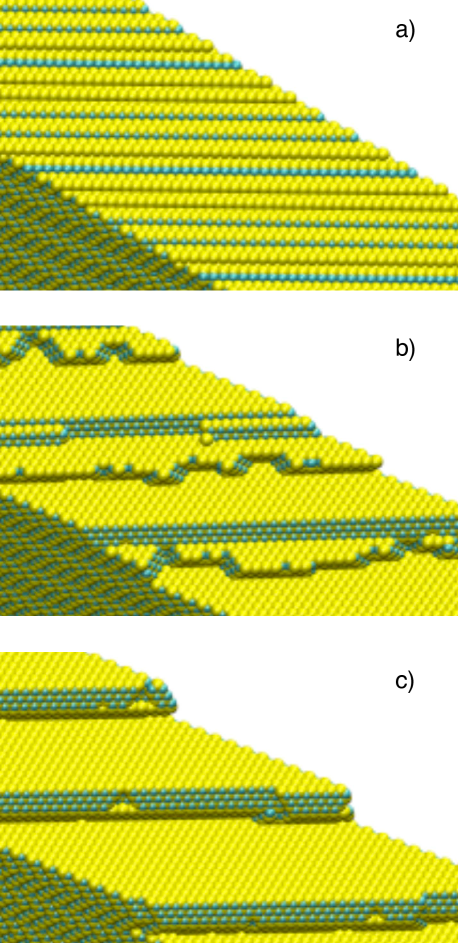
For comparison with Figure 3, Figure 4 shows a sequence of simulated morphologies during the step flow etching of a vicinal 6H-SiC(0001) surface with the miscut towards direction. The etching morphology we obtain is similar to the growth morphology except that the () bunch retracts faster than (ABC), and ends up at the bottom of the full unit cell height step. During growth, the () bunch winds up on top of the (ABC) bunch. It is interesting to note that many experiments precede epitaxial growth of 6H-SiC with a gas etching step to smoothen the surface. To study this case, we performed a growth simulation beginning with the surface shown in the last panel of Figure 4. As shown in Figure 5, the starting full unit cell height step with (ABC) on top of ) flips during the growth to a full unit cell height step with ) on top of (ABC). In other words, the starting surface does not matter and the final panel of Figure 3 is the same as the final panel of Figure 5.

IV.2 Si-face with vicinal miscut towards
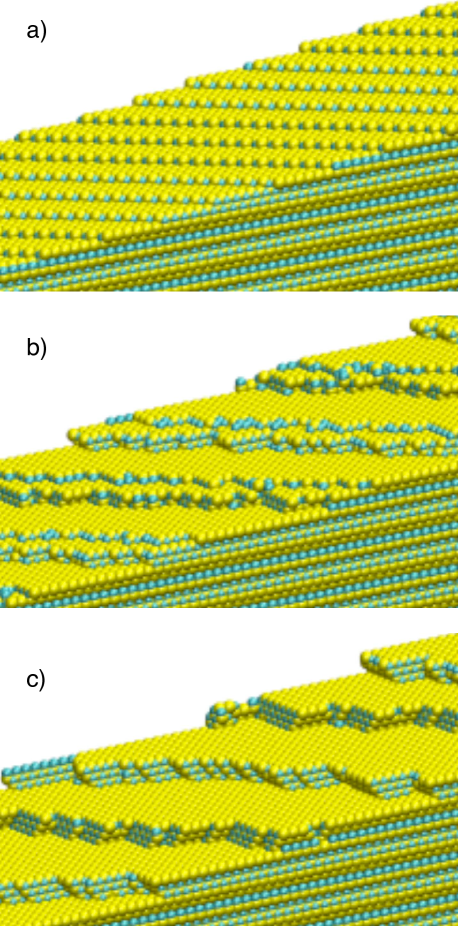
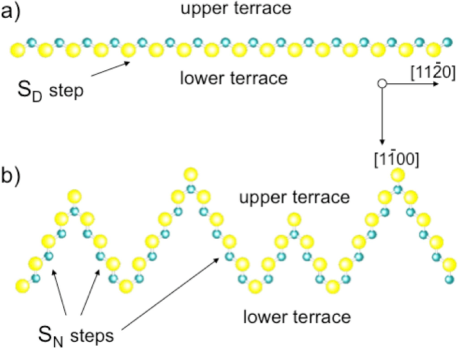
Figure 6 shows a sequence of simulated morphologies during step flow growth onto a vicinal 6H-SiC(0001) surface with the miscut towards the direction. We observe the formation of unit cell height steps with zigzag shaped step edges. On average, the steps are aligned along the direction (perpendicular to the miscut direction). However, the straight segments of the step edges are aligned along the close-packed directions. Etching produces very similar results in the sense that unit cell height steps form. This is shown in Figure 7.
V Discussion
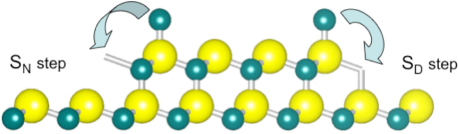
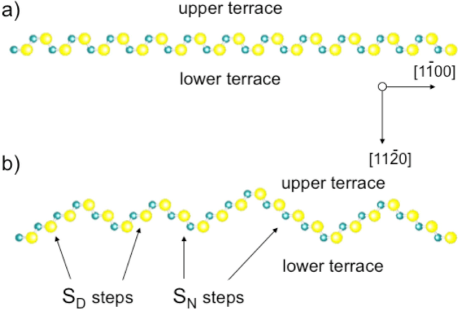
The results of our KMC simulations are in good qualitative agreement with experiments. The formation of full unit cell height steps (six bilayers) is inherent in SiC step-flow growth/etching on vicinal 6H-SiC(0001) surfaces with the miscut towards . On the other hand, unit cell height steps form during simulations of growth/etching when the miscut is along . We understand all these features in terms of the six different steps that appear on any surface composed of only bilayer height steps (top panel of Figure 4 or Figure 7). There are six different velocities because there are three inequivalent terraces where surface diffusion events occur and two inequivalent step edges, where attachment, detachment, and interlayer transport events occur. As described in Section III, the surface diffusion rate is fastest for adatoms sitting on A and A∗ terraces, slower for adatoms sitting on C and B∗ terraces, and slowest for adatoms sitting on B and C∗ terraces. Figure 8 shows the two types of steps.Pechman ; Ramachandran For the step, a next-to-next nearest neighbor jump is required for an atom to attach to the step from its upper bounding terrace. Moreover, after this jump occurs, the attached atom is only singly bonded to the step, and thus easily detached. For the step, only a next-nearest neighbor jump is required for an atom to attach to the step from its upper bounding terrace. After this jump occurs, the attached atom is doubly bonded to the step, and thus less likely to detach.
Figure 9 and Figure 11 show scenarios for growth and etching, respectively. The fastest steps during growth are bounded from above by the most stable terraces (A and A∗) . The slowest steps during growth are bounded from above by the least stable terraces (C and B∗). For the same reason of stability, fast growing steps are the slowest etching and vice versa. Accordingly, the terraces exposed at the time when unit cell height steps are present on the surface, in both cases correspond to A and (see Figure 1), which is in agreement with experiments.Hayashi
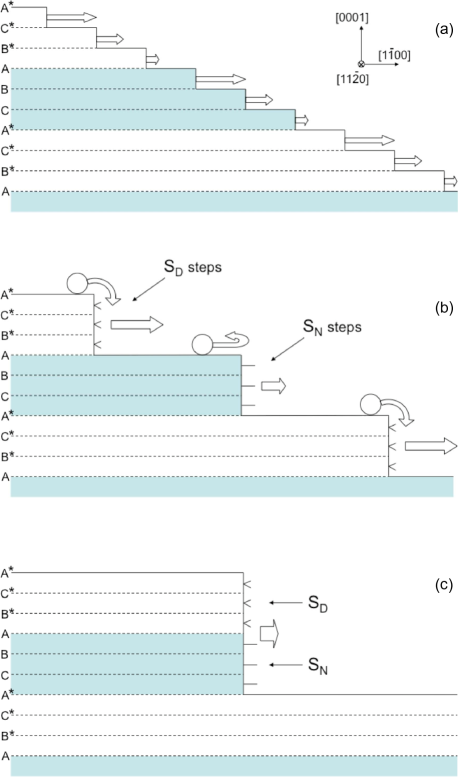
V.1 Step-Flow Growth
The top panel of Figure 9 shows a vicinal surface composed of single bilayer steps. The arrows on the steps reflect their relative velocities due to the rates of surface diffusion on the three inequivalent terraces mentioned just above. As a result, the single bilayer steps bunch into the unit cell height steps shown in the second panel of Figure 9. The subsequent bunching of these steps into the full unit cell height step shown in the final panel of Figure 9 occurs because one half cell height step is type and the other is type. The latter moves faster than the former because the next-to-next nearest neighbor jump required for attachment to the step from above is not allowed in our model. In reality, we presume there is simply a higher barrier for this process to occur at a step than at a step. In other words, the Ehrlich-Schwoebel barriers associated with these steps are different.Ehrlich ; Michely
The preceding discussion applies directly for vicinal miscuts toward the direction. However, we have stated that full unit cell height steps do not form in our SiC growth simulations for miscuts toward the direction. This occurs because the step edges in this case have a natural zigzag shape, consisting of alternating straight segments, corresponding to , or steps (see Figure 10). Each step edge has equal portions of and steps, and, as a result, all unit cell height steps propagate with the same speed. Of course, if the miscut is not exactly toward the direction, adjacent unit cell height steps differ in their relative population of and step edges. This may trigger the formation of full unit cell height steps.
V.2 Step Flow Etching
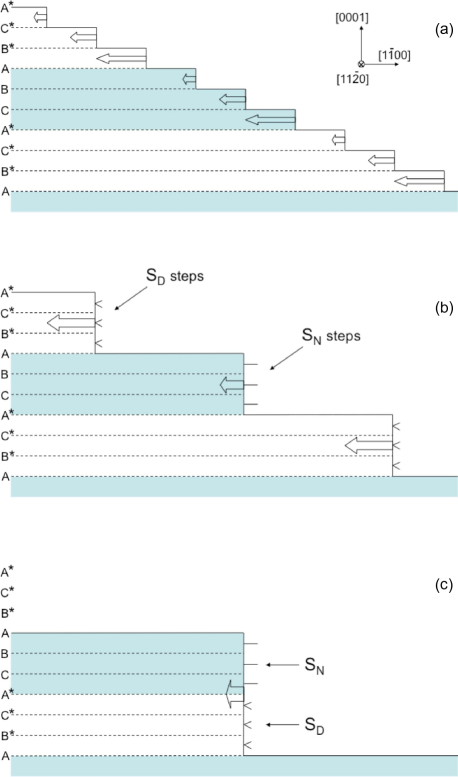
Etching is often regarded as the inverse of growth. Nakamura ; Feenstra Therefore, mimicking our discussion of growth, the top panel of Figure 11 shows a vicinal surface composed of single bilayer steps. The arrows on the steps reflect their etch velocities due to the different step detachment rates associated with the three inequivalent terraces discussed earlier. As a result, the steps bunch to form the unit cell height steps shown in the second panel of Figure 11. The subsequent bunching of these steps into the full unit cell height step shown in the final panel of Figure 9 occurs because the -type step, which has triply bonded outermost atoms, etches more slowly than the -type step, which has only doubly bonded outermost atoms.
In agreement with experiments, we observe the development of “triangular” protrusions (see Figure 4) which form as a result of etching at step bunches.Ramachandran As Figure 12 shows, the straight segments of these protrusions are aligned at angles of with respect to the direction of miscut () and thus correspond to energetically stable step bunches. As discussed in detail in Ref. Ramachandran, , the outermost atoms of these protrusions, which have only two bonds with nearest neighbors, constitute another source of instability. As a result, preferential etching of these protrusions leads to the formation of full unit cell height steps.
In our simulations of SiC etching for miscut towards , we do not observe the formation of unit cell height steps. This agrees with the most recent experimental results. Nakajima ; Feenstra ; Hayashi We explain this in terms of the previously discussed zigzag structure of the steps which occur on this surface. Each unit cell height step with a zigzag shape has equal portions of faster and slower etched straight segments, which correspond to and step bunches. For this reason the etching rates of all unit cell height step are identical (on average) and unit cell height steps do not form.
Notwithstanding the foregoing, some etching experiments on surfaces with miscut towards do see the formation of full unit cell height steps. Nakamura ; Nakagawa ; Hayashi A possible explanation for these conflicting observations is the previously mentioned possibility of deviations of the miscut from exactly with its attendant steps with faster and slower etching segments. When the populations of these segments is not equal, the unit cell height steps with more fast-etching segments catch up to the steps with fewer fast-etching segments.Nakajima ; Hayashi The result is a train of full unit cell height steps.
V.3 Surface Terminations
Only one type of terrace is exposed to the vacuum after all full unit cell steps have formed on a miscut surface. However, our KMC simulations predict that the exposed terrace is not the same after growth as it is after etching. After growth, the -bunch (the outermost atoms of bilayer-steps have two bonds with nearest neighbors and two dangling bonds) is on top of the ABC-bunch (the outermost atoms of bilayer-steps have three bonds with nearest neighbors and one dangling bond). This is called the surface termination in the literature.Hayashi After etching, the sequence of bilayers at the surface is opposite: . This is called the surface termination. Cross section TEM experiments could be used to test this prediction.
V.4 The C-terminated surface
The simulation results we have presented so far describe the evolution of surface morphology during the epitaxial growth/etching of 6H-SiC on the vicinal 6H-SiC(0001) surface (Si-terminated face). Our simulation results for the C-terminated face (6H-SiC(000)), using the same model parameters, are qualitatively very similar. This disagrees with the step bunching behavior observed in experiments which is typically less pronounced for the C-face compared to the Si-face.Kimoto ; Feenstra On the other hand, the C-face data are quite explicable if the terrace diffusion rates and step mobilities differ from their values on the Si-face.
The terrace diffusion scaling factors used to take account of the three inequivalent terraces of SiC(0001) were chosen based on the Si-face calculations of Righi et. al.Righi These authors did not perform similar calculations for the C-face and it is possible that the results are different. One possibility is that the scale factor ordering is the same as for the Si-face, but that their magnitudes are less different. Another possibility is that the ordering of the scale factors differs on the C-face. Experimental support for this comes from the different surface termination observed for the two polar faces of 6H-SiC{0001}. The so-called reconstruction, which stabilizes hexagonal stacking at the surface ( stable surface termination) is sometimes observed on the C-face.Seubert This implies a different ordering for the three inequivalent terrace scaling factors than for the Si-face.
It seems quite likely that the Ehrlich-Schwoebel barriers to interlayer diffusion (which strongly influence the bunching of half unit cell height steps into full unit cell height steps in our model) are different on the C-face and the Si-face. The magnitude of these barriers is intimately connected to the structure of the steps and there is theoretical evidence that the step structure indeed depends on the polarity of the surface.Pearson If the difference between the corresponding barriers is less pronounced for the C-face, we would find the experimentally observed delay in the formation of full unit cell height steps during the growth of 6H-SiC on the vicinal 6H-SiC(000) surface. Moreover, strong barriers to interlayer diffusion at both and steps suppress interlayer mass transport and stabilize the persistence of single bilayer steps. This would explain the observed experimentally preference of bilayer height steps on C-terminated surfaces to remain completely unbunched during growth.Kimoto
Finally, it is possible that step bunching is less pronounced on the C-face because the elastic-driven repulsive interaction between the steps of a vicinal surfaceMuller is more pronounced on the C-face compared to the Si-face. The repulsion depends on the step stiffness,Marchenko which in turn depends on the step structure, which are doubtless different for the two faces.
VI Conclusions
We have used lattice KMC simulations to study the formation of step bunches during growth and etching of 6H-SiC(0001) vicinal surfaces. For both situations, the simulations show that single bilayer steps bunch into half unit cell steps (3 bilayers each), which subsequently bunch into full unit cell steps. This is consistent with experimental observations for both the Si-terminated face and the C-terminated face except that we obtain greater bunching for the C-face than seen in experiment. The main driving force for bunching into half unit cell height steps is that surface diffusion is not equally fast on all bilayer terraces. The main driving force for the subsequent bunching into full height unit cells is the existence of two different local atomic step structures, which leads to two different step mobilities. A prediction of the model which invites an experimental test is that growth-induced and etching-induced step bunching lead to different surface terminations for the exposed terraces when full unit cell steps are present.
Acknowledgements.
The authors acknowledge helpful correspondence with Randall Feenstra and Miron Hupalo. The work of V.B. was supported by the Department of Energy under Grant No. DE-FG02-04-ER46170. We also acknowledge a grant of computer time from the National Center for Supercomputing Applications.References
- (1) H. Matsunami, T. Kimoto, Mater. Sci. Eng., R. 20, 125 (1997).
- (2) A. Fissel, Phys. Rep. 379, 149 (2003).
- (3) R. F. Davis, S. Tanaka, R. S. Kern, J. Cryst. Growth 163, 93 (1996).
- (4) H. Okumura, M. Horita, T. Kimoto, J. Suda, Appl. Surf. Sci. 254, 7858 (2008).
- (5) J. Haas, W. A. de Heer, and E. H. Conrad, J. Phys.: Condens. Matter 20, 323202 (2008).
- (6) J. A. Powell, and D. J. Larkin, Appl. Phys. Status Solidi B 202, 529 (1997).
- (7) N. Ohtani, M. Katsuno, J. Takahashi, H. Yashiro, M. Kanaya, Phys. Rev. B 59, 4592 (1999).
- (8) V. Papaioannou, J. Stoemenos, L. Di Cioccio, D. David, C. Pudda, J. Cryst. Growth 194, 342 (1998).
- (9) T. Kimoto, A. Itoh, H. Matsunami, and T. Okano, J. Appl. Phys. 81, 3439 (1997).
- (10) S. Tanaka, R. S. Kern, R. F. Davis, J. F. Wendelken, J. Xu, Surf. Sci. 350, 247 (1996).
- (11) V. Heine, C. Cheng, and R. J. Needs, J. Am. Ceram. Soc. 74, 2630 (1991).
- (12) F. R. Chien, S. R. Nutt, W. S. Yoo, T. Kimoto, and H. Matsunami, J. Mater. Res. 9, 940 (1994).
- (13) P. J. Stout, J. Vac. Sci. Tech. A 16, 3314 (1998).
- (14) T. Frisch and A. Verga, Phys. Rev. Lett. 94, 226102 (2005).
- (15) P. Huell, M.A. Kulakov, and B. Bullemer, Inst. Phys. Conf. Proc. 137, 353 (1994); P. Heuell, M. A. Kulakov, B. Bullemer, Surf. Sci. 331-333, 965 (1995).
- (16) S. Nakamura, T. Kimoto, H. Matsunami, S. Tanaka, N. Teraguchi, and A. Suzuki, Appl. Phys. Lett. 76, 3412 (2000).
- (17) S. Nakamura, T. Kimoto, H. Matsunami, J. Cryst. Growth 256, 341 (2003); S. Nakamura, ibid, 256, 347 (2003).
- (18) H. Nakagawa, S. Tanaka, and I. Suemune, Phys. Rev. Lett. 91, 226107 (2003).
- (19) A. Nakajima, H. Yokoya, F. Furukawa, and H. Yonezu, J. Appl. Phys. 97, 104919 (2005).
- (20) S. Nie, C. D. Lee, R. M. Feenstra, Y. Ke, R. P. Devaty, W. J. Choyke, C. K. Inoki, T. S. Kuan, G. Gu, Surf. Sci. 602, 2936 (2008).
- (21) K. Hayashi, K. Morita, S. Mizuno, H. Tochihara, S. Tanaka, Surf. Sci. 603, 566 (2009).
- (22) H. S. Kong, J. T. Glass, and R. F. Davis, J. Appl. Phys. 64, 2672 (1988).
- (23) T. Ueda, H. Nishino, and H. Matsunami, J. Cryst. Growth 104, 695 (1990).
- (24) M. Syväjärvi, R. Yakimova, E. Janzén, J. Cryst. Growth 236, 297 (2002).
- (25) M. Camarda, A. La Magna, and F. La Via, J. Comput. Phys. 227, 1075 (2007); M. Camarda, A. La Magna, P. Fiorenza, F. Giannazzo, F. La Via, J. Cryst. Growth 310, 971 (2008).
- (26) M. Camarda, A. La Magna, F. La Via, J. Comp. Phys. 227, 1075 (2007).
- (27) A. B. Bortz, M. H. Kalos, J. L. Lebowitz, J. Comp. Phys. 17, 10 (1975).
- (28) M. C. Righi, C. A. Pignedoli, G. Borghi, R. Di Felice, C. M. Bertoni, and A. Catellani, Phys. Rev. B 66, 045320 (2002).
- (29) U. Starke, J. Schardt, J. Bernhardt, M. Franke, and K. Heinz, Phys. Rev. Lett. 82, 2107 (1999).
- (30) K. Heinz, J. Bernhardt, J. Schardt and U. Starke, J. Phys.: Condens. Matter 16, S1705 (2004).
- (31) M. Hupalo, E. Conrad, and M. C. Tringides, arXiv:0809.3619v1 [cond-mat.mtrl-sci].
- (32) R. J. Pechman, X. -S. Wang, and J. H. Weaver, Phys. Rev. B 52, 11412 (1995).
- (33) V. Ramachandran, M. F. Brady, A. R. Smith, R. M. Feenstra, and D. W. Greve, J. Electron. Mater. 27, 308 (1998).
- (34) G. Ehrlich and F. G. Hudda, J. Chem. Phys. 44, 1039 (1966); R. L. Schwoebel, J. Appl. Phys. 40, 614 (1969).
- (35) T. Michely and J. Krug, Islands, Mounds and Atoms, Springer Series in Surface Science, Vol. 42 (Springer, New York, 2004).
- (36) A. Seubert, J. Bernhardt, M. Nerding, U. Starke, and K. Heinz, Surf. Sci. 454-456, 45 (2000).
- (37) E. Pearson, T. Takai, T. Halicioglu and W. A. Tiller, J. Cryst. Growth 70, 33 (1984).
- (38) P. Müller and A. Saúl, Surf. Sci. Rep. 54, 157 (2004).
- (39) V. I. Marchenko and A. Y. Parshin, Zh. Eksp. Teor. Fiz. 79, 257 (1980) [Sov. Phys. JETP 52, 129 (1980)].